Git Product home page Git Product logo

xtrace's Introduction

Icon Xtrace

Note: This project has been superseeded by the more rigourous SwiftTrace.

Trace Objective-C method calls by class or instance

Xtrace is a header Xtrace.h and a C++ implementation file Xtrace.mm that allows you to intercept all method calls to instances of a class or a particular instance giving you output such as this:

   [<UILabel 0x8d4f170> setCenter:{240, 160}] v16@0:4{CGPoint=ff}8
	[<UILabel 0x8d4f170> actionForLayer:<CALayer 0x8d69410> forKey:<__NSCFString 0x8a535e0>] @16@0:4@8@12
	 [<UILabel 0x8d4f170> _shouldAnimatePropertyWithKey:<__NSCFString 0x8a535e0>] c12@0:4@8
	 -> 1 (_shouldAnimatePropertyWithKey:)
	-> <NSNull 0x194d068> (actionForLayer:forKey:)
  [<UILabel 0x8d4f170> window] @8@0:4
  -> <UIWindow 0x8a69920> (window)
  [<UILabel 0x8d4f170> _isAncestorOfFirstResponder] c8@0:4
  -> 0 (_isAncestorOfFirstResponder)
 [<UILabel 0x8d4f170> layoutSublayersOfLayer:<CALayer 0x8d69410>] v12@0:4@8
  [<UILabel 0x8d4f170> _viewControllerToNotifyOnLayoutSubviews] @8@0:4
   [<UILabel 0x8d4f170> _viewDelegate] @8@0:4
   -> <nil 0x0> (_viewDelegate)

To use, add Xtrace.{h,mm} to your project and add an import of Xtrace.h to your project's ".pch" file so you can access its methods from anywhere in your project. There is a simple category based shortcut interface to start tracing:

	[MyClass xtrace]; // to trace all calls to instances of a class
	// this will intercept all methods of any superclasses as well
    // but only for instances of the class that has been traced (v2.1)
	
	[instance xtrace]; // to trace all calls to a particular instance.
	// multiple instances can by traced, use "notrace" to stop tracing
    // instance tracing takes precedence over class based filtering.

    [Xtrace traceBundleContainingClass:myClass];
    // trace your entire app's classes or those of an embedded framework
    
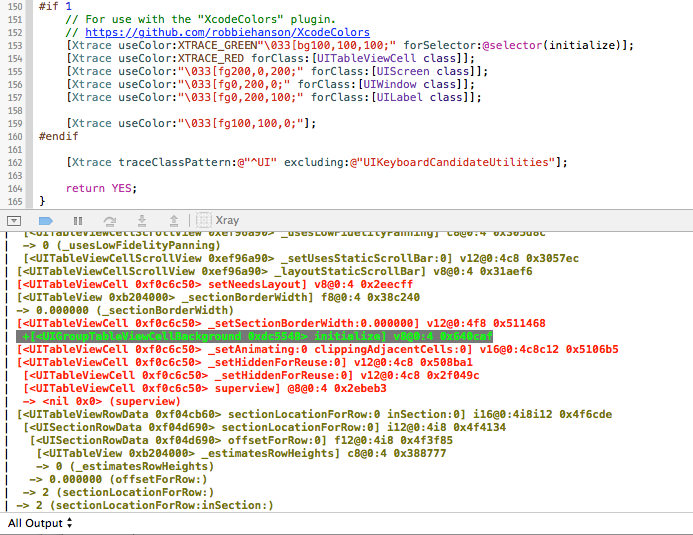
    [Xtrace traceClassPattern:@"^UI" excluding:nil]; // trace all of UIkit

If you have the XcodeColors plugin installed you can now color traces by selector, class or group of classes:

Icon

As an alternative to building Xtrace into your project, Xtrace is now included in the "code injection" plugin from injectionforxcode.com. Once you have injected, all xtrace methods are available for you to use in lldb.

(lldb) p [UITableView xtrace]

// dump pseudo-header for class
(lldb) p [UITableView xdump]
@interface UITableView : UIScrollView {
    id<UITableViewDataSource> _dataSource; // @"<UITableViewDataSource>"
    UITableViewRowData * _rowData; // @"UITableViewRowData"
    float _rowHeight; // f
    float _sectionHeaderHeight; // f
    float _sectionFooterHeight; // f
    float _estimatedRowHeight; // f
    float _estimatedSectionHeaderHeight; // f
    float _estimatedSectionFooterHeight; // f
    CGRect _visibleBounds; // {CGRect="origin"{CGPoint="x"f"y"f}"size"{CGSize="width"f"height"f}}
...

The example project, originally called "Xray" will show you how to use the Xtrace module to get up and running. Your milage will vary though the source should build and work for 32 bit configurations on an iOS device or 64 bit OS X applications or the simulator. The starting point is the XRAppDelegate.m class. The XRDetailViewController.m then switches to instance viewing of a specific UILabel when the detail view loads.

Display of method arguments is now on by default, but if you have problems:

[Xtrace showArguments:NO];

You can display the calling function on entry by setting:

[Xtrace showCaller:YES];

You should also be able to switch to log the "description" of all values using:

[Xtrace describeValues:YES];

Other features are a method name filtering regular expression. These filters are applied as the class is "swizzled" when you request tracing.

[Xtrace includeMethods:@"a|regular|expression"];
[Xtrace excludeMethods:@"WithObjects:$"]; // varargs methods don't work
[Xtrace excludeTypes:@"CGRect|CGSize"]; // stack frame problems on 64 bits
[Xtrace excludeTypes:nil]; // reset filter after class is set up.

Classes can also be excluded (again before other classes are traced) by calling:

[UIView notrace]; // or alternatively..
[Xtrace dontTrace:[UIView class]];

A rudimentary profiling interface is also available:

[Xtrace dumpProfile:100 dp:6]; // top 100 elapsed time to 6 decimal places

1.318244/2    [UIApplication sendAction:to:from:forEvent:]
0.725028/2    [UIWindow sendEvent:]
0.706975/2    [UIWindow _sendTouchesForEvent:]
0.701802/1    [UIControl touchesEnded:withEvent:]
0.699627/2    [UIControl _sendActionsForEvents:withEvent:]
0.659325/1    [UIControl sendAction:to:forEvent:]
0.659292/1    [UIApplication sendAction:toTarget:fromSender:forEvent:]
0.659204/1    [UIBarButtonItem _sendAction:withEvent:]
0.659082/1    [UIViewController _toggleEditing:]
0.659071/1    [UITableViewController setEditing:animated:]
0.593577/53   [CALayer layoutSublayers]
0.592025/53   [UIView layoutSublayersOfLayer:]
...

Aspect oriented features

Finally, callbacks can also be registered on a delegate to be called before or after any method is called:

[Xtrace setDelegate:delegate]; // delegate must not be traced itself
[Xtrace forClass:[UILabel class] after:@selector(setText:) callback:@selector(label:setText:)];

// void method signature for UILabel
- (void)setText:(NSString *)text;

// "before" and "after" callback implementation in delegate
- (void)label:(id)receiver setText:(NSString *)text {
    ...
}

Callbacks for specific methods can be used independently of full Class or instance tracing. "after" callbacks for methods that return a value can replace the value returned to the caller something like a variation on "aspect oriented programming".

// non-void method signature in class "AClass"
- (NSString *)appendString:(NSString *)string;

// code to inject "after" method callback
[Xtrace forClass:[AClass class] after:@selector(appendString:) callback:@selector(out:object:appendString:)];

// "after" callback implementation in delegate
- (NSString *)out:(NSString *)originalReturnValue object:(id)receiver appendString:(NSString *)string {
    ...
    return newReturnValue; // could be originalReturnValue
}

The callback selector names are arbitrary. It's the order and type of arguments that is critical. Expect some trouble passing structs on 64 bit builds. The signature for intercepting a "getter" is a little contrived:

// setup callback
[Xtrace forClass:[UILabel class] after:@selector(text) callback:@selector(out:labelText:)];

// implementation of callback
- (NSString *)out:(NSString *)text labelText:(UILabel *)label {
    ...
    return text;
}

There is also a block based api for callbacks which can be called at any time:

[Xtrace forClass:[UIView class] before:@selector(sizeToFit) callbackBlock:^( UILabel *label ) {
    NSLog( @"%@ sizeToFit before: %@", label, NSStringFromCGRect(label.frame) );
}];
[Xtrace forClass:[UIView class] after:@selector(sizeToFit) callbackBlock:^( UILabel *label ) {
    NSLog( @"%@ sizeToFit after: %@", label, NSStringFromCGRect(label.frame) );
}];

What works:

Icon

Reliability is now quite good for 32 bit builds considering.. I've had to introduce a method exclusion blacklist of a few methods causing problems. On 64 bit OS X you can expect some stack frame complications for methods with "struct" argument or return types - in particular for arguments to callbacks to the delegate. Xtrace does not currently work on the ARM64 abi - rebuild for 32 bits.

The ordering of calls to the api is: 1) Any class exclusions, 2) any method selector filter then 3) Class tracing or instance tracing and 4) any callbacks. That's about it. If you encounter problems drop me a line on xtrace (at) johnholdsworth.com. The developer of Xtrace and the "Injection Plugin" is available for Cocoa/iOS development work in the London area.

Announcements of major commits to the repo will be made on twitter @Injection4Xcode.

As ever:

THE SOFTWARE IS PROVIDED "AS IS", WITHOUT WARRANTY OF ANY KIND, EXPRESS OR IMPLIED, INCLUDING BUT NOT LIMITED TO THE WARRANTIES OF MERCHANTABILITY, FITNESS FOR A PARTICULAR PURPOSE AND NONINFRINGEMENT. IN NO EVENT SHALL THE AUTHORS OR COPYRIGHT HOLDERS BE LIABLE FOR ANY CLAIM, DAMAGES OR OTHER LIABILITY, WHETHER IN AN ACTION OF CONTRACT, TORT OR OTHERWISE, ARISING FROM, OUT OF OR IN CONNECTION WITH THE SOFTWARE OR THE USE OR OTHER DEALINGS IN THE SOFTWARE.

xtrace's People

Contributors

jeroenleenarts avatar johnno1962 avatar

Stargazers

 avatar  avatar  avatar  avatar  avatar  avatar  avatar  avatar  avatar  avatar  avatar  avatar  avatar  avatar  avatar  avatar  avatar  avatar  avatar  avatar  avatar  avatar  avatar  avatar  avatar  avatar  avatar  avatar  avatar  avatar  avatar  avatar  avatar  avatar  avatar  avatar  avatar  avatar  avatar  avatar  avatar  avatar  avatar  avatar  avatar  avatar  avatar  avatar  avatar  avatar  avatar  avatar  avatar  avatar  avatar  avatar  avatar  avatar  avatar  avatar  avatar  avatar  avatar  avatar  avatar  avatar  avatar  avatar  avatar  avatar  avatar  avatar  avatar  avatar  avatar  avatar  avatar  avatar  avatar  avatar  avatar  avatar  avatar  avatar  avatar  avatar  avatar  avatar  avatar  avatar  avatar  avatar  avatar  avatar  avatar  avatar  avatar  avatar  avatar  avatar

Watchers

 avatar  avatar  avatar  avatar  avatar  avatar  avatar  avatar  avatar  avatar  avatar  avatar  avatar  avatar  avatar  avatar  avatar  avatar  avatar  avatar  avatar  avatar  avatar  avatar  avatar  avatar  avatar  avatar  avatar  avatar  avatar  avatar  avatar  avatar  avatar  avatar  avatar  avatar  avatar  avatar  avatar  avatar  avatar  avatar  avatar  avatar  avatar

xtrace's Issues

How to profile only the required functions?

I know the dumpProfile function which lists the top 100 (depends on the count you give) functions that took most elapsed time.

Can I specify the exact functions to which the profiling has to run?

Double Pointer arguments

Hello Johno1962, Bug thanks for your help last time.

I have tried to intercept class method to get pointers to the response and error objets :
NSURLResponse * response = nil;
NSError * error = nil;
NSLog(@"before sendSynchronousRequest");
NSData * data = [NSURLConnection sendSynchronousRequest:urlRequest
returningResponse:&response
error:&error];

As you see reponse and error are passed as reference variables to the method.
I would like to get a pointer on them in the method "static void returning" so I can explore the values on these objects.
I have tried to call "formatValue" method and explore the formatting that you have done to convert arguments but I can't really convert the argument object to NSURLResponse** object or NSError** object.

Thanks a lot, sorry for bothering.

Xtracing Google Chrome / Chromium

Xtracing Google Chrome / Chromium doesn't seem to work. I'm attaching to main process using LLDB, loading Xtrace.framework, and trying to xtrace on something, and it immediately fails with an exception.

(lldb) p (BOOL)[[NSBundle bundleWithPath:@"/Library/Frameworks/Xtrace.framework"] load]
(BOOL) $0 = YES
(lldb) p (id)[[NSObject alloc] init]
(id) $1 = 0x000062000001df30
(lldb) p (void)[$1 xtrace]
error: Execution was interrupted, reason: EXC_BAD_ACCESS (code=1, address=0x2aa983abec0).
The process has been returned to the state before expression evaluation.

Tried doing the same in a custom Chromium build, and it reports this error:

[6197:1815:0225/220057:FATAL:chrome_browser_application_mac.mm(148)] Someone is trying to raise an exception!  NSInvalidArgumentException reason NSGetSizeAndAlignment(): unsupported type encoding spec 'b' at 'b1b31}}8' in '{?=ddd{?=b1b31}}8'

What's the best way to troubleshoot this?

Intercept BlockHandler

Hi,

I can't figure out how to intercept a CompletionHandler
Example For This Method :

  • (void)sendAsynchronousRequest:(NSURLRequest_) request queue:(NSOperationQueue_) queue completionHandler:(void (^)(NSURLResponse_, NSData_, NSError*))handler

I would like to intercept the CompletionHandler and get NSURLResponse, NSData and NSError values after its execution.

I have tried to do the traditional way in Xtrace but I have got Bad_Access exception

Thanks

awesome tool | made a few changes to get it to work for me

1. change

Extended array of methods best not to touch. Without that, xtrace causes an exception after a while:
'expection' being: _os_unfair_lock_recursive_abort

I added retainWeakReference, _tryRetain, autorelease, isEqual:, hash and I added back the dealloc related methods


see:

            else if ( name[0] == '.' ||
                     [nameStr isEqualToString:@"description"] || [nameStr hasPrefix:@"_description"] ||
                     [nameStr isEqualToString:@"isEqual:"] || [nameStr hasPrefix:@"hash"] ||
                     [nameStr isEqualToString:@"retainWeakReference"] || [nameStr isEqualToString:@"_tryRetain"] || [nameStr isEqualToString:@"retain"] || [nameStr isEqualToString:@"release"] || [nameStr isEqualToString:@"autorelease"] ||
                     [nameStr isEqualToString:@"_isDeallocating"] || [nameStr isEqualToString:@"dealloc"] || [nameStr hasPrefix:@"_dealloc"] )
                ; // best avoided

2. change

Made formatValue function not call isKindOfClass on proxy objects to avoid a crash when proxies implement isKindOfClass

other

  • added #pragma clang diagnostic ignored "-Wignored-attributes" so the NS_RETAINS macro on the templated c function works in all cases
  • had to remove the last pop pragma to make it compile

Adding Xtrace.mm to Xcode plugin stops plugin loading

Not really sure if this is an issue, but thought I'd bounce it off you to see if you have seen it before.

I have a working Xcode plugin but when I drag Xtrace.mm and Xtrace.h into the plugin project, for some reason, after an Xcode restart the plugin doesn't get loaded.

Note that the problem occurs even if I don't actually have any calls to Xtrace code in my plugin code. If, however, I uncheck the Target Membership for Xtrace.mm (ie. stop it being compiled) the plugin will load successfully again.

There is zero errors emitted in /var/log/system.log, so I'm a bit stumped. Just curious if you have seen anything like this before?

Arm64 support

Hello,

I tried to compile the xtrace library classes for an app with arm64 architecture but no success.
I had seen in the code this condition :

ifdef arm64

// make this into #warning to switch between the simulator and a device more easily
//#error Xtrace will not work on an ARM64 build. Rebuild for $(ARCHS_STANDARD_32_BIT).

I commented it but have faced SIGABT exceptions with arm64 devices.

Is there a solution for this issue please ?

Thanks

get self object

Hello,

Thanks for the XTrace projet, it is awesome !!!

Simply I would like to know how could I get the self object from which the method is intercepted.
Here is an example :
I would like to intercept the before of any UIViewController subclass, so I added this code :
[Xtrace forClass:[self class] before:@selector(viewWillAppear:) callback:@selector(beforeViewWillAppear:sender:)];

When I go to my interception method and I would like to display sender, It says that this object is always (null) :
+(void)beforeViewWillAppear:(BOOL)animated sender:(id)sender {
NSLog(@"%@",sender);
}

How could I pass the sender object to my interceptions methods in my delegate ?

Thanks in advance.

Feature request: add tracing of outer context (callers within call stack)

Hello, @johnno1962!

First of all thanks for Xtrace - it is really great to call -xtrace on arbitrary objects and see what's going on!

For last two days I've been investigating some bugs related either to RestKit or to CoreData. I tried to use xtrace on classes of my interest and found that xtrace has a lack of support of caller tracing.

What I mean is that for example when I call -xtrace on some object I also want to see the outer context: who calls this method, who calls caller and so on... I hope this will be easy thing to add since [NSThread callStackSymbols] can provide this information.

What would also be great is to have an option to configure stack depth of what Xtrace should trace. For example if this option is set to 1 then I see only the last caller of my object's method. If I set more I will see more callers within call stack.

I hope my request is clear. Please let me know what you think.


P.S. You realized one of the projects I dreamed about writing a such myself :) now it's great to just have such intelligent implementation that you did.

Thanks again for Xtrace!

Recommend Projects

  • React photo React

    A declarative, efficient, and flexible JavaScript library for building user interfaces.

  • Vue.js photo Vue.js

    ๐Ÿ–– Vue.js is a progressive, incrementally-adoptable JavaScript framework for building UI on the web.

  • Typescript photo Typescript

    TypeScript is a superset of JavaScript that compiles to clean JavaScript output.

  • TensorFlow photo TensorFlow

    An Open Source Machine Learning Framework for Everyone

  • Django photo Django

    The Web framework for perfectionists with deadlines.

  • D3 photo D3

    Bring data to life with SVG, Canvas and HTML. ๐Ÿ“Š๐Ÿ“ˆ๐ŸŽ‰

Recommend Topics

  • javascript

    JavaScript (JS) is a lightweight interpreted programming language with first-class functions.

  • web

    Some thing interesting about web. New door for the world.

  • server

    A server is a program made to process requests and deliver data to clients.

  • Machine learning

    Machine learning is a way of modeling and interpreting data that allows a piece of software to respond intelligently.

  • Game

    Some thing interesting about game, make everyone happy.

Recommend Org

  • Facebook photo Facebook

    We are working to build community through open source technology. NB: members must have two-factor auth.

  • Microsoft photo Microsoft

    Open source projects and samples from Microsoft.

  • Google photo Google

    Google โค๏ธ Open Source for everyone.

  • D3 photo D3

    Data-Driven Documents codes.