- Use the Node.js debugger
While console.log() is a valuable debugging tool, it only gets us so far. When
we start running JavaScript code in the browser, we will have access to the
browser's debugger. The debugger allows you to set breakpoints in your code
that will stop the execution of the code at that point. You can then inspect the
values of your variables at that point in your code.
We will start running JavaScript in the browser a bit later in the course. In the meantime, Node.js (which is the runtime environment that enables us to run our JavaScript outside the browser) includes a similar debugging tool. In this lesson, we will walk through how to use the Node.js debugger.
Fork and clone this lesson into your local environment. To do this, click
the GitHub "octocat" button at the top of the page to open the lesson's
GitHub repo, then click "Fork." Once you've cloned it down to your machine,
navigate into the lesson's directory in the terminal, then run code . to
open the files in Visual Studio Code.
Open index.js and take a look. You will see we have created a simple while
loop that console.log()s a message. Run node index.js to see it in action.
Using the debugger is a simple matter of adding the debugger keyword at the
point in our code where we want to place a breakpoint (i.e., where we want to
pause execution). Modify the code in index.js as follows:
let count = 1;
while (count < 5) {
  debugger;
  if (count === 1) {
    console.log(`This loop has executed ${count} time.`);
  } else {
    console.log(`This loop has executed ${count} times.`);
  }
  count += 1;
}
To start the debugger, run node inspect index.js. You should see this in your
terminal:

Next, enter cont at the debug prompt to start executing the code. You will
see a > pointing to line 3, indicating that the execution of the code has been
stopped at that point:

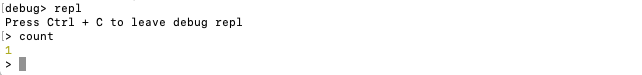
Now say we want to check the value of our count variable. To do that, we need
to enter the debugger's REPL by running repl. You will now have a > prompt
in place of the debug> prompt. Type in count to see the current value of the
variable:
Then to continue executing the code, we first need to exit the REPL by typing
Ctrl-c, then run cont at the debug prompt:

Note that our logged message shows at the top of the screenshot above. When we
ran cont, the execution of the code resumed so the console.log() was run,
the count variable was incremented, and the execution continued to the next
loop. If you enter the REPL and check the value of count, you will see that
it's now equal to 2.
But what if we wanted to check the value of count both before and after the
incrementation? We can simply add a second breakpoint:
let count = 1;
while (count < 5) {
  debugger;
  if (count === 1) {
    console.log(`This loop has executed ${count} time.`);
  } else {
    console.log(`This loop has executed ${count} times.`);
  }
  count += 1;
  debugger;
}
In order for the debugger to recognize the change to our code, we'll need to
exit and restart it. If you're in the REPL, type ctrl-c to exit that, then
type .exit at the debug prompt or ctrl-c twice to exit the debugger.
Finally, run node inspect index.js to relaunch the debugger.
Now if you run cont, the code will begin executing and will pause at the
first breakpoint. To continue executing the code and advance to the second
breakpoint, simply enter cont again. At any point, you can enter the
debugger's REPL to check the value of count, then exit the REPL and continue
execution of the code.
In this lesson we've learned about using the debugger built in to Node.js. To review, the process is as follows:
- Place one or more breakpoints in your code using the
debuggerkeyword - Run
node inspect <filename>in the terminal to launch the debugger - Run
contat thedebugprompt to start execution of the code and advance to the first breakpoint - Run
replat thedebugprompt to enter the debugger's REPL - Check the value of any variables by entering the variable name at the
>prompt - Exit the REPL using
ctrl-c - Continue stepping through the code using
cont - Run
.exitor typectrl-ctwice to exit the debugger
Debugging tools will get more and more useful to you as you progress through the curriculum and your programs get more complex. The time you spend now getting comfortable with debugging will pay off in the long run.
We will get more practice using the debugger in an upcoming lesson.


