![]()


Lux is a Python library that makes data science easier by automating aspects of the data exploration process. Lux is designed to facilitate faster experimentation with data, even when the user does not have a clear idea of what they are looking for. Visualizations are diplayed via an interactive Jupyter widget to allow users to quickly browse through large collections of data directly within their Jupyter notebooks.
Here are some slides from a recent talk on Lux.
Try out Lux on your own in a live Jupyter Notebook here!
To start using Lux, simply add an additional import statement alongside your Pandas import.
import lux
import pandas as pd
Then, Lux can be used as-is, without modifying any of your existing Pandas code. Here, we use Pandas's read_csv command to load in a dataset of colleges and their properties.
    df = pd.read_csv("college.csv")
    df
Voila! Here's a set of visualizations that you can now use to explore your dataset further!
In addition to dataframe visualizations at every step in the exploration, you can specify in Lux the attributes and values you're interested in. Based on this intent, Lux guides users towards potential next-steps in their exploration.
For example, we might be interested in the attributes AverageCost and SATAverage.
    df.intent = ["AverageCost","SATAverage"]
    df
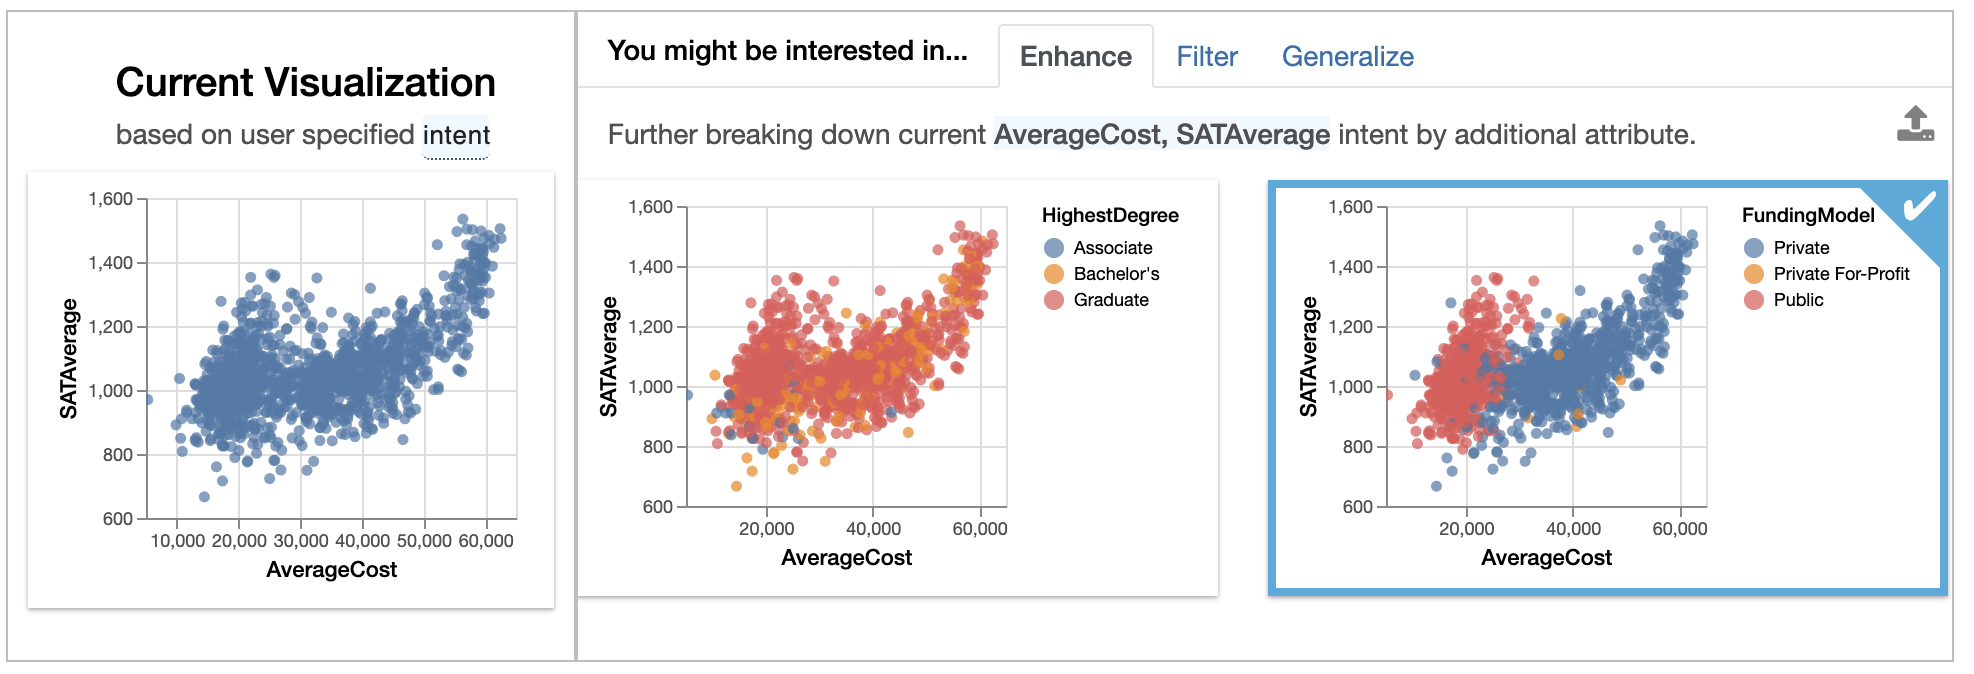
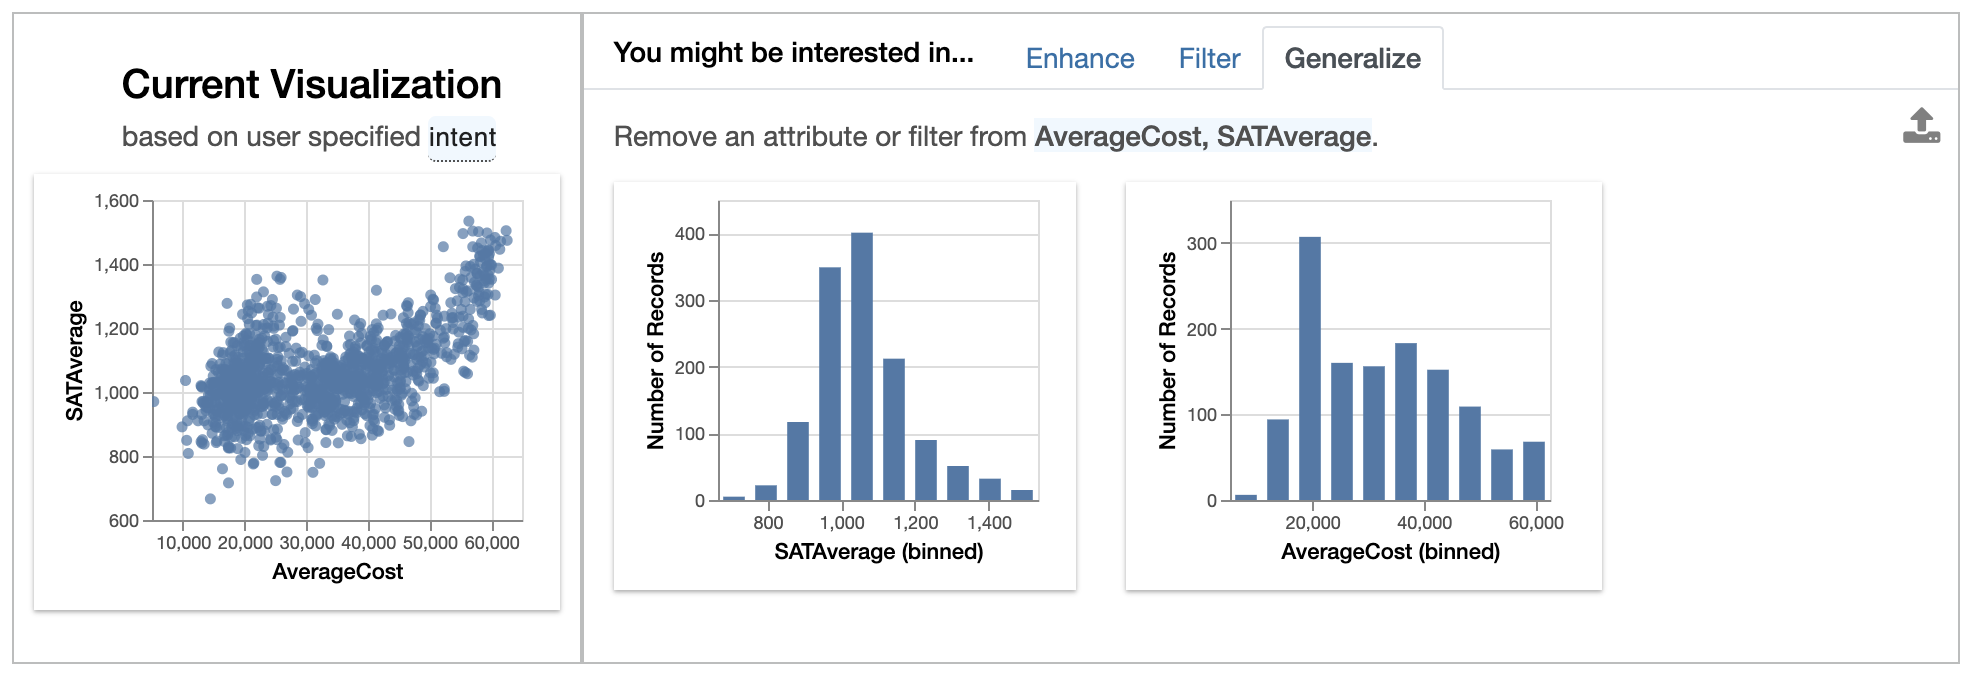
The left-hand side of the widget shows the current visualization, i.e. the current visualization generated based on what the user is interested in. On the right, Lux generates three sets of recommendations, organized as separate tabs on the widget:
Enhanceadds an additional attribute to the current selection, essentially highlighting how additional variables affect the relationship ofAverageCostandSATAverage. We see that if we breakdown the relationship byFundingModel, there is a clear separation between public colleges (shown in red) and private colleges (in blue), with public colleges being cheaper to attend and with SAT average of lower than 1400.
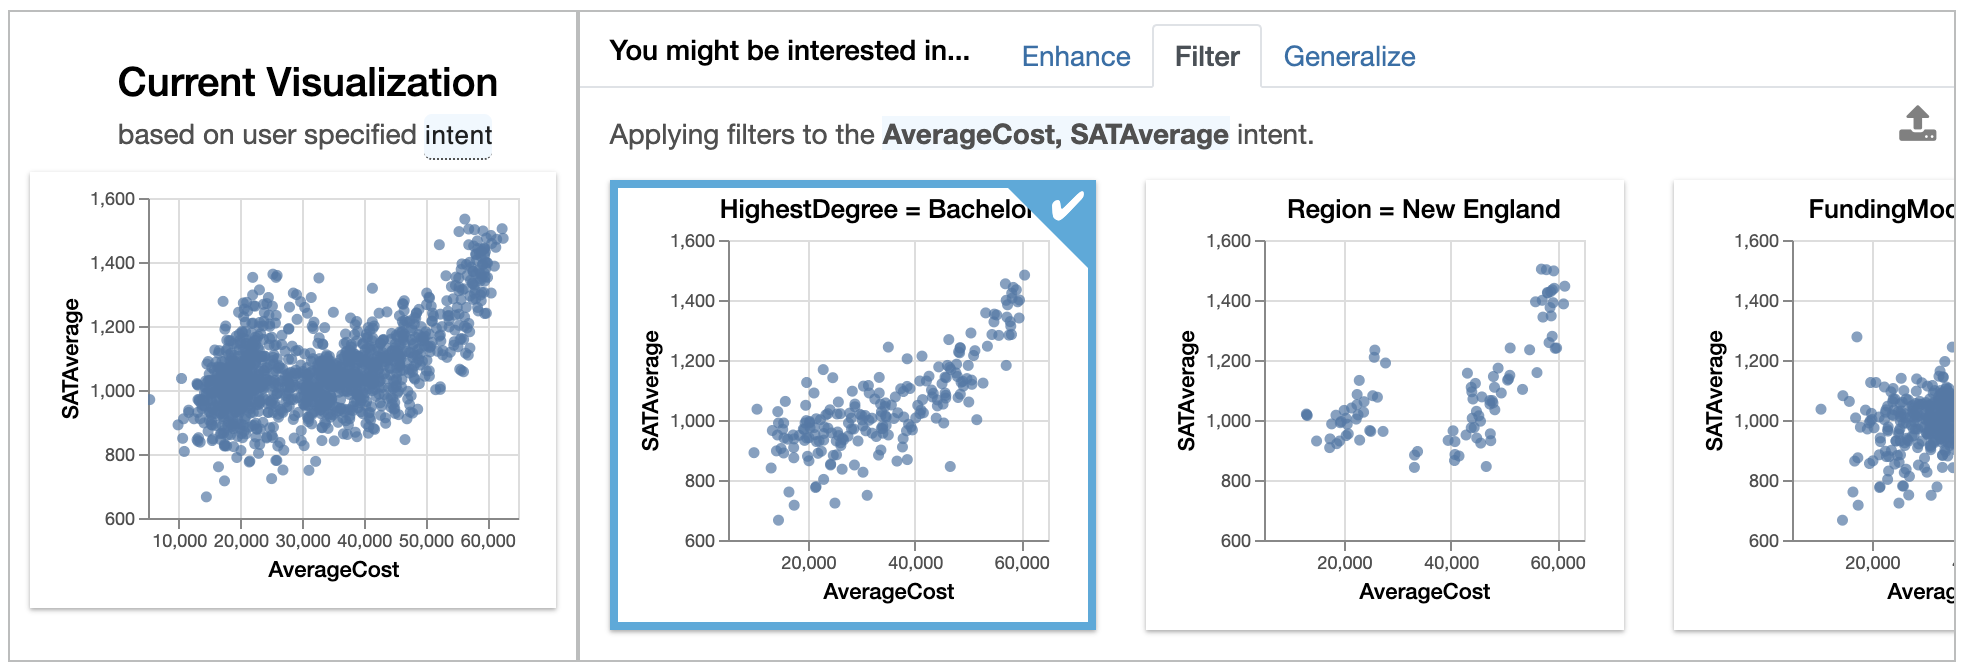
Filteradds a filter to the current selection, while keeping attributes (on the X and Y axes) fixed. These visualizations shows how the relationship ofAverageCostandSATAveragechanges for different subsets of data. For instance, we see that colleges that offer Bachelor's degree as its highest degree offered shows a roughly linear trend between the two variables.
Generalizeremoves an attribute to display a more general trend, showing the distributions ofAverageCostandSATAverageon its own. From theAverageCosthistogram, we see that there are many colleges with average cost of around $20000 per year, corresponding to the bulge we see in the scatterplot view.
See this page more information on additional ways for specifying the intent.
Now that we have found some interesting visualizations through Lux, we might be interested in digging into these visualizations a bit more. We can click on one or more visualizations to be exported, so we can programmatically access these visualizations further in Jupyter. Visualizations are represented as Vis objects in Lux. These Vis objects can be translated into Altair or VegaLite code, so that we can further edit these visualizations.
We've seen how Viss are automatically generated as part of the recommendations, users can also create their own Vis via the same syntax as specifying the intent. Lux is built on the philosophy that users should always be able to visualize anything they want, without having to think about how the visualization should look like. Lux automatically determines the mark and channel mappings based on a set of best practices from Tableau. The visualizations are rendered via Altair into Vega-Lite specifications.
    from lux.vis.Vis import Vis
    newEnglandCost = Vis(["Region=New England","MedianEarnings"],df)
    newEnglandCost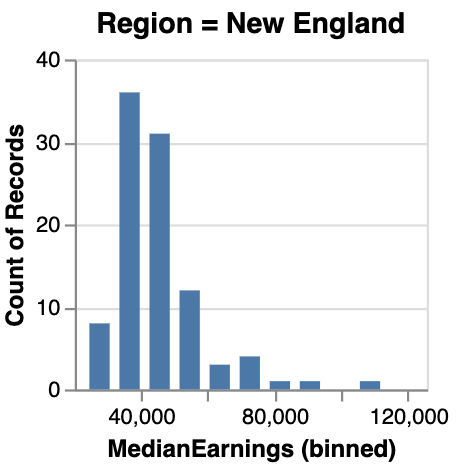
Lux provides a powerful abstraction for working with collections of visualizations based on a partially specified queries. Users can provide a list or a wildcard to iterate over combinations of filter or attribute values and quickly browse through large numbers of visualizations. The partial specification is inspired by existing work on intent languages for visualization languages, including ZQL and CompassQL.
For example, we might be interested in looking at how the AverageCost distribution differs across different Regions.
    from lux.vis.VisList import VisList
    differentRegions = VisList(["Region=?","AverageCost"],df)
    differentRegions
To find out more about other features in Lux, see the complete documentation on ReadTheDocs.
To setup Lux manually for development purposes, you should clone the two Github repos for Lux: 1) the core Python Lux API and 2) the Jupyter widget frontend.
To install the Python Lux API:
    git clone https://github.com/lux-org/lux.git
    cd lux/
    python setup.py install
To install the Lux Jupyter Widget:
    pip install git+https://github.com/lux-org/lux-widget
    jupyter nbextension install --py luxWidget
jupyter nbextension enable --py luxWidgetLux is undergoing active development. Please report any bugs, issues, or requests through Github Issues or post on the #help channel in the Lux Slack org.
If you are interested in participating in a user study on Lux, please contact Doris Lee for more detail.


