This project is for monitoring SunPower solar using PRTG with Perl. Notes in reverse chronology are below
2018/08/12 Here is something that has been bugging me throughout this project so far. The design is that the perl script does an http get against the supervisor IP and pulls the JSON from cgi-bin/dl_cgi?Command=DeviceList. This means that for every PRTG sensor, the sciprt runs and pulls from the supervisor URL once. As thnigs stand there are 32 sensors I have been using for testing. When I add all 24 panels, this will increase to 59 sensors. This will result in the supervisor URL being hit 59 times per minute. The response time of the URL is typically between one and three seconds. See the problem here? So what is in the back of my mind is that I need a seperate process that will grab the contents of the URL twice a minute only and store the result in a file. The script would then target the file. I say twice a minute becasue if it were every 60 seconds like the sensors, then there is the posibility two consecutive polling cycles for a panel might retrieve the same data from the file (i.e. not updated). So in a nutshel, the result of creating a seperate process to pull the JSON data from the superivosr would be as follows:
eliminate the one to three second run-time for the script
eleviate the concern I have hitting the supervisor URL in a very wasteful fashion (59 times per minute)
provide a far more scalable script
Because PRTG supports 50 channels per sensor, this means that the script would then be able to support up to 50 panels in inverter mode (i.e. one channel per panel) and an unlimited amount of panels in serial number mode.
Drum roll please...I have implemented this optimization today and it was super simple do.
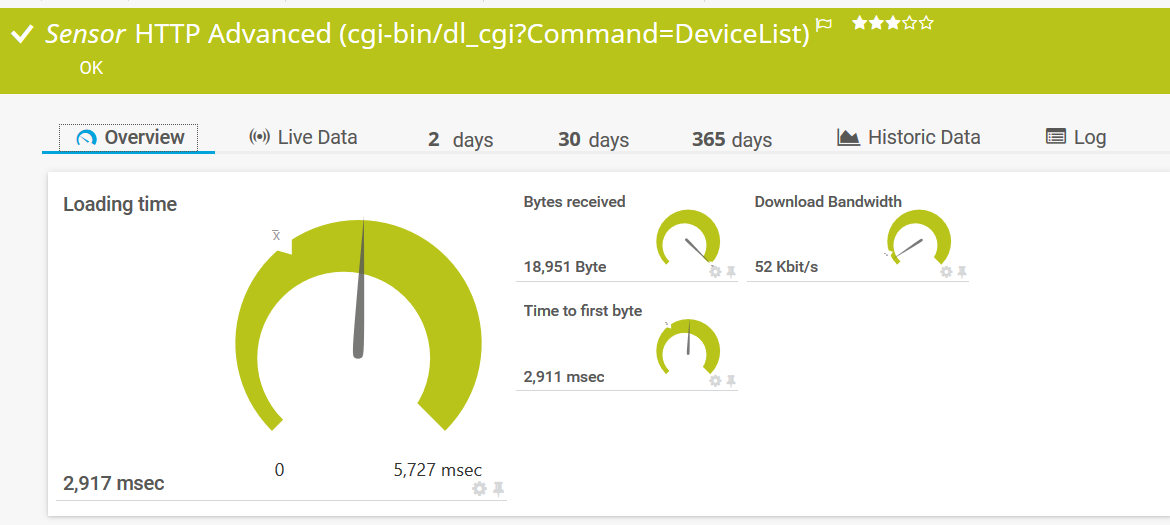
Behold the PRTG 'HTTP Advanced' sensor. You give it a URL and it dumps the contents into a file every 30 seconds. The new sensor is then configured as the master to the parent, which means that if the URL stops responding, then all the sensors under the device will auto pause. The perl script has been updated to read the contents of this file. BAM!!! The only thing I am not sure about is if there will be any collisions, i.e. perl script is running while the file is being written to. I'm just crossing my fingers that file locks will prevail and it will sort itself out. If this turns into an issue, then I would need to shift tactics and do something that leverages a lock file to verify it isn't being written to. Here's the HTTP Advanced sensor.
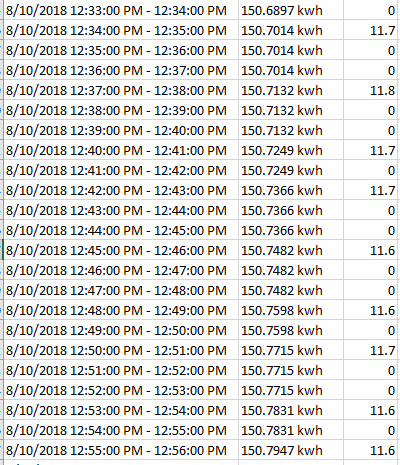
2018/08/11 Ok. After the change to convert from kWh to Wh PRTG is shoing data, but it's a graph that looks terrible. Looking at the raw data (screenshot below) it is clear that the panel does not increment kWh in real-time. We can see that the vlaue of kWh is static for two to three minutes. If we take a reading every 60 seconds, the reading is not changing. PRTG by default will then take this value and divide by the number of elapsed seconds since the last polling interval, in this case 60. I have adjusted the polling interval on one of the PRTG panel sensors to five minutes. This will have a number of effects on the monitoring: 1) the new field should show non-zero data and result in a smooth graph; 2) live data (raw) and 2-day will be the same, i.e. 2-day uses 5 minute averaging. 3) loss of resolution on all other existing fields. Not sure if I like that.
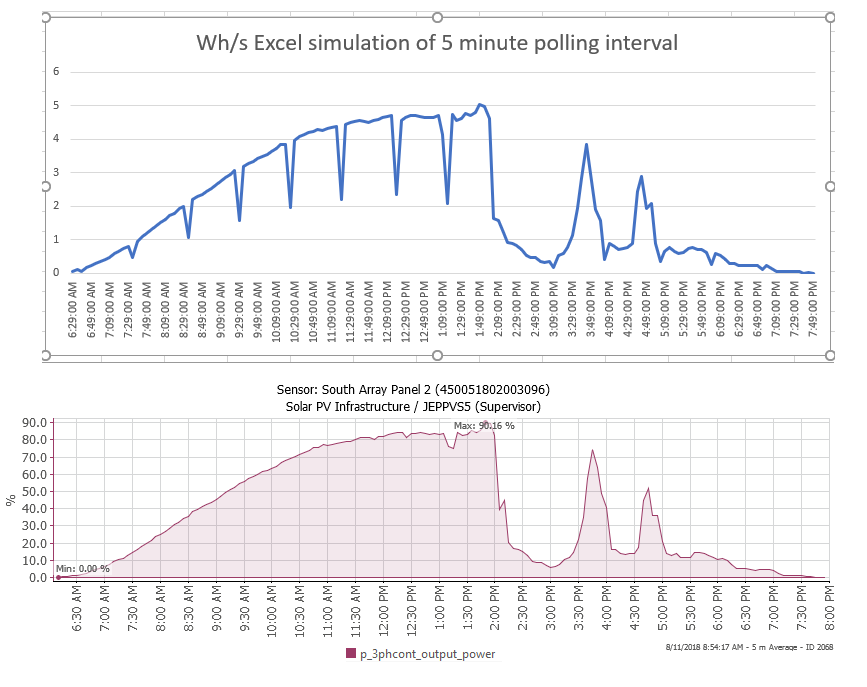
To get a preview of what this should result in I took the raw data and summed five records (60 second polling intervals each), then divided by 5 (the data has already been diveded by 60 in PRTG). The result is the 5 minute average Wh/s. I charted this and compared to kW power (%) shown below. Note that it tracks identically to kW power (%). The thing to keep in mind is that when we poll and read kW, that is the reading at the moment in time that we poll. Whereas kWh is a counter of actual power produced. Therefore Wh/s will show us the rate that power is produced for the entire period of time. So it's the true measure of power production. You can also see that hourly there is a dip (let's call this a slip). This is likely beacsue the kWh field increments one fewer time for that specific polling interval than in the prior interval and the following interval. One way to think about this is imagine a clock and you ask someone to count how many times the seconds hand passes the number 12 every 150 seconds (two and a half minutes). And let's say they start counting when the seconds was at the number 3. The seconds hand passes the number 12 a total of two times for the first cycle. At the end of the first cycle the seconds hand is now at the number 9. For the next cycle the seconds hand passes the number 12 a total of three times. Now the seconds hand is at the number 3 again and we already know that we'll count two times for this cycle and so on. So what if the cycle wasn't 150 seconds but it was 61 seconds or how about 59 seconds. You can now see that for every cycle start position, we would slowly make our way around the clock face. We basically have a mismatch of resolution. If you draw a clock face and then starting at the number 3, spiral around 150 seconds, you'll see this concept visually. Imagine that the seconds hand passing the number 12 is when the kWh field increments. If the kWh field was real-time we wouldn't have this factor to consider in the polling interval. What I may end up doing with this field is remove it from the panel sensor and create a sensor that tracks Wh/s only (for all panels) with a polling interval of 60 minutes. We will then have 29-31 occurences of kWh incrementing in a single polling interval, so our resolution mismatch will be far less noticable. This way we will see the power produced for all panels with one hour resolution. Potentially a more intuitive view then the kWh counter and the daily S shape where the slope is the rate of power production.
Oh and no code has been posted yet. :D
2018/08/09 5 minutes after I posted the last update: Re the new Wh/s field, I see something in PRTG, maybe it is working now!! But I need the sun to shine bright to be sure. Oh well, I suppose I will have to wait another 18-24 hours to be sure. Maybe I won't need to post that egg on face picture after all. Fingers crossed X.
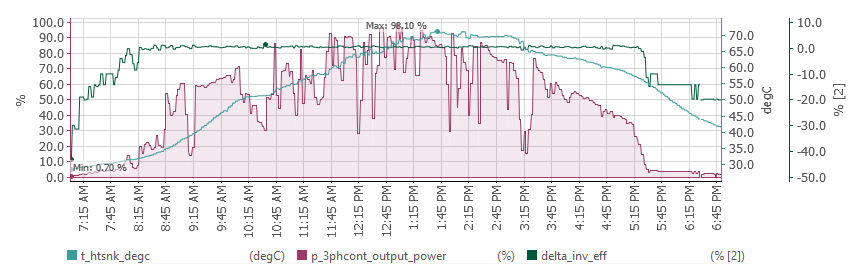
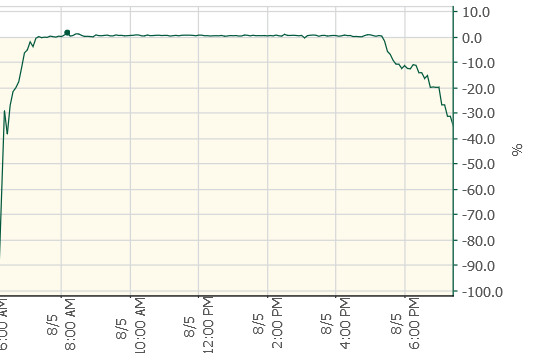
2018/08/09 Here is a screen shot of a report from PRTG that shows three fields only. We can see that the inverter is running at spec (0% diff from spec) as long as the power output of the panel is above 15%. We can also see in the morning and day, that when the sun is shining the temperature of the panel increases and there are spikes in power production. If thereare clouds, we see an instand drop in power, and temperatutre stops increasing. We can see the panel reaches 98.1% of its maximum rated power at around 1:45 PM. and then as the day goes by the temperature of the panel starts to decrease along with the power, but this is due to the angle of the panel as well as the distance from the sun. We know the sun is shining because the power level doesn't fall off a cliff. Around 5:30 PM, the power does fall off a cliff, maybe some more clouds and then panels at the wrong angle and too far away from the sun. Re. an update on the new kWh/s field I bragged about on my last update, I won't post a picture of me with egg on my face, but I can say the new field is a failure and does not appear to be working. I did a tweak to multiply the kWh by 1000 to convert to Wh. The rate of change of kWh is so small that I am want to rule out that it is a PRTG issue. I doubt it will make a difference though. I would still like to see if I can get this working as the cummulative counter of kWh needs to be suplemented with the delta or difference in this value from one minute to the next. Oh and no code has been posted yet. :D
2018/08/06 Couple nice little tweaks this evening. I added a field called ltea_3phsum_kwh_diff, which is the same as ltea_3phsum_kwh except within PRTG it will be rendered as the difference between current ltea_3phsum_kwh and last ltea_3phsum_kwh divided by the number of elapsed seconds between the polling intervals. The result is kwh/s i.e. the speed of ltea_3phsum_kwh production. This is better than p_3phsum_kw as that's just a snapshot in time of the kW at the moment the script ran. I don't have any screenshots to share on this yet as the sun has decided to hide itself behind our planet for the next few hours. Implementing that was the simplest thing done so far. I literllay just duplicated the secion of XML for ltea_3phsum_kwh, changed the channel (field) name and added the following line:
print "<Mode>Difference</Mode>\n";
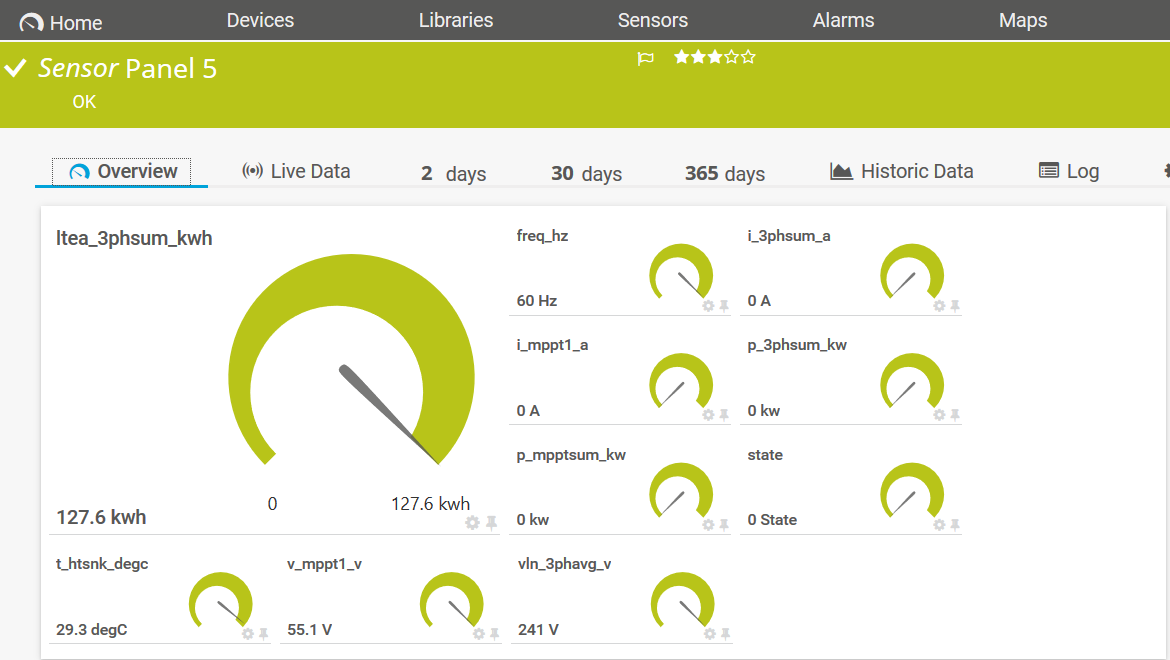
Talk about a major coding work-out for my fingers! Next up, remember how I said that I didn't like that I was storing zeros when there was no data? Zero should mean zero, not null. So now when a panel is off (i.e. state=error), all the other fields will no longer show zero and no data will be output. Rocket science right? Yawn. Screenshot below to show this in action. I have a list of planned features still but I'm more of a under commit, over deliver type. Plus there is always the chance I'll change my mind. That plus other tweaks that seem to make sense. Oh and no code has been posted yet. :D
2018/08/05 Ohhh, I have some knew stuff that I have been working on and ready to share an udate. :)
I have created five new fields which are calculations from realtime values combined with values that are derived from the manufacturer spec sheet. The new fields are:
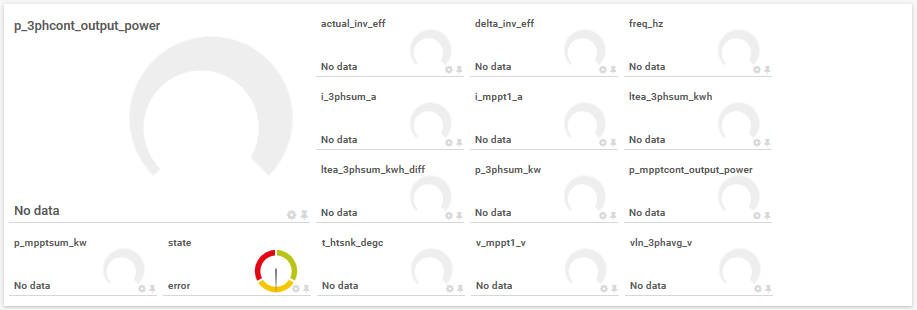
p_mpptcont_output_power (%)

p_3phcont_output_power (%)

actual_inv_eff (%)

rated_inv_eff (%) (not output directly by the script)

delta_inv_eff (%)
To understand what these mean, consider the following details.
Stated specification:
•	Pnom 335 W

•	AC Max. Cont. Output Power 320 W
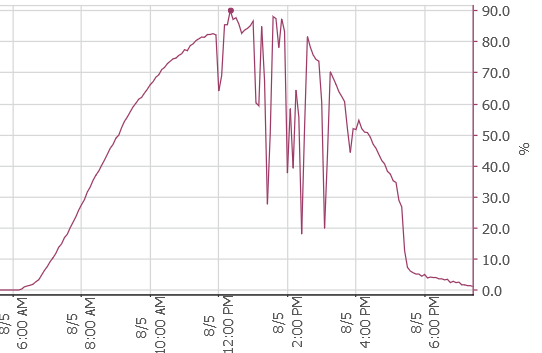
We can compare p_mpptsum_kw against ‘Pnom’ and p_3phsum_kw against ‘AC Mac. Cont. Output Power’. The resulting calculation is p_mpptcont_output_power (%) and p_3phcont_output_power (%). These two fields provide a more intuitive evaluation of power production vs. maximum possible. On a sunny day we want to see these as close to 100% as possible. If lower than 100%, then this might be an indication of an environmental factor, e.g. dirt on panel, sub-optimal angle, shade, not sunny enough. But it could also tell us that there is a problem with the panel, especially if panels that sit side-by-side greatly differ.
Screen shot of p_mpptcont_output_power from today.
The next area we can draw a conclusion is DC/AC CEC Conversion Efficiency. i.e. power in vs power out for the inverter.
Stated specification:
• DC/AC CEC Conversion Efficiency 96%
This is a simple calculation.
Pnom ÷ AC Max. Cont. Output Power = DC/AC CEC Conversion Efficiency
Therefore, we can compare p_3phsum_kw to p_mpptsum_kw and calcualte the actual_inv_eff (%)
Screen shot of actual_inv_eff from today.
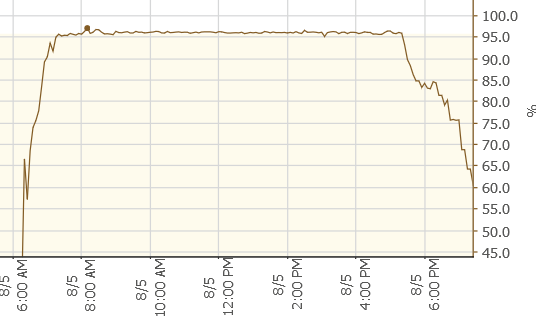
Before you look at this and assume that 96% would be the target value for actual_inv_eff (%), how about we use a more accurate ‘DC/AC CEC Conversion Efficiency’ value. We’ll call this rated_inv_eff (%).
335.00 ÷ 320.00 = 0.955224 (𝑜𝑟 95.5224%)
Technically the spec sheet isn’t wrong, they have chosen to display an integer and rounded up: 96%. But the rating is less than 96%, so increasing accuracy on this can help us improve decisions we might make when analyzing the inverter efficiency. Therefore we want actual_inv_eff (%) to be 95.5224% or greater.
So for our fith field delta_inv_eff (%) we will analyze the inverter efficiency in a more intuitive fashion by comparing actual_inv_eff (%) to rated_inv_eff (%). This tells us how close (delta) to our super accurate version of ‘DC/AC CEC Conversion Efficiency’ the inverter is performing. A positive value means the performance has exceeded (hurray!) the spec. A negative value means that the inverter is not performing to the stated spec (boooo!). Observing these calculations for just one day I have already been able to conclude that when the power is less than 10-15%, the inverter under performs. At dawn and dusk or on a cloudy day if power is less than 10-15%, there is more power loss at the inverter. i.e. actual_inv_eff (%) < 95.5224%. The efficiency is as low as 65%. Who would have known? At that power level though, who cares what the efficiency is.
Screen shot of delta_inv_eff from today.
So with all this new derived data, we can use the additional five new fields and make some decisions:
Scenario 1:
If it’s a beautiful sunny day

And p_mpptcont_output_power (%) and p_3phcont_output_power (%) < 100%

Then the panel may be in the shade, dirty, sub-optimal angle or you need to move nearer he equator.

If the values differ to the neighboring panel then you might have a problem ☹
Scenario 2:
If it’s a beautiful sunny day

And p_mpptcont_output_power (%) = X (e.g.90%)

And delta_inv_eff (%) < 0% i.e. p_mpptcont_output_power (%) < X e.g. 80%

Then the inverter likely has a problem ☹
So that's it for the changes. May you warrenty claims be plentiful!
Beyond these five new fields, let’s have some geeky fun and discuss the specs a little further. Imagine we are comparing spec sheets from different manufacturers that have the same Pnom and ‘AC Max. Cont. Output Power’ but the 'DC/AC CEC Conversion Efficiency' differs. Here are two stated specification examples:
Manufacturer 1:
•	Pnom 335 W

•	AC Max. Cont. Output Power 320 W

•	DC/AC CEC Conversion Efficiency 96%
Manufacturer 2:
•	Pnom 335 W

•	AC Max. Cont. Output Power 320 W

•	DC/AC CEC Conversion Efficiency 95%
Manufacturer 1 is not better than manufacturer 2. They are in fact the identical spec! Here’s why.
Let’s assume each manufacturer’s spec could mean this:
•	Pnom is between 334.5W and 335.49W

•	AC Max. Cont. Output Power is between 319.5W and 320.49W
We can calculate all possible combinations of efficiency in an Excel table and see that maximum efficiency is somewhere in the region of 95.2338% to 95.8117%. Here are two of the corners of that table:
335.49 ÷319.50 =0.952338 (𝑜𝑟 95.2338%)

334.5.0 ÷320.49 =0.958117 (𝑜𝑟 95.8117%)
Manufacturer 1 and 2 can pick a value anywhere in this table and be telling the truth. Or they can simply choose to round up or round down, which is technically the truth also. Some manufacturers may even use this to their advantage and increase the DC/AC CEC Conversion Efficiency’ (marketing B.S.). Make sense?
Oh and no code has been posted yet. :D
2018/08/01 The portion of the code that reports a specified field for all inverters, where the channel name is the inverter serial number, is now complete. This will be very interesting as provides a view of all inverters together and will show any differences in performance, be it due to environmental factors like angle, time of day shadows, snow or simply due to internal components. Note that the screenshots were created after the sun went down so the data is boring with a capital B. In the morning it will come to life and as was the case with the first proof of concept screenshots, I would like to follow-up with more when there is a couple of days’ worth of data and perhaps will provide a two day historical view. The other thing that will likely be interesting is to see which inverter powers up first or powers off last each day. My guess is that there will be a winner in each category. If this data can be used as the basis of a warranty claim, then I'll claim credit now as I predict it will happen at some point. :) No code has been posted yet.
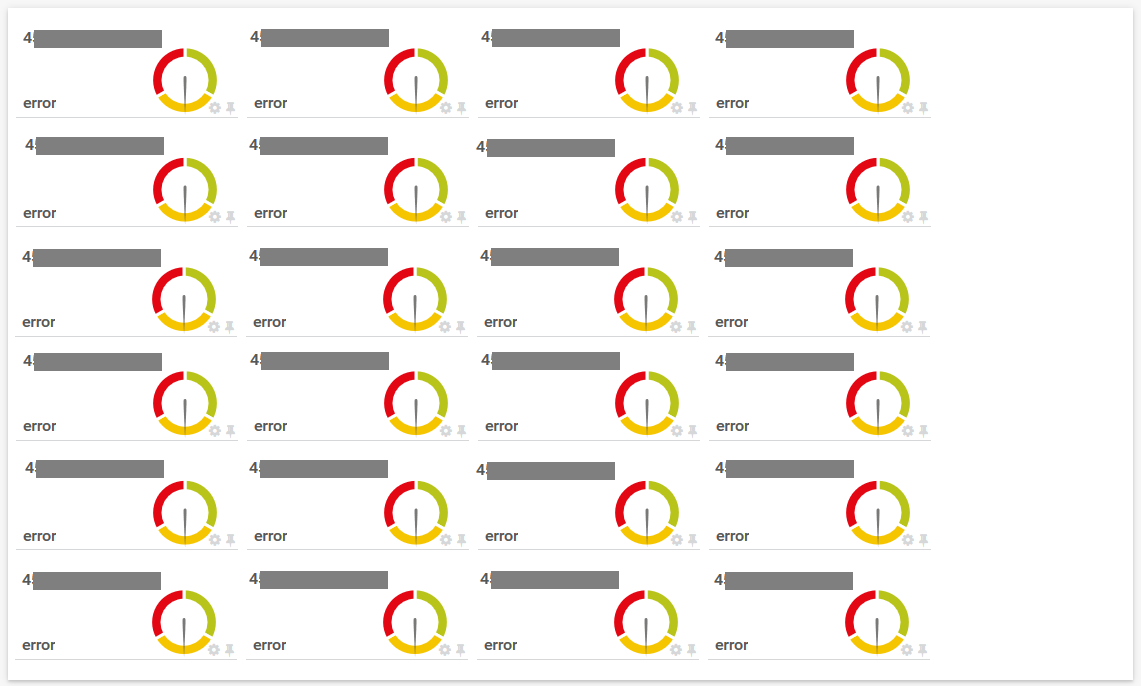
Command line parameters: inverters state
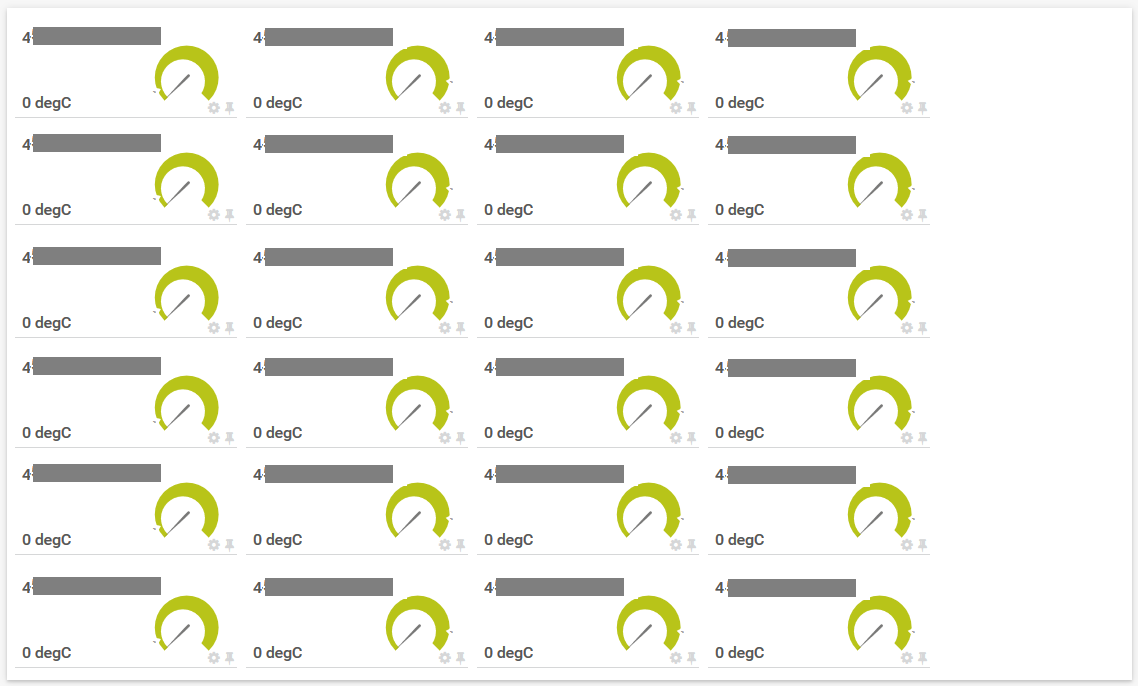
Command line parameters: inverters t_htsnk_degc
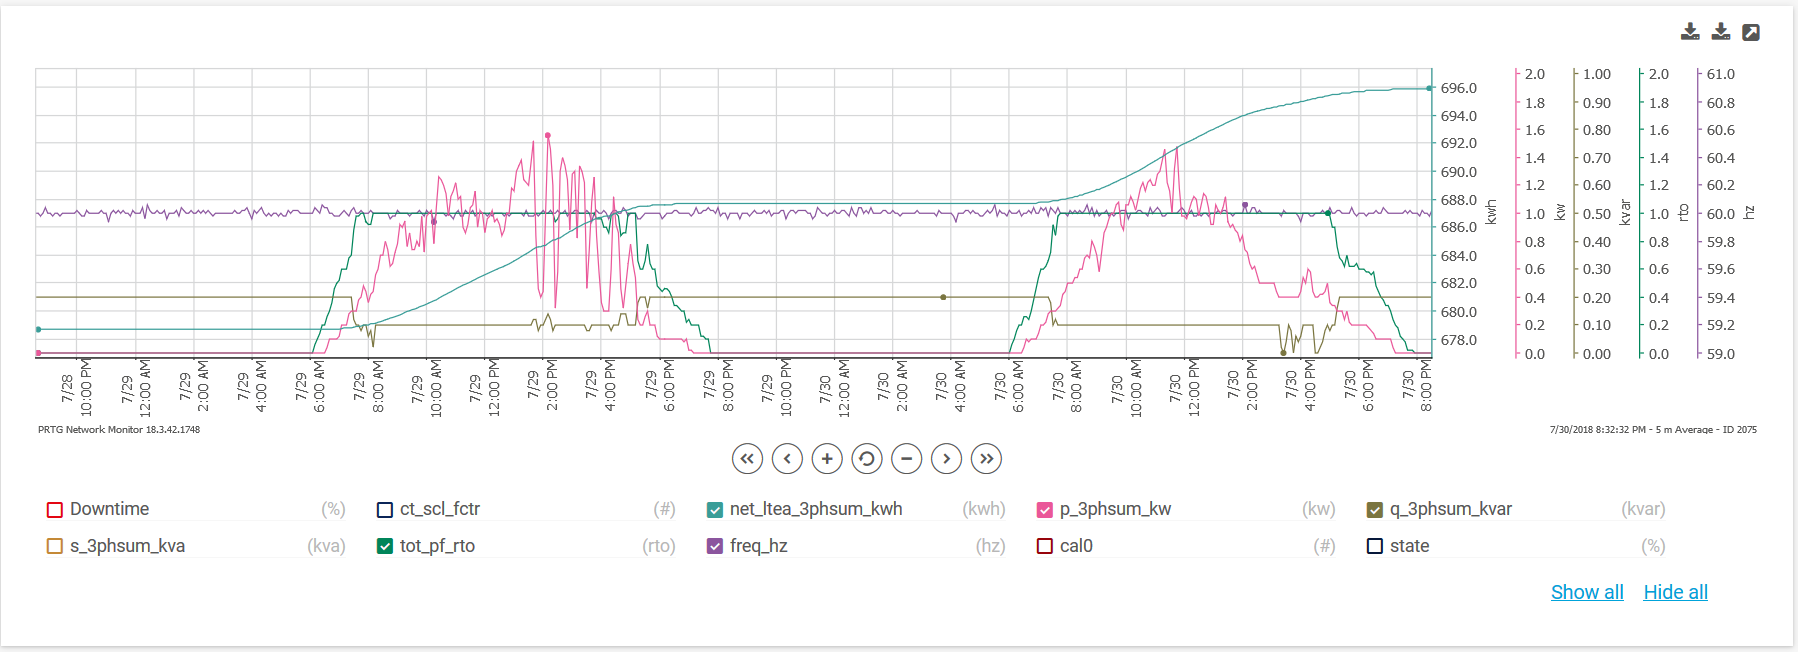
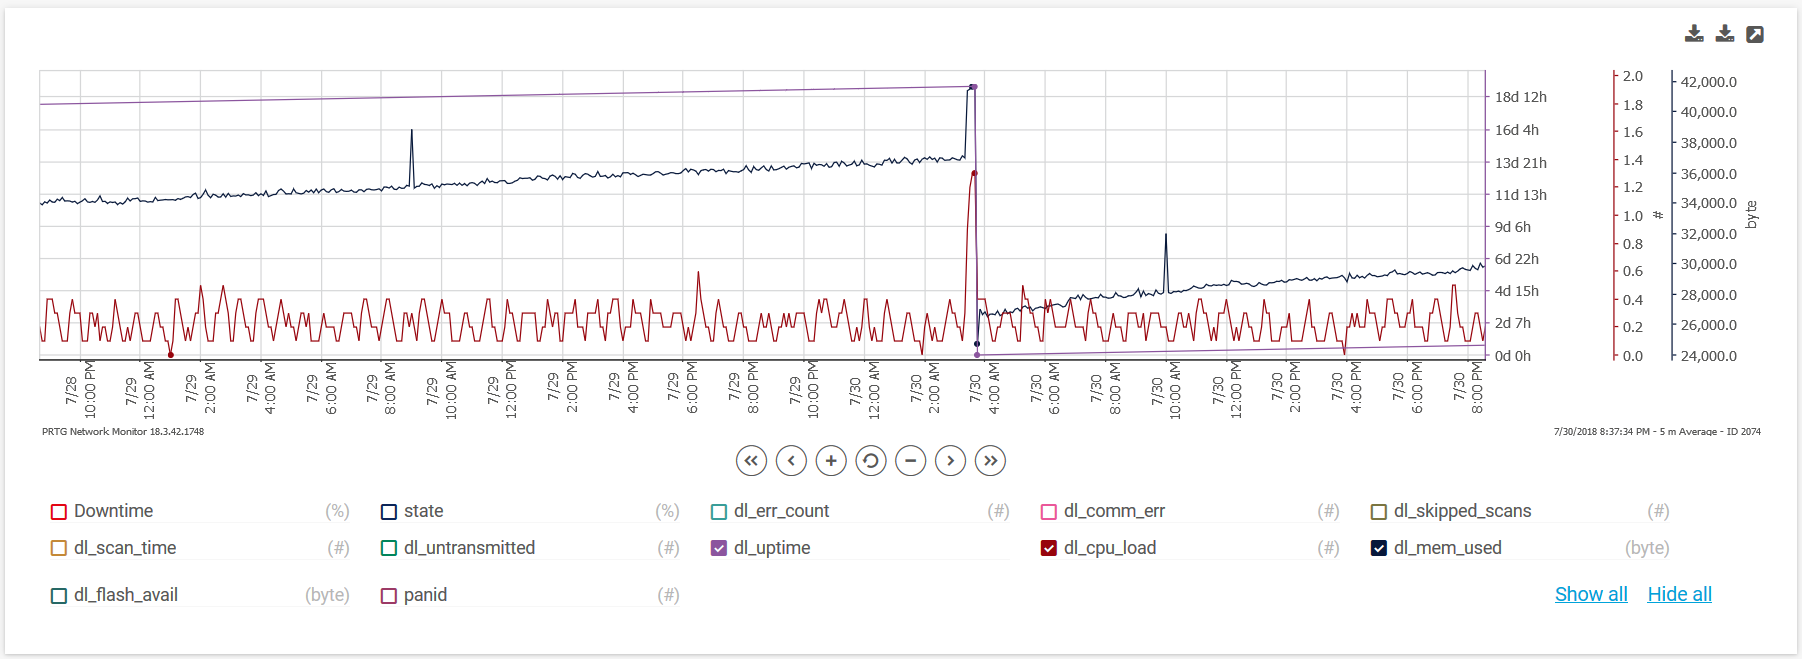
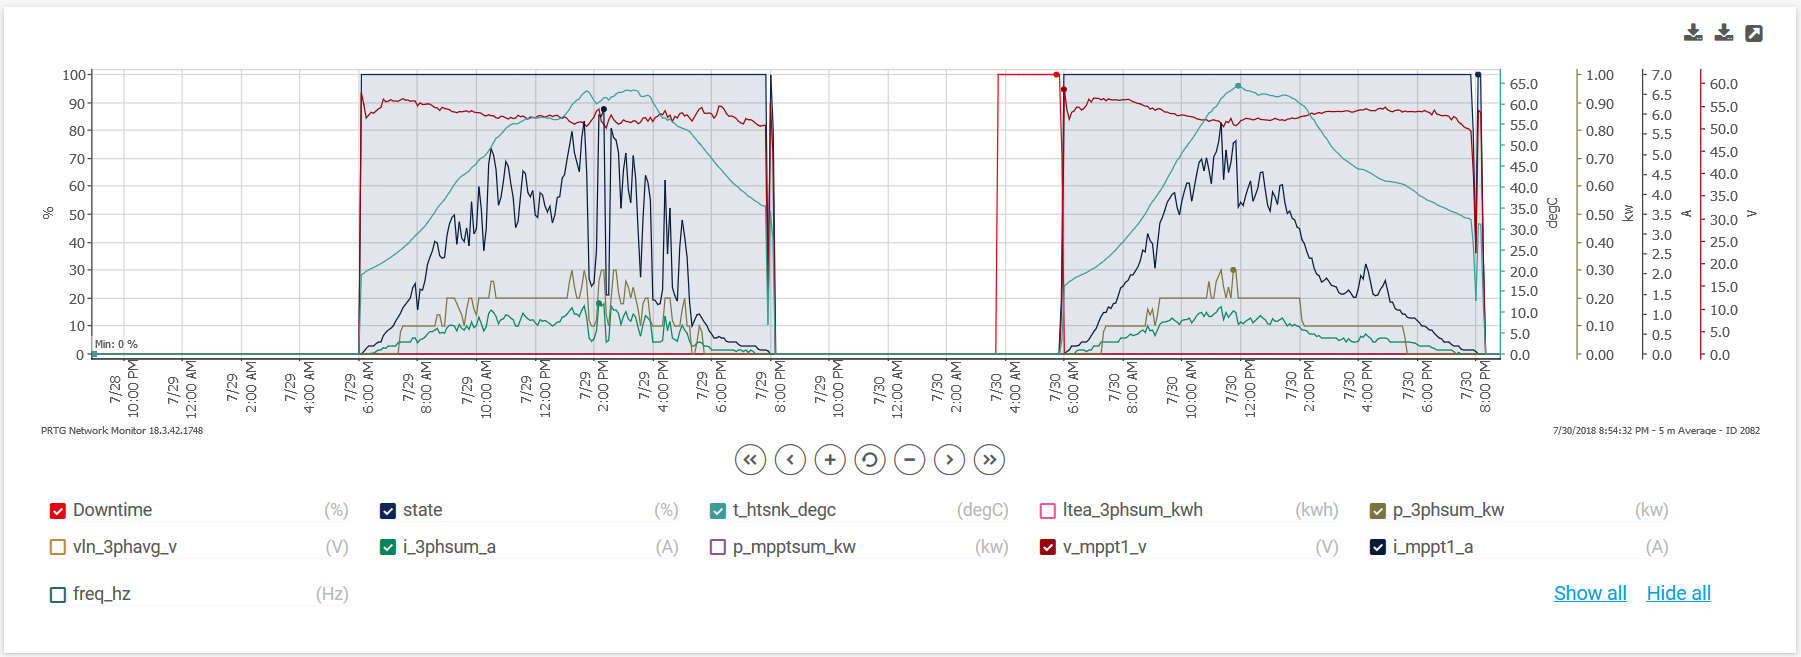
2018/07/30 I did some work yesterday morning, adding a new section of code that will output the field you specify for all inverters. The name of the channel is the serial number. It's an effective piece of logic that has a simple method to determine how many inverters there are in the system. This code section provides a way to compare the inverters to see any differences in performance, be it due to environmentals, or due to the performance of the internal components. Where I left off was incorporating sub-routines but seeing I have never really written perl before (well, I started a week or two ago now) there are some principles I have not researched yet. I may end up having a couple duplicate code sections for now, just to keep the work on functionality moving. I have also thought about another hybrid sensor that sums values from the inverters as a way to compare it to the Power Meter. In the meantime, now that there have been a couple of days of data-gathering, here are some screenshots. Interestingly there was a supervisor reboot this morning (uptime reset to zero) and it looks like it may forget about what inverters there are until they power up (sunlight). No code has been posted yet.
Power Meter on the generation side, 2 day view (5 minute averages)
Supervisor, 2 day view (5 minute averages)
Inverter (Panel), 2 day view (5 minute averages)
2018/07/28 Some optimizations are now in place:
-
At night, Inverters go into an error state and the reported values remain frozen until state returns to working, e.g. degC reads 30 from dusk to dawn which is simply incorrect. The script will now change these values to zero. Zero may not be the correct value as at times zero may be a valid value (e.g. in the winter). I'd prefer to store nulls, but that's for another day. I don't have a screenshot of this yet as I made the changes at around 1 AM and it looks a bit messy right now.
-
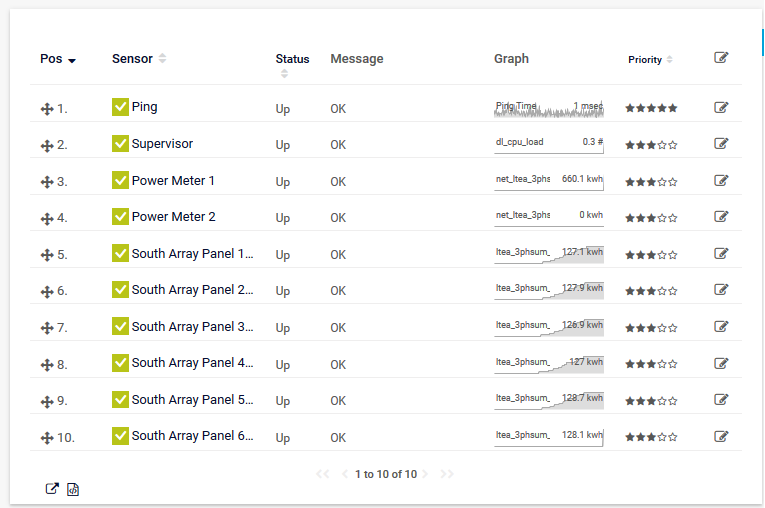
'State' has two values that I am aware of so far (working and error). PRTG doesn't do words, just numbers, so I am now converting to integer and reporting these as 0 (working), 1 (error) or 5 (unknown). 5 is completely made up and signifies that the reported state is a value that is unknown to the script. The unknown value is not stored because this is not a perfect world and perfection is best applied elsewhere. Moving on, I created a custom lookup that maps these integers to words in the UI... Yes, you guessed it: working; error; and unknown. These are associated with PRTG's up, warning and down. If you are new to PRTG, warning and down are alarms that change the color from green to either yellow or red. These can optionally be used for notifications. In its present state a notification would not make sense though as would be generated every day after sunset. However, if one inverter went into error state during the day, or if all went into error state during the day a notification might be useful. If the panel were covered in snow or leaves, or a random piece of (flying) carpet from the neighbors house you might want to know about it. It would be cool if the neighbor had a flying carpet of course. Ultimate bragging rights to be the owner of that mythical toy. TBD if I'll build logic in to intelligently alert to error state during the day and if that would be a function of the script or PRTG config. Here is a screenshot that shows the result of the loopkups. No code has been posted yet. Nobody is watching yet, so it's a moot point. :P
What's next: more tweaks based on what I see.
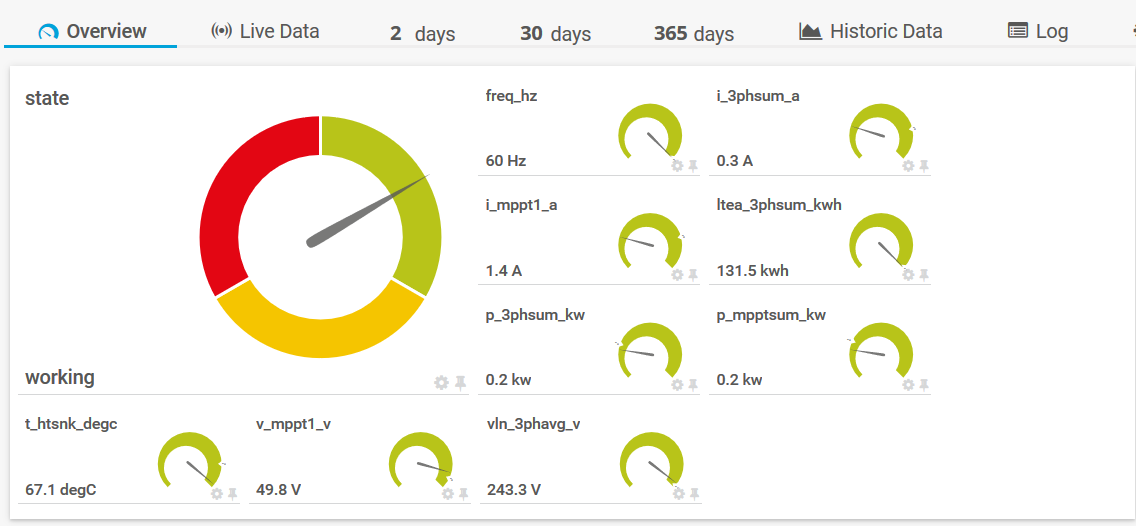
2018/07/26 The POC completed on 7/25 took the serial number provided for any inverter and returned all the values for it. The data returned is interesting. Now I've added logic to take the serial number provided, determine the device type first (Inverter, Power Meter, Supervisor), and then return the appropriate values for it along with the appropriate labels. Here is a screenshot showing the single script being used to retrieve values for three device types. The plan is to let this sit, gather data for a couple of days and then work to refine the script. No code has been posted yet.
2018/07/25 Proof of concept has been completed. Working to understand all the different elements next and to formulate an overall monitoring template. Note that because this is an evening project, the returned values are for 'night-time' therefore no energy being produced when the screenshot was created. :) No code has been posted yet.