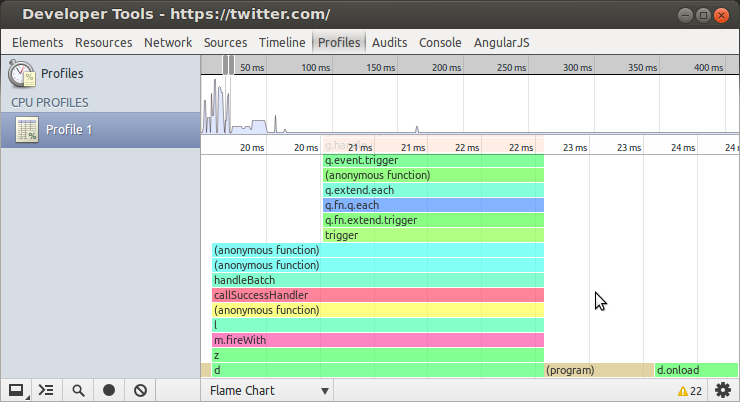
Chrome has a new debugging tool: a flame chart in the Javascript profiler. Unlike the existing Javascript profiler view in Chrome, the flame chart tells you when a function was running, not just how long it took.
The flame chart produces many numbers, what do they mean?
The flame chart is a sample-based profiler:
- It collects samples from the V8 profiler (through WebKit).
- Interpolates a stack time-series based on those samples.
These samples are taken approximately once every millisecond. The flame chart interpolates these samples and assumes if the program is in the same place as the last sample then the program was in that place the whole time.
Programs with small, fast function calls may have incomplete charts; but in general the stack charts are fairly accurate.
Hover over any function call to get a pop-up with several key numbers.
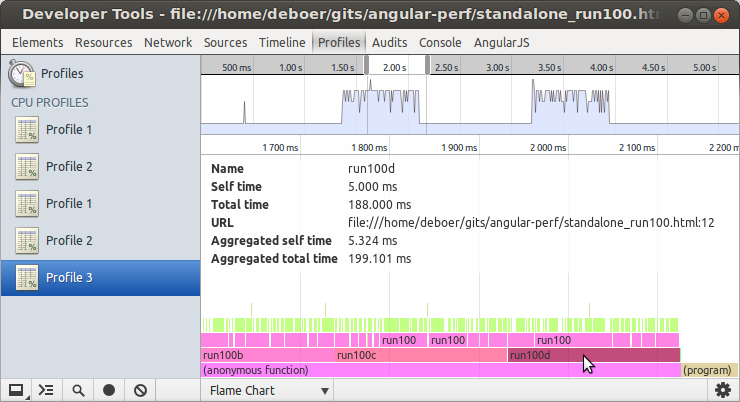
This is the pop-up for the "run100d" call. In this program, the run100a,b,c,d functions are designed to run for exactly 200ms. run100d calls run100, a busy loop polling window.performance.now(), twice.
- Name: The function name.
- Self time: The number of samples where run100d was the top frame.
- Total time: The number of samples where run100d was in the stack.
- Aggregated self time: The time the program was executing this stack and run100d was the top frame.
- Aggregated total time: The time the program was executing this stack.
Of the four numbers, "Aggregated total time" is the most useful. In my sample program, run100d is only ever called once, so the "Aggregated total time" is the actual time spent in run100d.
run100d calls run100 twice, the aggregated numbers for run100 will include all calls (two) to run100 from run100d. The aggregated numbers for run100 called from run100c will be different.
The "self time" and total time" are misreported. Although they claim to be milliseconds, they are actually the number of samples observed by the flame chart.
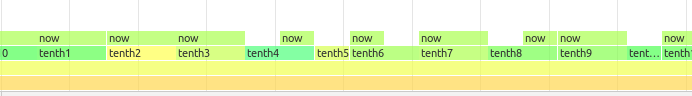
The flame chart takes a sample approximately every millisecond. In practice the rate is ~1.05ms
To measure this, I created 10 busy loop functions, one for each 1/10 of a millisecond. The flame chart shows that the sample point drifts by ~ 0.05ms per millisecond.
See sample_rate.html for the test.