Contributors
Bennett Blanco, Sofia Lopez Somohano, Jose Salerno, Camila Daza
Our project aims to gather insights into user preferences and identify the areas where each business can improve. Our goal is to comprehend the overall user sentiment, detect patterns in preferences, and ultimately provide models that would help businesses understand users' satisfaction to enhance customer experiences. This project would empower businesses to make informed decisions and improve the overall quality of customer experiences.
The Yelp Academic Dataset comprises over 6 million reviews across over 150,000 businesses. It is an academic resource available through an application on the official Yelp website. The data is stored in separate files in JSON format and includes business data, review text data, user data, check-ins, tips, and photo data. The JSONs altogether are a little over 10GB. So, in order to load all of the data and get it into a workable, tabular format, all the JSONs were placed in a BigQuery data lake. Additionally, the Business JSON had to be parsed line by line, since the schema could not be detected by BigQuery or any libraries. After this was done and the data lake was populated, we could construct the proper query to combine all the relevant queries from each JSON. To conduct our analysis, we connected our repo to the BigQuery project via a service account and queried a 5% sample of the compiled JSONs.
CREATE OR REPLACE TABLE `ba820-proj.yelp_academic_dataset.tabularized` AS (
SELECT *
FROM `ba820-proj.yelp_academic_dataset.reviews` reviews
LEFT JOIN (
SELECT user_id, average_stars AS average_user_stars, yelping_since, review_count AS submitted_reviews
FROM `ba820-proj.yelp_academic_dataset.users`
) USING (user_id)
LEFT JOIN (
SELECT business_id, name, address, city, state, postal_code latitude, longitude, stars AS average_business_stars, review_count AS recieved_reviews, categories, attributes
FROM `ba820-proj.yelp_academic_dataset.businesses`
) USING (business_id)
LEFT JOIN (
SELECT user_id, business_id, text AS tip_review
FROM `ba820-proj.yelp_academic_dataset.tips`
) USING (business_id, user_id)
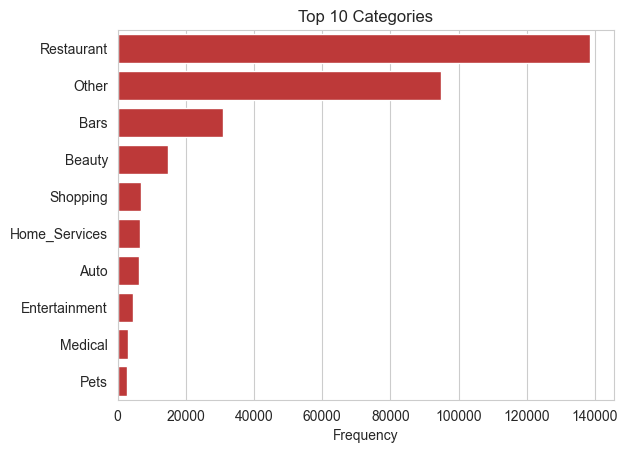
)As for our exploratory data analysis (EDA), the data was generally clean, as there were no outliers or duplicates, and null values were marginal. The primary challenge arose from the categories column, which stored arrays of categories for each business. Initially there were 52,592 unique categories array objects. To address this, we hardcoded 18 general categories, with top categories including restaurants and bars. Following this, we conducted basic visualizations to gain insights before delving into the analysis of review text values.
One of the main goals of this project is to derive meaning from customer reviews on their experiences at business establishments and to predict their star rating to generalize to other platforms for the businesses receiving the respective reviews. In order to do this, we first preprocessed and tokenized the reviews so that we can collect the embeddings. Upon doing so, we utilized the keys and indices in Word2Vec, which utilizes methods such as Continuous Bag of Words (CBOW) and skip-gram, to get our vector embeddings for our tokenized reviews.
With these embeddings, we were able to conduct a sentiment analysis of reviews, predict business star ratings based on embedded reviews using a pre-trained Word2Vec, and a cluster analysis that utilizes TSNE for dimensionality reduction.
The sentiment analysis allowed us to better classify reviews beyond their star category. We displayed a histogram of the sentiments to see if we can find a split between positive and negative reviews. Additionally, the sentiment will help us when clustering the data points.
Next, we conducted a cluster analysis with k-means for our embeddings using TSNE for dimensionality reduction. The idea is that the review embeddings will create densely separated clusters to reflect the categories and ratings of the reviews, while also being able to group on context. To cross-reference, we can conduct a separate cluster analysis of the reviews by star rating, category, and sentiment, as those are the reviews' objective (minus sentiment) reflections that don’t require context. If the clustering is similar, we can conclude that the TSNE components of the embeddings truly capture the context and meaning of the reviews. Lastly, we used the embeddings to try and predict star rating. We employed classifiers such as Random Forest and XGBoost to build multi-class classifiers that predict the star rating of the reviews.
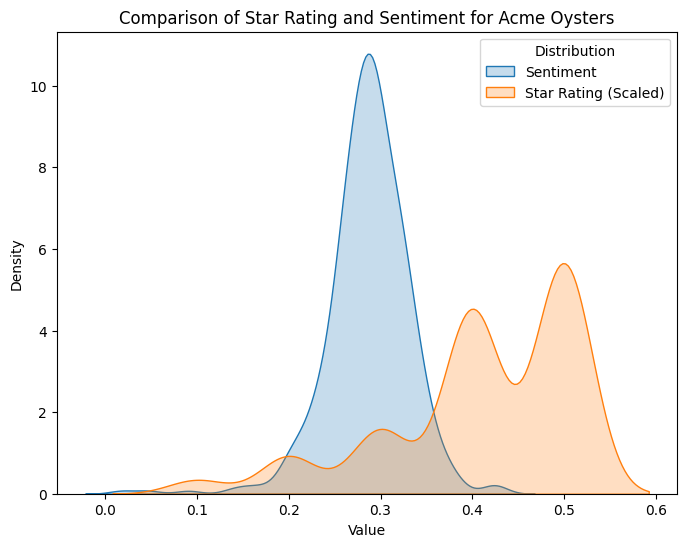
The sentiment analysis we conducted found that the sentiment of reviews generally falls between 0.1 and 0.5 across our sample (See Figure 8). This is interesting, given the star rating of a review is on an ordinal scale of one to five. While these sentiment scores might not be a one-to-one comparison with star ratings, it is still interesting that this is how the distribution formed. If the sentiments are correctly calculated, we can split down the middle, as a .3 would resemble a 3-star rating (generally considered neutral).
Our cluster analysis reveals some very interesting findings and limitations. After conducting TSNE on the embedded reviews, we utilized the elbow method and conducted k-means clustering to derive some insights. The clusters produced do not separate very well.
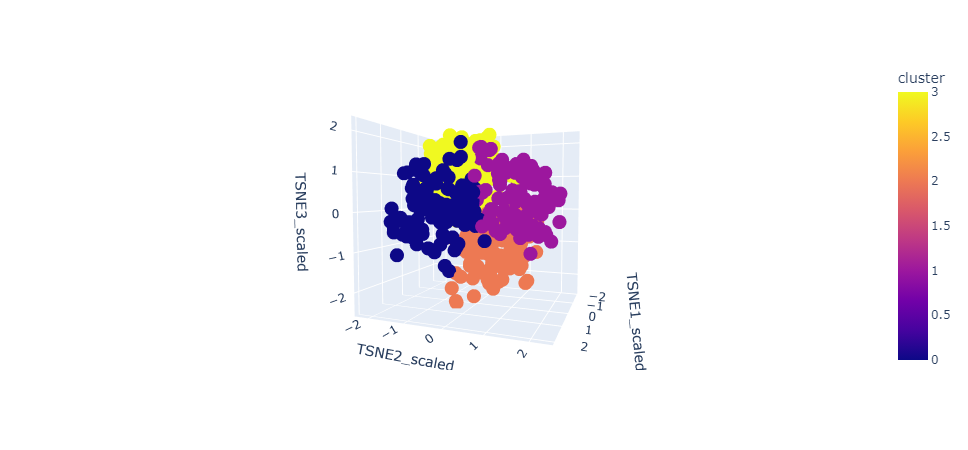
One reason for this is that we produced 100 vectors and reduced them to three TSNE components, so we could’ve lost a lot of information. Another reason might be that we used a pre-trained Word2Vec based on Wikipedia text, rather than training our own. When we cluster with embedded categories, we find that k-means can actually distinguish pretty well between the categories alone, but when trying to cluster entirely on embedded reviews, it struggles. This would suggest that wikipedia's text data is better on a definition basis than a business review basis.

Lastly, we applied some supervised models (XGBoost and Random Forest) to try and predict the star rating of reviews based on embeddings, which would provide a more objective scoring. Both models perform at about 60% accuracy but are also not hyperparameter-tuned, so they could possibly be viable with more exploration. (See Figures 6 and 7)
| precision | recall | f1-score | support | |
|---|---|---|---|---|
| 0 | 0.73 | 0.18 | 0.22 | 9908 |
| 1 | 0.18 | 0.38 | 0.30 | 5069 |
| 2 | 0.22 | 0.38 | 0.32 | 6465 |
| 3 | 0.35 | 0.43 | 0.43 | 13666 |
| 4 | 0.79 | 0.70 | 0.80 | 30425 |
| 5 | 0.63 | 0.51 | 0.65 | 65533 |
| accuracy | 0.59 | 65533 | ||
| macro avg | 0.46 | 0.45 | 0.45 | 65533 |
| weighted avg | 0.63 | 0.59 | 0.59 | 65533 |
| precision | recall | f1-score | support | |
|---|---|---|---|---|
| 0 | 0.70 | 0.38 | 0.47 | 9908 |
| 1 | 0.38 | 0.25 | 0.39 | 5069 |
| 2 | 0.42 | 0.26 | 0.32 | 6465 |
| 3 | 0.47 | 0.43 | 0.43 | 13666 |
| 4 | 0.75 | 0.80 | 0.80 | 30425 |
| 5 | 0.54 | 0.65 | 0.63 | 65533 |
| accuracy | 0.63 | 65533 | ||
| macro avg | 0.54 | 0.48 | 0.50 | 65533 |
| weighted avg | 0.63 | 0.63 | 0.62 | 65533 |
The sentiment analysis provides solid insights for any business that chooses to utilize it. Unlike star ratings, which can vary in interpretation among different users (different people may associate different sentiments with star values), sentiment analysis provides a more objective measure. In other words, sentiment analysis transcends the limitations of numeric ratings by capturing more of the context and subtleties of emotions and opinions, which will enable businesses to address specific concerns in a more targeted manner.
Therefore, we can use our sentiment analysis scores to better understand their reviews and see what they need to improve on in an objective way. Additionally, this sentiment score can be applied to reviews outside of Yelp, and on other platforms, garnering more reviews for a business to analyze as feedback. Furthermore, finding areas of improvement through sentiment analysis could lead to overall higher customer satisfaction.
Another business value derived from our project is acknowledging the multitude of platforms beyond Yelp where users express their opinions. Competitors such as Tripadvisor, Open Table, Google reviews, and even social media platforms like X and Reddit contribute to this landscape. Businesses may struggle to evaluate all the text information on these websites; however, our XGBoost and Random Forest model’s proficiency in predicting ratings from reviews can be a promising tool to standardize these diverse forms of feedback. Therefore, with our models, companies can effectively aggregate reviews and text data from multiple platforms and input them into our system. This enables businesses to gain insights into what users like or dislike about their services or products beyond Yelp.
One of our initial objectives included creating a robust and efficient recommendation system that Yelp could implement in its platform. This recommendation would provide Yelp users with top-notch location suggestions based on their past reviews and ratings. However, we encountered a significant challenge due to the vast amount of data we had to work with, which made it challenging to apply a linear kernel. Nevertheless, we are determined to overcome this obstacle in the future by exploring different modeling techniques and implementing a virtual machine (VM) to process these recommendations. Furthermore, we want to create a more comprehensive system combining sentiment analysis with our existing algorithms and models. Through this, Yelp could provide users with the best possible business recommendations, making their experiences enjoyable and hassle-free. To ensure that our models are reliable and effective, we will collect data from various platforms that are described above. These platforms will provide us with different types of data, including reviews, ratings, and user information.
