Git Product home page Git Product logo

indicators's Introduction

CodeFactor npm version npm size npm downloads last commit

logo

Supports

Browser, ES6, CommonJS, NodeJS, Bun

About

Fastest Technical Indicators written in TypeScript

  • Zero Dependencies: @ixjb94/Indicators is built from the ground up to be self-contained, with no external dependencies.
  • No Internal Function Calls: Each Method in the library operates independently.

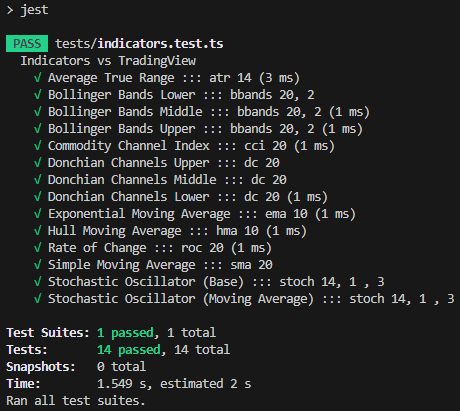
Tests (Jest)

All of the indicators data have been tested with TradingView data and other Libraries.
You can find few in ./tests folder.
(Or you can run: npm test)
Note: All data have been tested with at least last 3 (tail) of TradingView's data.
Data Window: DOGEUSDT-4h-2023-10 (October)
Data Source: Binance Futures ::: Binance Vision
Tests

Comparison with TradingView (EMA 10)

Indicators Data Test

Benchmark

See full Benchmark info

Installation

npm install @ixjb94/indicators

Usage NodeJS

import { Indicators } from "@ixjb94/indicators"

// OR
const { Indicators } = require("@ixjb94/indicators")

Usage Browser

index.html example:

<!DOCTYPE html>
<html lang="en">
<head>
	<title>My Indicators</title>
</head>
<body>

	<!--
		PLEASE NOTE: you probably just need one of these
		- browser.js
		- browser-indicators.js
		- browser-indicatorsNormalized.js
		- browser-indicators-sync.js
		- browser-indicatorsNormalized-sync.js
	-->

	<!-- all versions -->
	<script src="./node_modules/@ixjb94/indicators/dist/browser.js"></script>

	<!-- indicators -->
	<script src="./node_modules/@ixjb94/indicators/dist/browser-indicators.js"></script>
	
	<!-- normalized indicators -->
	<script src="./node_modules/@ixjb94/indicators/dist/browser-indicatorsNormalized.js"></script>

	<!-- sync indicators -->
	<script src="./node_modules/@ixjb94/indicators/dist/browser-indicators-sync.js"></script>

	<!-- sync normalized indocators -->
	<script src="./node_modules/@ixjb94/indicators/dist/browser-indicatorsNormalized-sync.js"></script>
	<script>
		const library = indicators
		const ta = new library.Indicators()

		ta.ema(close, 20).then(data => console.log(data))
	</script>
</body>
</html>

Note: you can move files from node_modules to somewhere else you want to like dist, public, etc.

OR you can use unpkg:

https://unpkg.com/@ixjb94/indicators@latest/dist/browser.js
https://unpkg.com/@ixjb94/indicators@latest/dist/browser-indicators.js
https://unpkg.com/@ixjb94/indicators@latest/dist/browser-indicatorsNormalized.js
https://unpkg.com/@ixjb94/indicators@latest/dist/browser-indicators-sync.js
https://unpkg.com/@ixjb94/indicators@latest/dist/browser-indicatorsNormalized-sync.js

Indicators Consists Of

Indicators consists of these classes:
1- Indicators: new Indicators()
2- IndicatorsNormalized: new IndicatorsNormalized()
3- IndicatorsSync: new IndicatorsSync()
4- IndicatorsNormalizedSync: new IndicatorsNormalizedSync()

Q: What is the difference between Indicators and IndicatorsNormalized?
A: IndicatorsNormalized will fill the gap for you, example (SMA 3 with 5 closes):

[NaN, NaN, 1, 2, 3]

But the Indicators will give you the SMA3 with 5 closes like this:

[1, 2, 3]

Note: Please note that the performance between IndicatorsNormalized and Indicators are the same,
so it's better to use IndicatorsNormalized.

Examples

Note: Everything isPromised so you need to do .then or await
unless you use Sync versions.

let ta = new Indicators()

ta.sma(close, 20)
ta.rsi(close, 14)

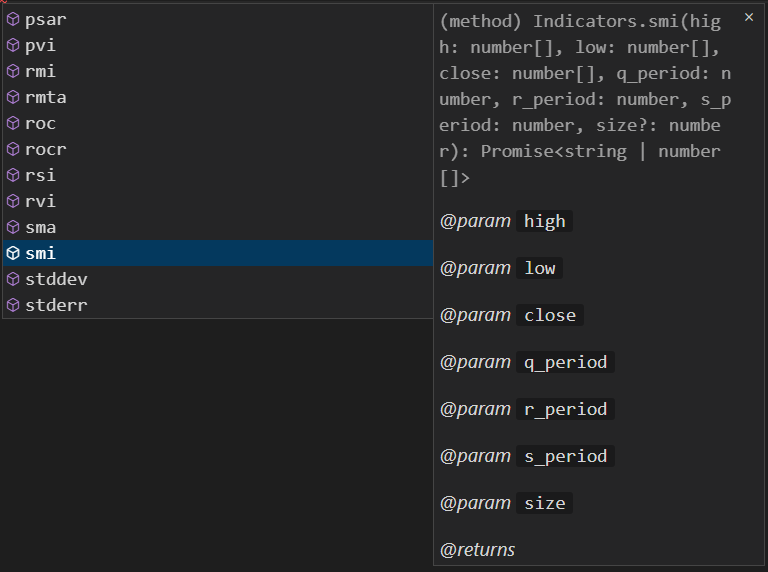
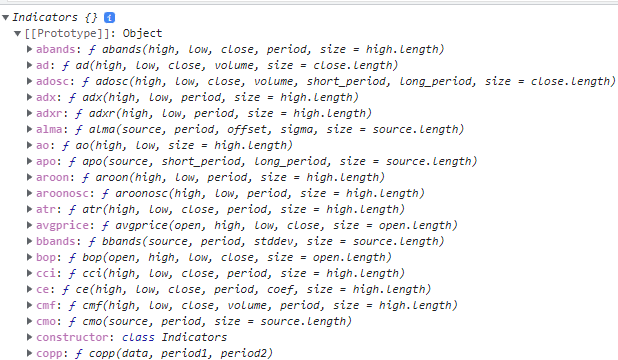
Types & Intellisense & Browser Support

types browser

Indicators

โœ… = Available and fastest
โŒ = Indicator is not available
๐Ÿ”„ = Developing...
Compared to:
node-talib, tulipnode, technicalindicators, pandas_ta

Identifier Indicator Name @ixjb94/indicators
ad Accumulation/Distribution Line โœ…
adosc Accumulation/Distribution Oscillator โœ…
adx Average Directional Movement Index โœ…
adxr Average Directional Movement Rating โœ…
ao Awesome Oscillator โœ…
apo Absolute Price Oscillator โœ…
aroon Aroon โœ…
aroonosc Aroon Oscillator โœ…
atr Average True Range โœ…
avgprice Average Price โœ…
bbands Bollinger Bands โœ…
bop Balance of Power โœ…
cci Commodity Channel Index โœ…
cmo Chande Momentum Oscillator โœ…
crossany Crossany โœ…
crossover Crossover โœ…
crossunder Crossunder โœ…
crossOverNumber Crossover a number โœ…
crossUnderNumber Crossunder a number โœ…
cvi Chaikins Volatility โœ…
decay Linear Decay โœ…
dema Double Exponential Moving Average โœ…
di Directional Indicator โœ…
dm Directional Movement โœ…
dpo Detrended Price Oscillator โœ…
dx Directional Movement Index โœ…
edecay Exponential Decay โœ…
ema Exponential Moving Average โœ…
emv Ease of Movement โœ…
fisher Fisher Transform โœ…
fosc Forecast Oscillator โœ…
hma Hull Moving Average โœ…
kama Kaufman Adaptive Moving Average โœ…
kvo Klinger Volume Oscillator โœ…
lag Lag โœ…
linreg Linear Regression โœ…
linregintercept Linear Regression Intercept โœ…
linregslope Linear Regression Slope โœ…
macd Moving Average Convergence/Divergence โœ…
marketfi Market Facilitation Index โœ…
mass Mass Index โœ…
max Maximum In Period โœ…
md Mean Deviation Over Period โœ…
medprice Median Price โœ…
mfi Money Flow Index โœ…
min Minimum In Period โœ…
mom Momentum โœ…
natr Normalized Average True Range โœ…
nvi Negative Volume Index โœ…
obv On Balance Volume โœ…
ppo Percentage Price Oscillator โœ…
psar Parabolic SAR โœ…
pvi Positive Volume Index โœ…
qstick Qstick โœ…
roc Rate of Change โœ…
rocr Rate of Change Ratio โœ…
rsi Relative Strength Index โœ…
sma Simple Moving Average โœ…
stddev Standard Deviation Over Period โœ…
stderr Standard Error Over Period โœ…
stoch Stochastic Oscillator โœ…
stochrsi Stochastic RSI โœ…
sum Sum Over Period โœ…
tema Triple Exponential Moving Average โœ…
tr True Range โœ…
trima Triangular Moving Average โœ…
trix Trix โœ…
tsf Time Series Forecast โœ…
typprice Typical Price โœ…
ultosc Ultimate Oscillator โœ…
var Variance Over Period โœ…
vhf Vertical Horizontal Filter โœ…
vidya Variable Index Dynamic Average โœ…
volatility Annualized Historical Volatility โœ…
vosc Volume Oscillator โœ…
vwma Volume Weighted Moving Average โœ…
wad Williams Accumulation/Distribution โœ…
wcprice Weighted Close Price โœ…
wilders Wilders Smoothing โœ…
willr Williams %R โœ…
wma Weighted Moving Average โœ…
zlema Zero-Lag Exponential Moving Average โœ…
abands โœ…
alma Arnaud Legoux Moving Average โœ…
ce Chandelier Exit โœ…
cmf Chaikin money flow โœ…
copp Coppock Curve โŒ
dc Donchian Channels โœ…๐Ÿ”„
fi Force index โœ…
ikhts โŒ
kc Keltner Channels โœ…
kst Know Sure Thing โœ…
mama MESA Adaptive Moving Average โŒ
pbands โœ…
pc โŒ
pfe Polarized Fractal Efficiency โœ…
posc โœ…
rmi Relative Momentum Index โœ…
rmta Recursive Moving Trend Average โœ…
rvi Relative Vigor Index โœ…
smi Stochastic Momentum Index โœ…
tsi True Strength Index โœ…
vwap Volume-Weighted Average Price โœ…

Icon by

https://www.flaticon.com/free-icon/bar-graph_3501061
Author: Freepik
Website: https://www.freepik.com
https://www.flaticon.com/authors/freepik

indicators's People

Contributors

ixjb94 avatar

Stargazers

 avatar  avatar  avatar  avatar  avatar  avatar  avatar  avatar  avatar  avatar  avatar  avatar  avatar  avatar  avatar  avatar  avatar  avatar  avatar  avatar  avatar  avatar  avatar  avatar  avatar  avatar  avatar  avatar  avatar  avatar  avatar  avatar  avatar  avatar  avatar  avatar  avatar  avatar  avatar  avatar

Watchers

 avatar  avatar

indicators's Issues

MACD returning different result from tradingview's MACD

Hi again,

I have been trying to get the MACD working like on my tradingview but to no avail.

Tradingview's macd shows last 4 histograms values as -3, 1.3, 0.9, 3 vs what I get is -0.3164, -0.25768, -0.24459, -0.13909.

I configured my macd in the library as ta.macd(close1m, 12, 26, 9) and passing the close bars of the btc 1min klinedata and I belive the configuration is as it should according to my tradingview setup
image

Can you perhaps tell me what I am doing wrong?

B-Xtrender

I'm not a professional programmer, so my code may seem "dirty" :)
This is a good popular indicator. ( https://www.tradingview.com/script/YHZimEz8-B-Xtrender-Puppytherapy/ )
But I still want to share!

async function bXtrender(close, short_l1, short_l2, short_l3, long_l1, long_l2) {
    const ema_short_l1 = await ta.ema(close, short_l1);
    const ema_short_l2 = await ta.ema(close, short_l2);
    const ema_lohg_l1 = await ta.ema(close, long_l1);
    const subResult = ema_short_l1.map((v, i) => v - ema_short_l2[i]);
    const longXtrend = await ta.rsi(ema_lohg_l1, short_l3);
    const shortXtrend = await ta.rsi(subResult, long_l2);
    const shortTermXtrender = shortXtrend.map(v => v - 50);
    const longTermXtrender = longXtrend.map(v => v - 50);
    const len = 5;
    const src = shortTermXtrender;

    let xe1_1 = await ta.ema(src, len);
    let xe2_1 = await ta.ema(xe1_1, len);
    let xe3_1 = await ta.ema(xe2_1, len);
    let xe4_1 = await ta.ema(xe3_1, len);
    let xe5_1 = await ta.ema(xe4_1, len);
    let xe6_1 = await ta.ema(xe5_1, len);

    let b_1 = 0.7;
    let c1_1 = (-b_1 * b_1 * b_1);
    let c2_1 = (3 * b_1 * b_1 + 3 * b_1 * b_1 * b_1);
    let c3_1 = (-6 * b_1 * b_1 - 3 * b_1 - 3 * b_1 * b_1 * b_1);
    let c4_1 = (1 + 3 * b_1 + b_1 * b_1 * b_1 + 3 * b_1 * b_1);

    let nT3Average_xe6_1 = xe6_1.map(v => v * c1_1);
    let nT3Average_xe5_1 = xe5_1.map(v => v * c2_1);
    let nT3Average_xe4_1 = xe4_1.map(v => v * c3_1)
    let nT3Average_xe3_1 = xe3_1.map(v => v * c4_1);

    const nT3Average = nT3Average_xe6_1.map((v, i) => v + nT3Average_xe5_1[i] + nT3Average_xe4_1[i] + + nT3Average_xe3_1[i]);
    return [longTermXtrender, nT3Average];
}

Do it:

                const short_l1 = 5;
                const short_l2 = 20;
                const short_l3 = 15;
                const long_l1 = 20;
                const long_l2 = 15;
                const results = await bXtrender(close, short_l1, short_l2, short_l3, long_l1, long_l2);
                console.log(results);

I checked with the original indicator on tradingview - they are like twins :)
image

If you have time, please add it to your library

P.S. I tried to make a kvo indicator like here (https://www.tradingview.com/script/Ka0gS4Kh-Klinger-Volume-Oscillator-KVO/), but it didnโ€™t work

I will be glad if you can do this.

Thank you for the excellent library of indicators!

bbands returns all NaN

Hi again,

sorry to bother you again. Everything is working great now but i was trying to use bollinger bands and everything it returns is NaN, what am I doing wrong? Any Idea?

I tried passing an array of objects like these:

 {
        time: parseInt(x[0]),
        open: parseFloat(x[1]),
        high: parseFloat(x[2]),
        low: parseFloat(x[3]),
        close: parseFloat(x[4]),
        volume: parseFloat(x[5]),
      };

and also an array of arrays, but no cigar.

I am calling it like this: ta.bbands(historicalData1min, 20, 3)

AO not returning result

Hi there.

I tried using ta.ao(high, low) but nothing is returned. I can get data on the same dataset from ta.rsi but not .ao, everything is undefined. Why? Can you explain?

Also I wonder why RSI is quite off from how for example the TMA v2 indicator or VMV cipher b (or any tradingview indicator really) calculates it....

Any help is greatly appreciated.

Paid Consultancy Project

Hi

Trust you are doing good. We are a commercial project looking for talents like yourself.

How can we contact you? We want to avail your services for a commercial project. We are interested in similar work but somewhat very different which focuses on indicator optimizations

You can email us at [email protected]

Questions about results and format

Hi there

First of all thanks because this is great for those of us in TS :)

I have 2 questions:

  1. Is the data returned from say ta.rsi(close5m, rsiPeriod) is in desc or asc order? meaning is index 0 the most recent?
  2. Why is it that the data is SO different from the tradingview indiators?

I think I am doing things correctly but please try to double check:

I fetch kline data for a good chunk (7 to 14 days) on 5 min, 15 min and 1h interval. For each of those individual datasets, I run the RSI as shown before and AO as follows: ta.ao(high15m, low15m).

The results are wildly different when i compare the numbers with the indicators on tradingview on the same coin - how come?

RSI at index 0 on 5m tf for OPUSDT shows 29.9 ta.rsi I call but on tradingview is like 60. The last index is 67, and although closer is still quite far off id say.

Any idea?

PSAR vs TV PSAR

Hello! Can you help me with the PSAR indicator? I can't get the same result as TradingView. I can't figure out what length the high and low input data should be?

Getting error while using the library

ERROR in ./node_modules/technical-indicators/src/core/indicators.ts 10:46
Module parse failed: Unexpected token (10:46)
File was processed with these loaders:

  • ./node_modules/source-map-loader/dist/cjs.js
    You may need an additional loader to handle the result of these loaders.
    | * @returns
    | */

async normalize(originalLength: number, source: Array | string, empty = NaN): Promise<Array> {
| const diff = originalLength - source.length
|

Getting this error when i used your library in my react.js project.

Already tried every solution mentioned here
https://stackoverflow.com/questions/63423384/you-may-need-an-additional-loader-to-handle-the-result-of-these-loaders.

could not get out of the issue.

It could be very helpful for me if you solve this error.

If i comment the errored code. i will get error at other code lines

Async Functions

Thank you for this library! I hope it won't be too cheeky to offer a wee bit of feedback -- marking the functions as async offers no advantage as all the code I can see is all synchronous. Users will end up awaiting the results for no discernible benefit. Not a big deal, but it can complicate things if running inside complex loops, causing the caller to have to await every layer up the call stack up to that point.

Add tests

I would suggest adding unit tests starting from the most used indicators

Does it handle decimals?

Hello, I'm wondering if floating point error/decimal calculations are handled under the hood?

Recommend Projects

  • React photo React

    A declarative, efficient, and flexible JavaScript library for building user interfaces.

  • Vue.js photo Vue.js

    ๐Ÿ–– Vue.js is a progressive, incrementally-adoptable JavaScript framework for building UI on the web.

  • Typescript photo Typescript

    TypeScript is a superset of JavaScript that compiles to clean JavaScript output.

  • TensorFlow photo TensorFlow

    An Open Source Machine Learning Framework for Everyone

  • Django photo Django

    The Web framework for perfectionists with deadlines.

  • D3 photo D3

    Bring data to life with SVG, Canvas and HTML. ๐Ÿ“Š๐Ÿ“ˆ๐ŸŽ‰

Recommend Topics

  • javascript

    JavaScript (JS) is a lightweight interpreted programming language with first-class functions.

  • web

    Some thing interesting about web. New door for the world.

  • server

    A server is a program made to process requests and deliver data to clients.

  • Machine learning

    Machine learning is a way of modeling and interpreting data that allows a piece of software to respond intelligently.

  • Game

    Some thing interesting about game, make everyone happy.

Recommend Org

  • Facebook photo Facebook

    We are working to build community through open source technology. NB: members must have two-factor auth.

  • Microsoft photo Microsoft

    Open source projects and samples from Microsoft.

  • Google photo Google

    Google โค๏ธ Open Source for everyone.

  • D3 photo D3

    Data-Driven Documents codes.