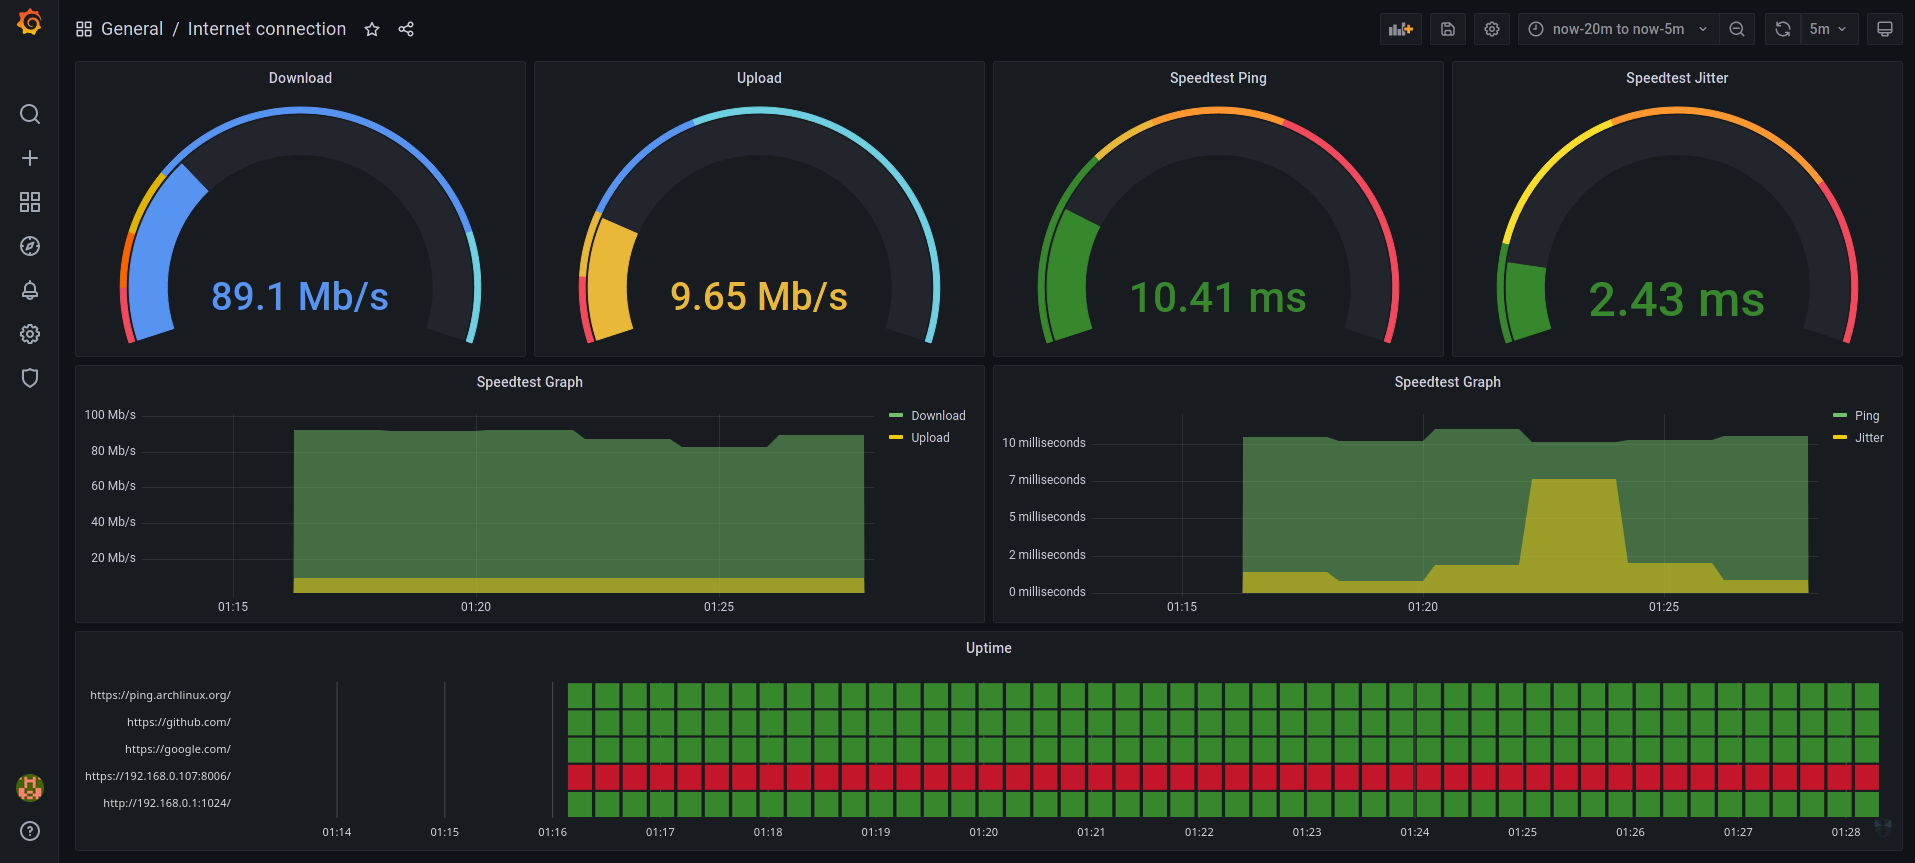
A simple and modern tool for monitoring internet speed history and uptime of specified URLs.
This is all implemented with a simple docker-compose stack with Prometheus + Grafana with blackbox-exporter and speedtest-exporter to collect and graph home Internet reliability and throughput.
Make sure Docker and Docker Compose are installed on your Docker host machine.
- To change default grafana credentials, change the
GF_SECURITY_ADMIN_USERandGF_SECURITY_ADMIN_PASSWORDvariables in./grafana/auth.envfile. - To change what hosts you ping you change the
targetssection in./prometheus/blackbox.yamlfile. - To change how often speedtest is ran, edit the
scrape_intervalunderspeedtestcategory in./prometheus/prometheus.yml, default duration is 30 minutes, which might be too much if you have limit on downloads.
After you've configured everything, you can simply use docker-compose to spin up all of the needed services:
docker-compose up -dIt will take a while until grafana loads, so be patient, after it does, it will be accessible via: http://<Host IP Address>:3000 (default credentials are username: admin, password: admin).
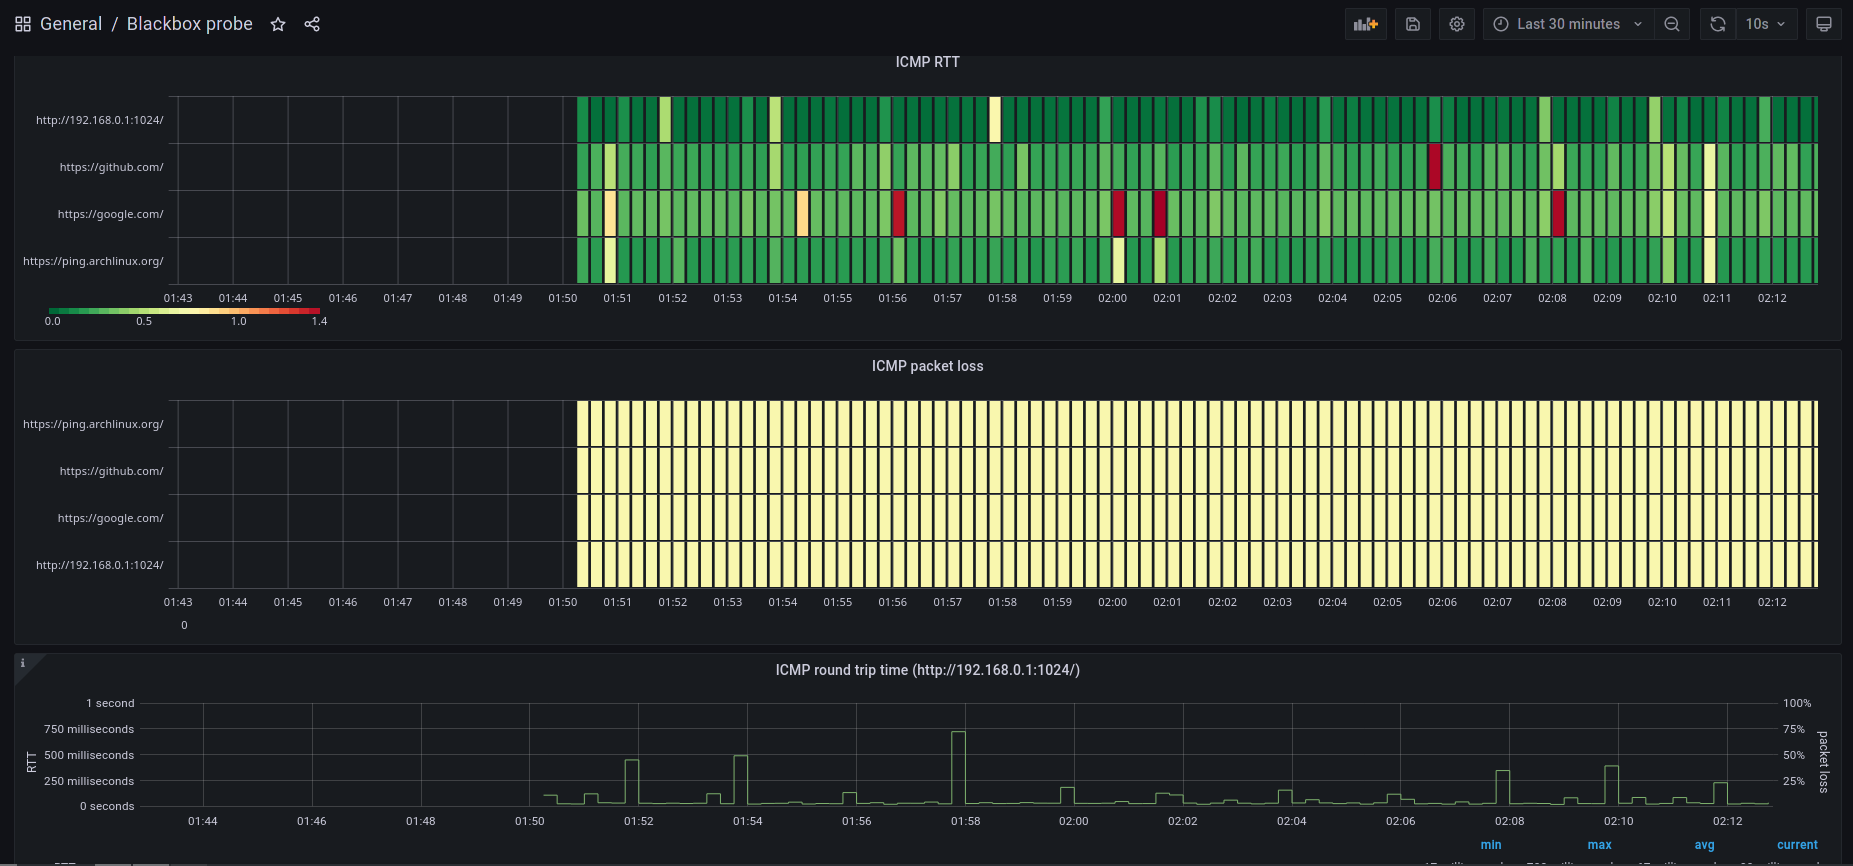
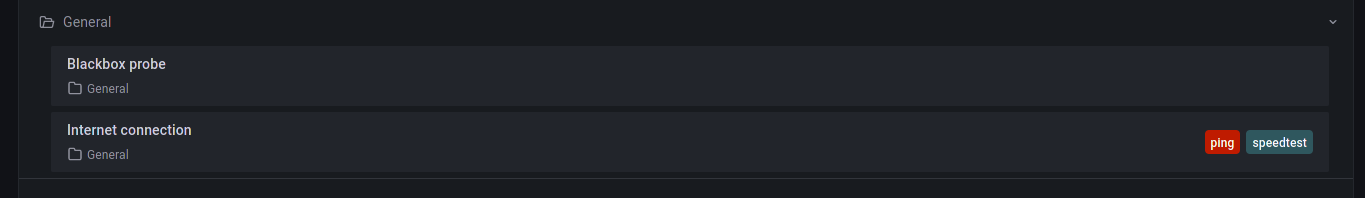
If all works you should see 2 dashboards after clicking on Search button in the left navbar:
- http://localhost:9798/metrics speedtest exporter endpoint. Does take about 30 seconds to show its result as it runs an actual speedtest when requested.
- http://localhost:9115 blackbox exporter endpoint. Lets you see what have failed/succeeded.
- http://localhost:9090/targets shows status of monitored targets as seen from prometheus - in this case which hosts being pinged and speedtest. note: speedtest will take a while before it shows as UP as it takes about 30s to respond.
- http://localhost:9090/graph?g0.expr=probe_http_status_code&g0.tab=1 shows prometheus value for
probe_http_status_codefor each host. You can edit/play with additional values. Useful to check everything is okay in prometheus (in case Grafana is not showing the data you expect).
All of the data from grafana and prometheus are stored using docker volumes, you will need to remove those in order to wipe the data:
- Stop the application:
docker-compose down - See all of the volumes
docker volume ls - Remove unused ones
docker volume prune(NOTE: this will remove all unused volumes, not just those from this project, if you have other volumes which you want to preserve usedocker volume rm [volume id 1] [volume id 2] ...instead!)
Everyone has a bit different internet speed requirements and different standards of what's considered as fast, for that reason, you can simply click on the name of any of the gauges, and click edit
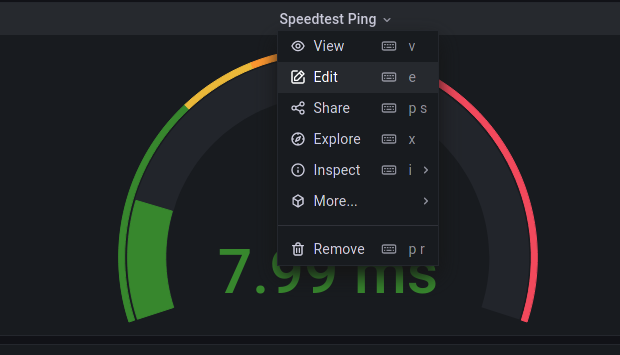
An edit menu will show where in the left panel you can configure the minimum and maximum values shown on the gauge:
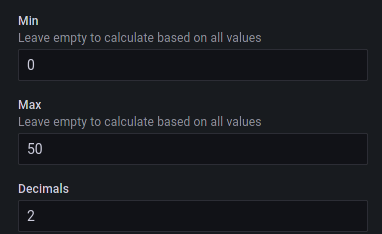
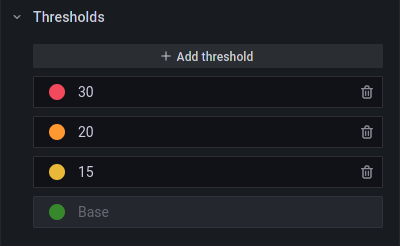
You can also edit the color thresholds depending on the speeds to your liking (i.e. you can set after which point should the color become red/orange/...). Note that with the download/upload gauges you will need to enter the speed in bits per second, not megabits!
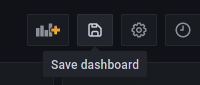
After your editing is done and you're happy with your layout, make sure you save the layout and copy the JSON:
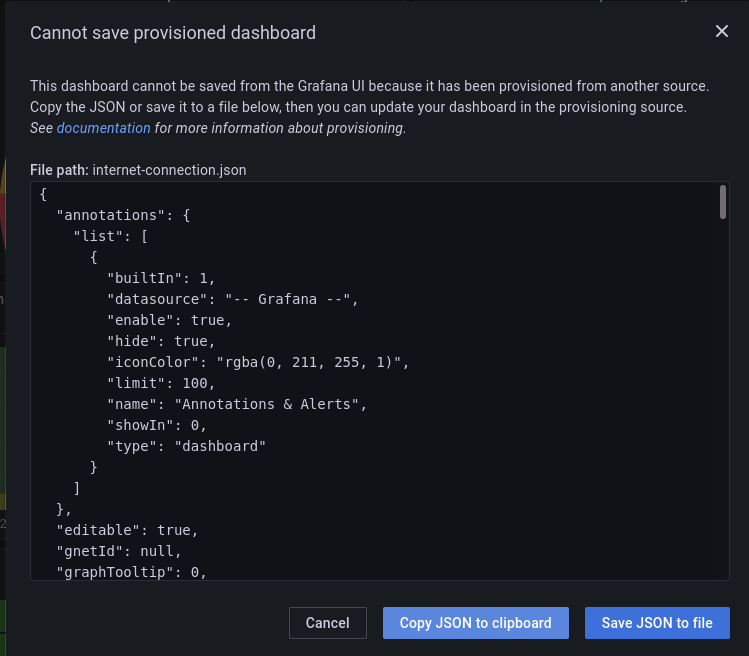
Simply click on Copy JSON to clipboard and paste it to ./grafana/provisioning/dashboards/internet-connection.json. Alternatively, if you're editing the Blackbox probe dashboard, store them in probe.json
- Thanks to
@maxandersenfor making the original project this fork is based on. - Thanks to
@geerlingguyfor perfecting the original project with a custom fork. - Thanks to
@goddenrichfor perfecting the original project with a custom fork.
This setup is not secured in any way, so please only use on non-public networks, or find a way to secure it on your own.