gis-day-map
A simple map built with esri-leaflet to find GIS Day events all around the world. Share it with your friends or just use the code to build your own fun and interactive mapping apps. The entire app is only about 150 lines of JavaScirpt code!
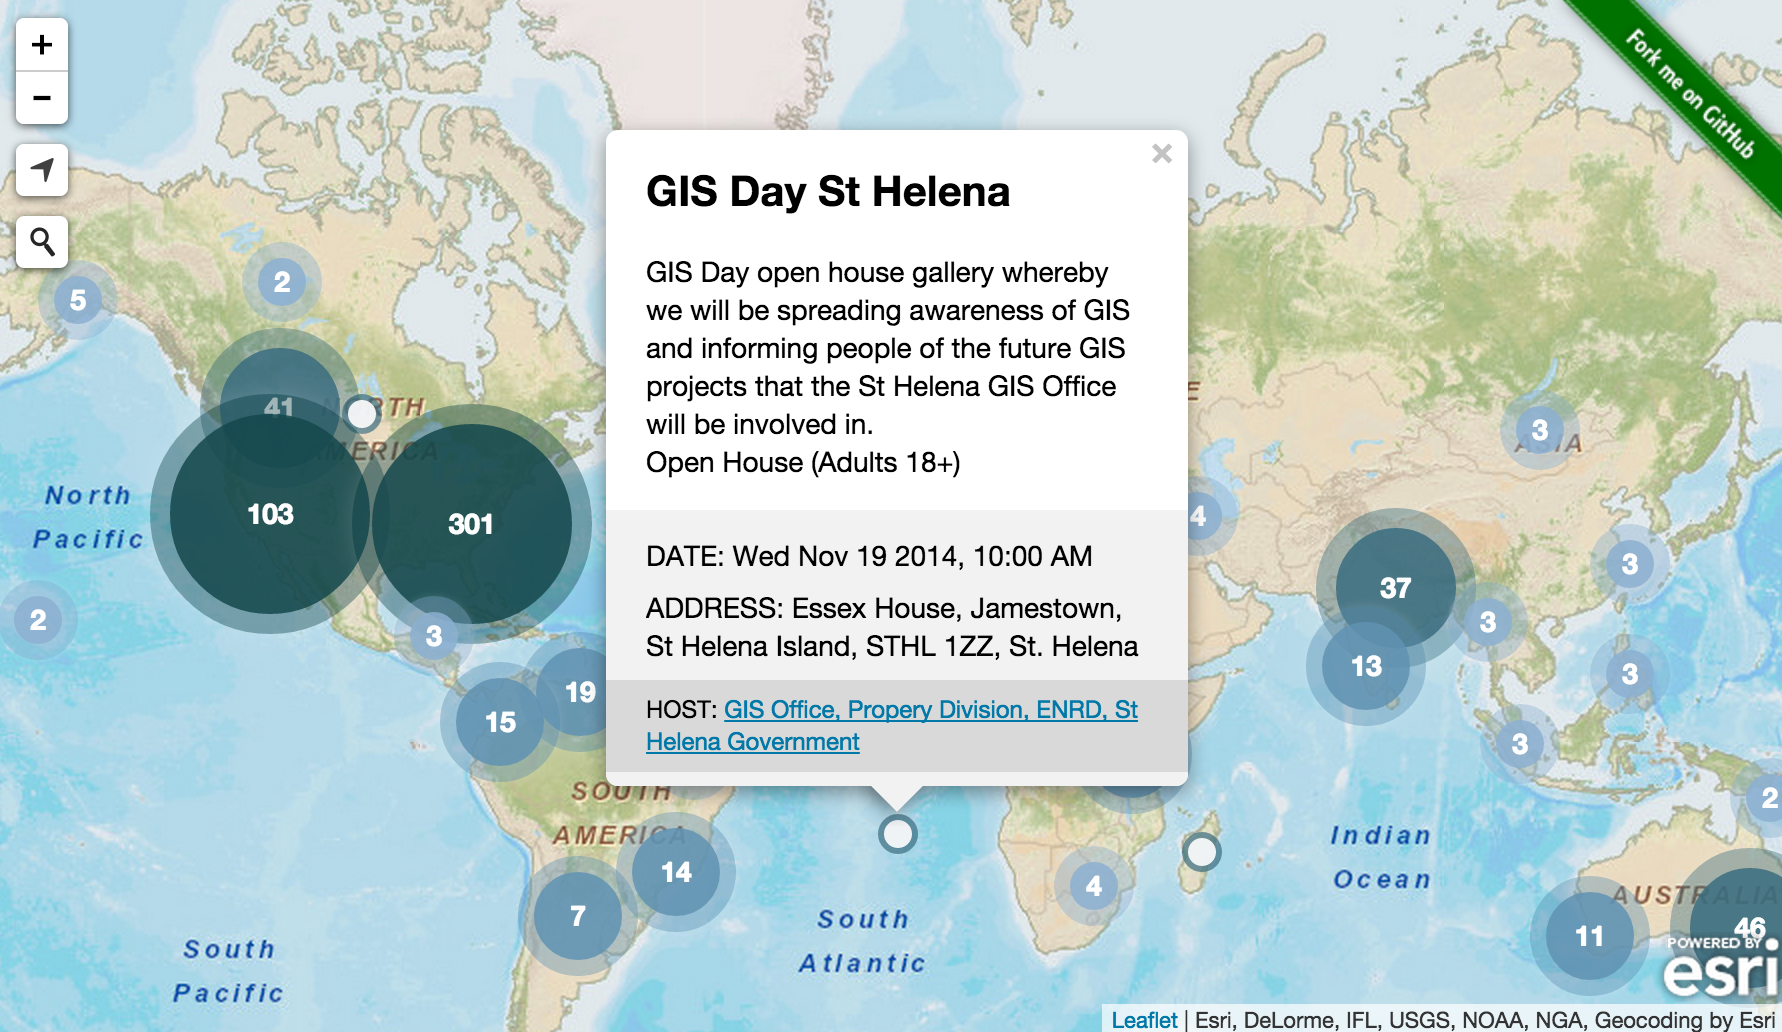
Features
- esri-leaflet, esri-leaflet-geocoder, ArcGIS basemaps and ArcGIS Online feature services
- Dynamic search for feature service and world geocode service
- Interactive popups
- Point clustering
Instructions
- Fork and then clone the repo.
- Try the example live here.
NOTE: You should just be able to cut-and-paste and run it in JSFiddle!
Code
<div id="map"></div>

<script>
    var map,
        clusterLayer,
        singlePin;

    map = L.map('map', { maxZoom: 16 }).setView([15, -35], 2);

    // Use Esri Streets or GrayLables
    L.esri.basemapLayer('Streets').addTo(map);

    singlePin = L.divIcon({
        html: '<div><svg version="1" xmlns="http://www.w3.org/2000/svg" viewBox="0 0 100 100"><circle cx="50" cy="50" r="50"/></svg></div>',
        className: 'marker',
        iconSize: null,
        popupAnchor: [0, -11]
    });

    // Create cluster layer from GIS Day data in AGOL
    clusterLayer = L.esri.clusteredFeatureLayer('http://services.arcgis.com/uCXeTVveQzP4IIcx/arcgis/rest/services/gisdaydata/FeatureServer/0',
    {
        spiderfyOnMaxZoom: true,
        showCoverageOnHover: false,
        maxClusterRadius: 55,

        // Single pins
        pointToLayer: function (geojson, latlng) {
            return L.marker(latlng, {
                icon: singlePin
            });
        },

        // Format popups
        onEachFeature: function (geojson, marker) {
            var url = geojson.properties.URL ? "<a target='_blank' href='" + geojson.properties.URL.toString() + "'>" + geojson.properties.Name + "</a>" : geojson.properties.Name,
                desc =  geojson.properties.Description,
                dateTime = new Date(geojson.properties.DateTime),
                min = dateTime.getMinutes() ? dateTime.getMinutes() : "00",
                hr = dateTime.getUTCHours(),
                ampm = hr < 12 ? "AM" : "PM";
            hr = hr > 12 ? hr - 12 : hr;
            dateTime = dateTime.toDateString() + ", " + hr + ":" + min + " " + ampm;
            marker.bindPopup("<h2>" + url + "</h2><p>" +  desc + "<br>" + geojson.properties.Type + " " + geojson.properties.Audience + "</p></div><div class='popup-bottom'><p>DATE: " + dateTime + "</p><p>ADDRESS: " + geojson.properties.Address + "</p><div class='popup-host'><p>HOST: <a target='_top' href='mailto:" + geojson.properties.Email + "?subject=GIS Day Event'>" + geojson.properties.Organization + "</a></p></div></div>");
            // store data
            marker.properties = {};
            marker.properties.Name = geojson.properties.Name;
        },

        // Cluster styles
        iconCreateFunction: function (cluster) {
            var count = cluster.getChildCount(),
                clusterSize;
            // Get cluster count
            if (count > 1 && count <= 5)
                clusterSize = "small";
            else if (count > 5 && count <= 20)
                clusterSize = "medium";
            else if (count > 20 && count <= 50)
                clusterSize = "large";
            else
                clusterSize = "xlarge";
            // Create cluster
            return new L.DivIcon({
                html: "<div><span>"+count+"</span></div>",
                className:"cluster cluster-"+clusterSize,
                iconSize: null
            });
        }
    }).addTo(map);

    // Auto-show popup
    clusterLayer.on('mouseover', function (e) {
        e.layer.openPopup();
    });

    // Zoom in to single feature, always show popup
    clusterLayer.on('click', function (e) {
        e.layer.openPopup();
    });

    // Show popup
    clusterLayer.on('mousedown', function (e) {
        e.layer.openPopup();
    });

    // Zoom
    clusterLayer.on('dblclick', function(e) {
        map.setZoomAround(e.latlng, map.getZoom() + 1);
    });

    // Prevent toggling/flickering effect of popup
    map.on('mouseup', function(e) {
        if (e.target._popup) {
            e.target._popup._isOpen = false;
        }
    });

    // Add geolocation control
    L.control.locate({
      follow: false,
      icon: 'icon-location',
      showPopup: false,
       locateOptions: {
         maxZoom: 13
      }
    }).addTo(map);

    // Add search control to search world places as well as GIS Day feature service
    var searchControl = new L.esri.Geocoding.Controls.Geosearch({
      placeholder: "Search for event name, host or location",
      useMapBounds: false,
      providers: [
            new L.esri.Geocoding.Controls.Geosearch.Providers.FeatureLayer('http://services.arcgis.com/uCXeTVveQzP4IIcx/arcgis/rest/services/gisdaydata/FeatureServer/0', {
          searchFields: ['Name', 'Organization'],
          label: 'GIS Day Events',
          bufferRadius: 5000,
          formatSuggestion: function(feature){
            return feature.properties.Name + ' - ' + feature.properties.Organization;
          }
        })
      ]
    }).addTo(map);

    // Show feature and popup when selected
    searchControl.on("results", function(data){
       if(data.results && data.results[0].properties.FID){
        clusterLayer.once('load', function(){
          clusterLayer.getFeature(data.results[0].properties.FID).openPopup();
        });
      }
    });
</script>
Requirements
- Notepad or your favorite HTML editor
Resources
Issues
Find a bug or want to request a new feature? Please let us know by submitting an issue. Thank you!
Contributing
Anyone and everyone is welcome to contribute. Please see our guidelines for contributing.
Licensing
Copyright 2014 Esri
Licensed under the Apache License, Version 2.0 (the "License"); you may not use this file except in compliance with the License. You may obtain a copy of the License at
http://www.apache.org/licenses/LICENSE-2.0
Unless required by applicable law or agreed to in writing, software distributed under the License is distributed on an "AS IS" BASIS, WITHOUT WARRANTIES OR CONDITIONS OF ANY KIND, either express or implied. See the License for the specific language governing permissions and limitations under the License.
A copy of the license is available in the repository's license.txt file.
[](Esri Tags: Web Mapping ArcGIS Leaflet esri-leaflet Cluster Basemaps) [](Esri Language: JavaScript)
