-
Login/Sign Up for IBM Cloud: https://ibm.biz/EasyModels
-
Hands-On Guide: https://ibm.biz/EasyModels-Workshop
-
Workshop Replay: https://www.crowdcast.io/e/build-a-predictive-2
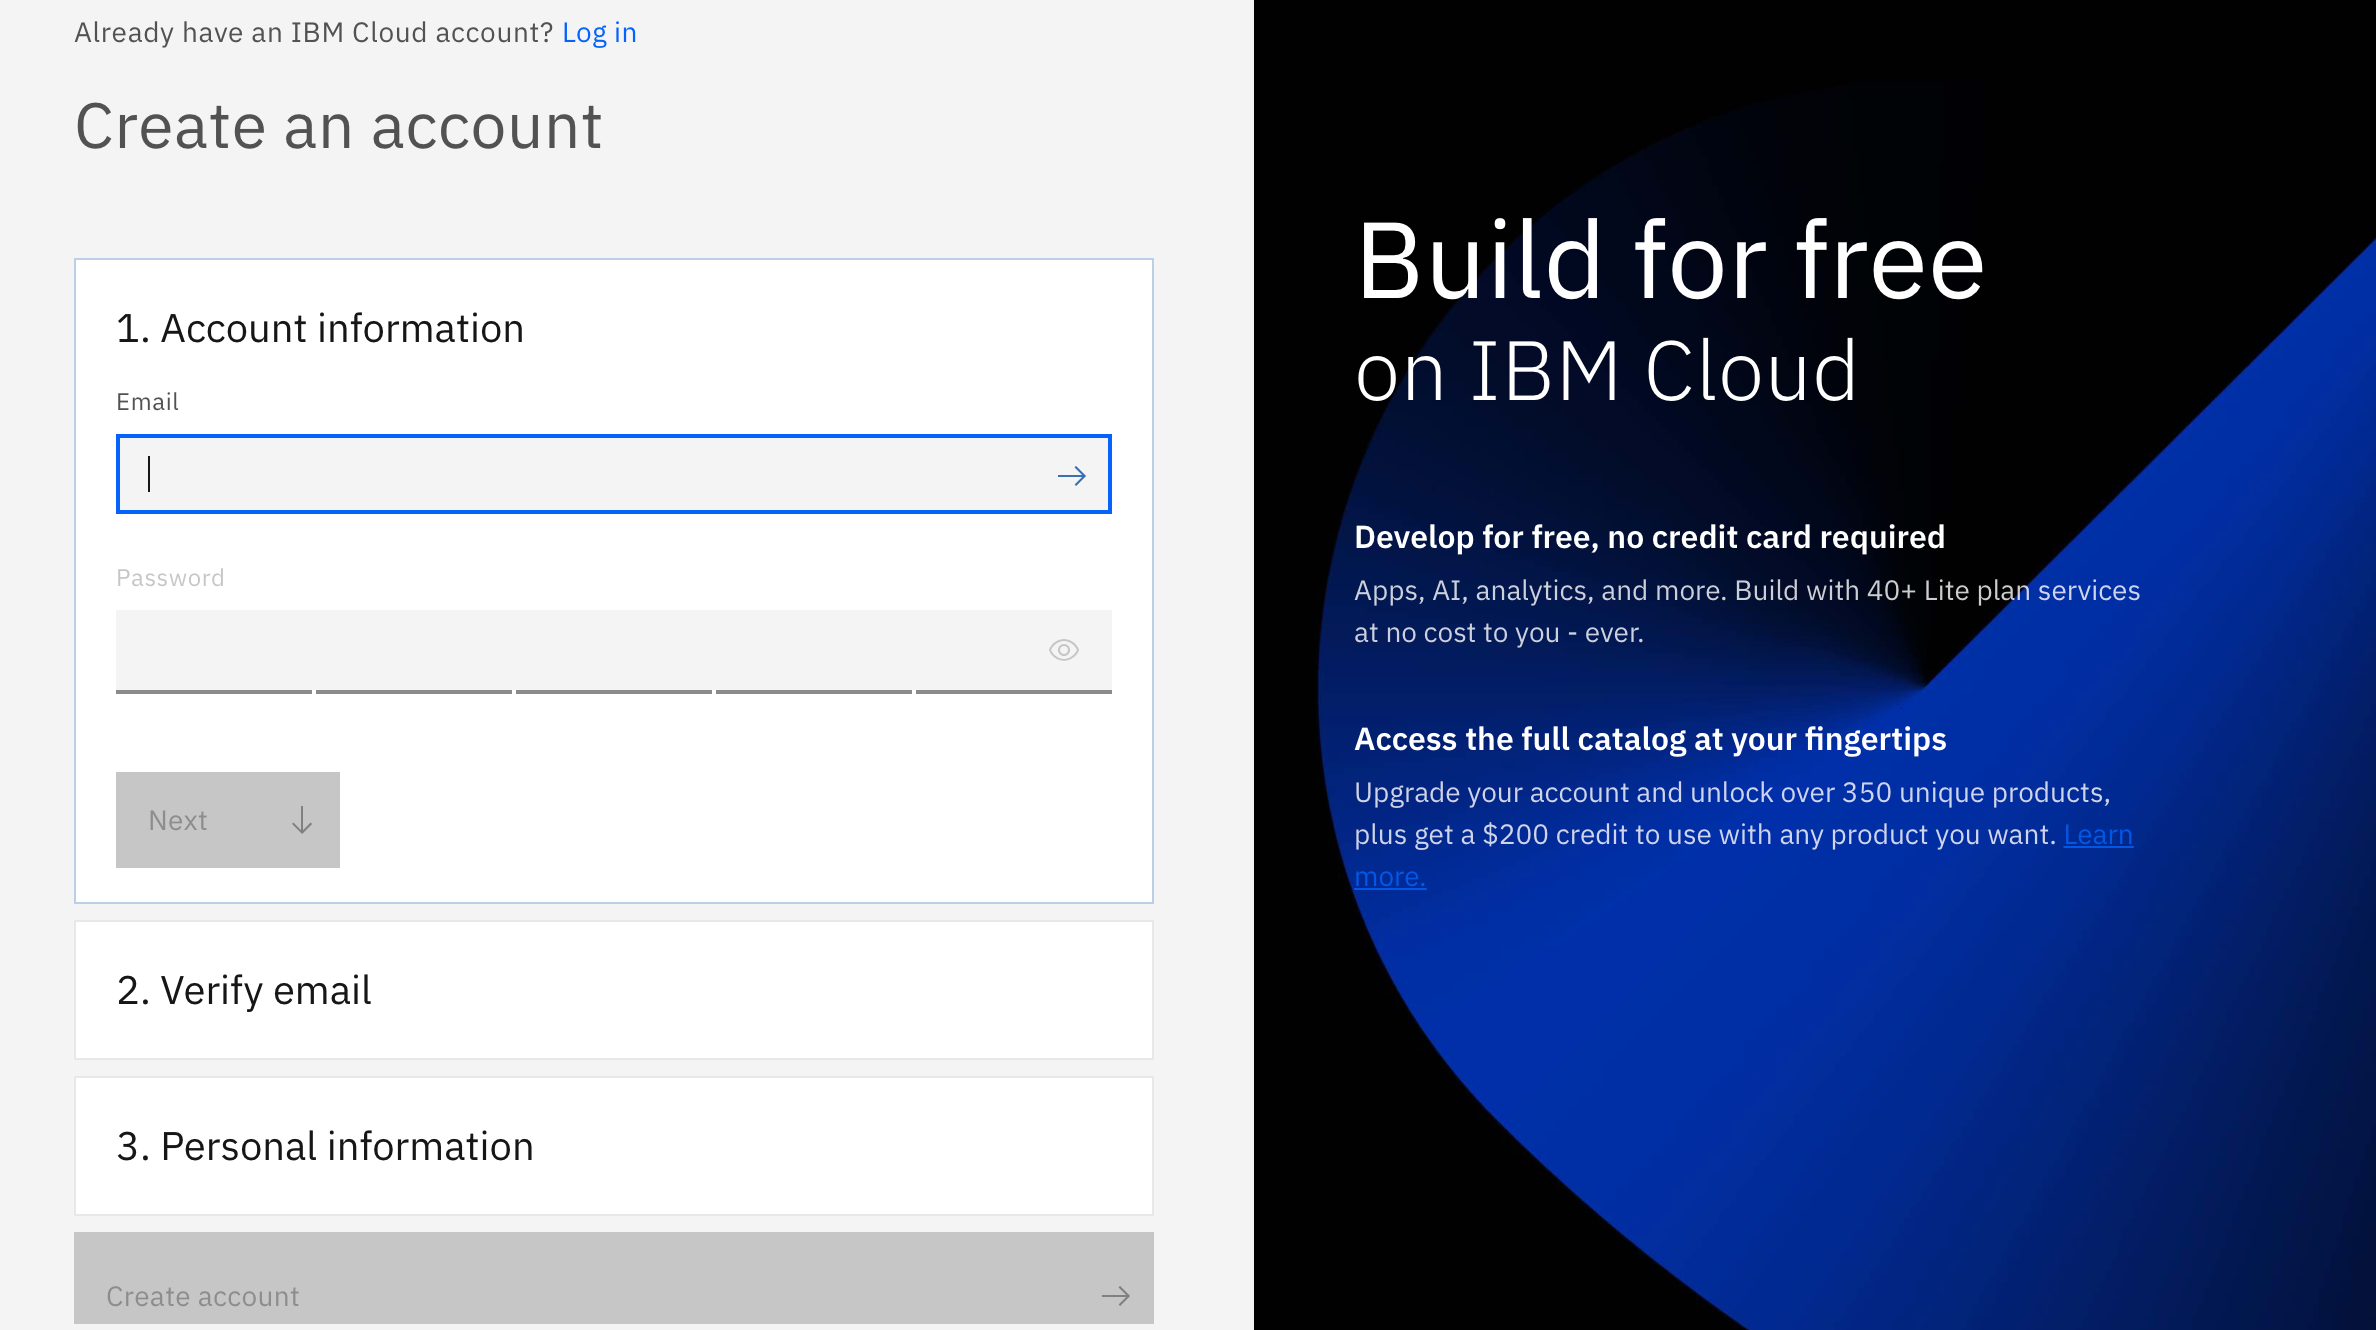
There are 3 steps to create your account on IBM Cloud:
-
Put your email and password.
-
You get a verification link with the registered email to verify your account.
-
Fill the personal information fields.
In this tutorial, we will use Watson Studio to build a predictive machine learning model with IBM SPSS Modeler and decide whether a bank customer will default on a loan. IBM Cloud Pak® for Data is an interactive, collaborative, cloud-based environment that allows developers and data scientists to work collaboratively, gain insight from data and build machine learning models.
After completing this tutorial, you will learn how to:
- Upload data to Watson Studio
- Create an SPSS® Modeler flow.
- Use the SPSS tool to inspect data and glean insights.
- Modify and prepare data for AI model creation using SPSS.
- Train a machine learning model with SPSS and evaluate the results.
- Login/Sign Up for IBM Cloud: https://ibm.biz/EasyModels
Completing this tutorial should take about 30 minutes.
- Create a project and upload the data
- Create an SPSS Modeler Flow
- Import the data
- Inspect the data
- Data preparation
- Train the ML model
- Evaluate the results
If you have not already created a project for this learning path, follow the instructions below to create one. Otherwise, you can skip to Create an SPSS Modeler Flow.
In Cloud Pak for Data, we use the concept of a project to collect / organize the resources used to achieve a particular goal (resources to build a solution to a problem). Your project resources can include data, collaborators, and analytic assets like notebooks and models, etc.
-
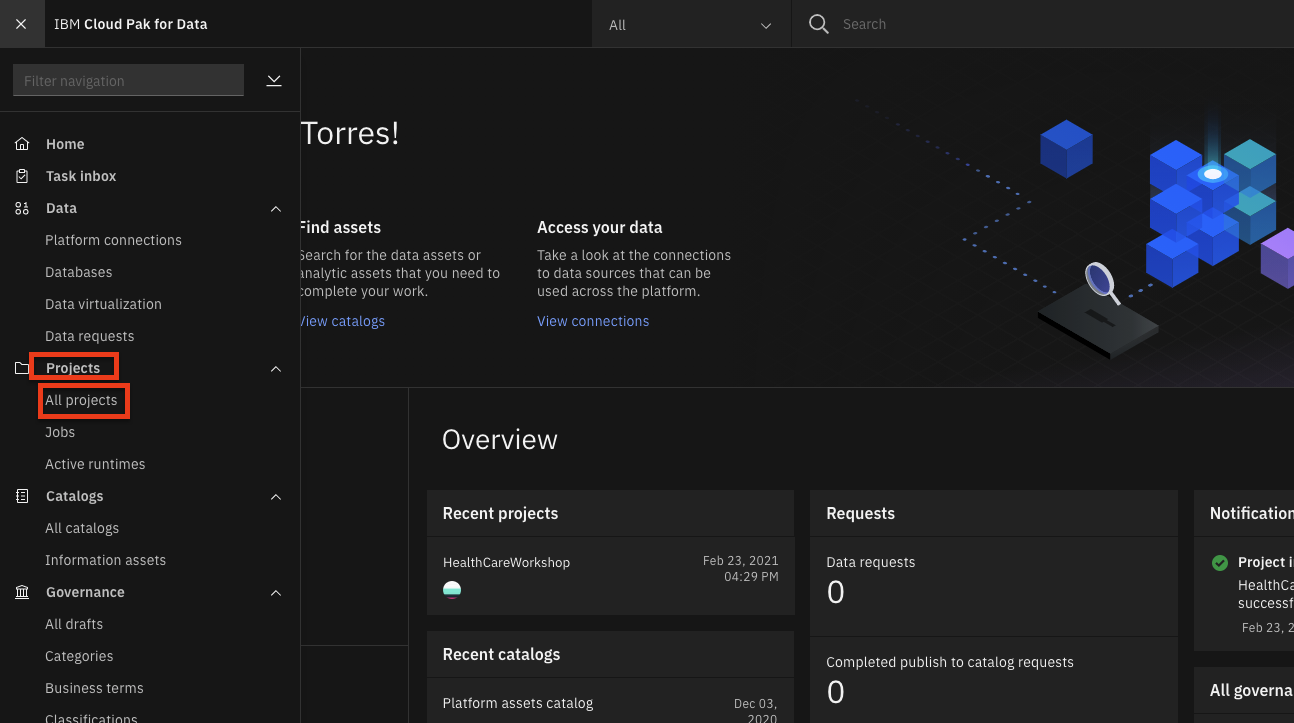
Go the (☰) navigation menu and under the Projects section click on
All Projects. -
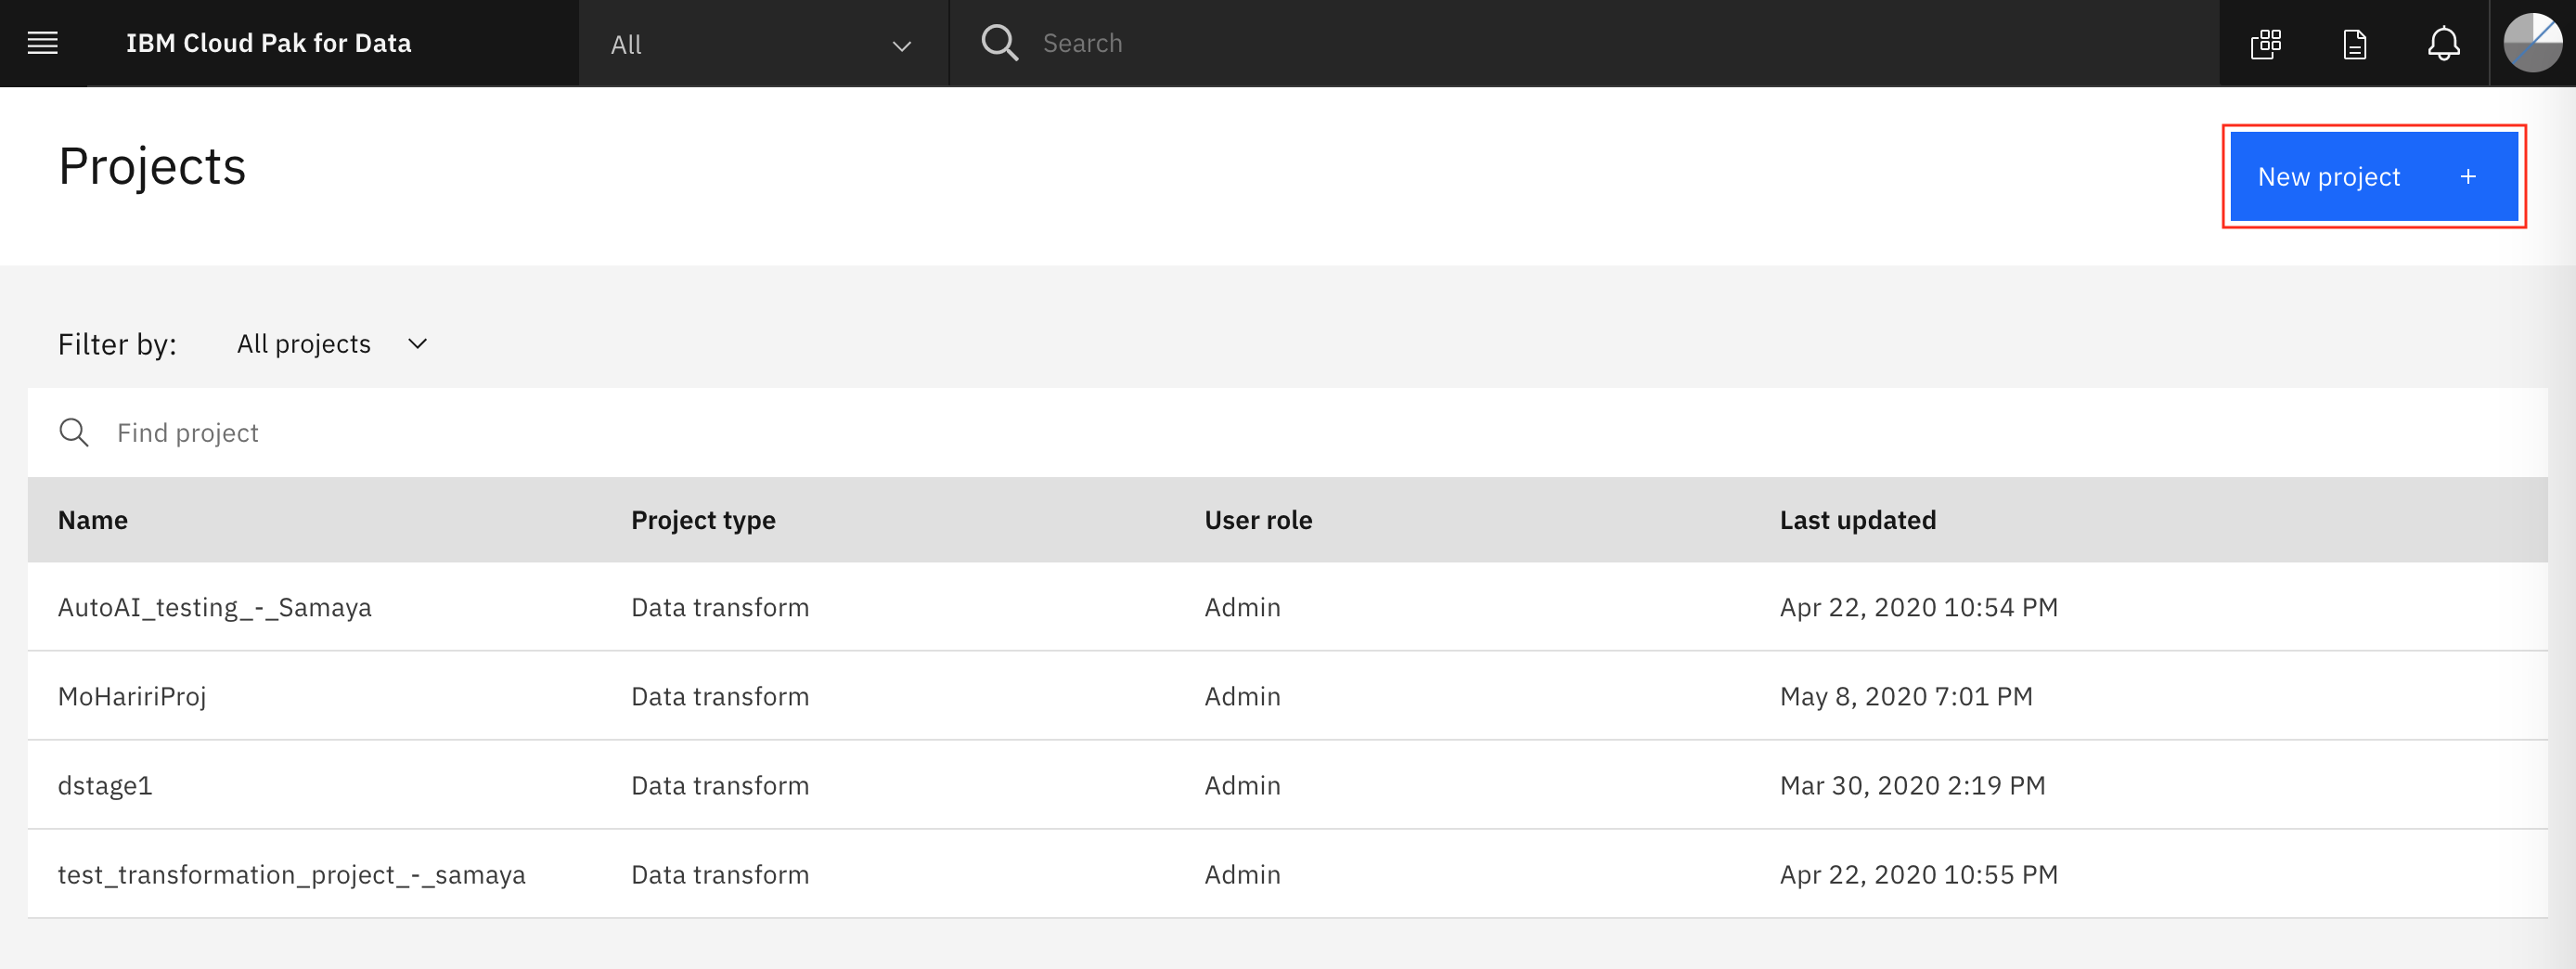
Click on the
New projectbutton on the top right. -
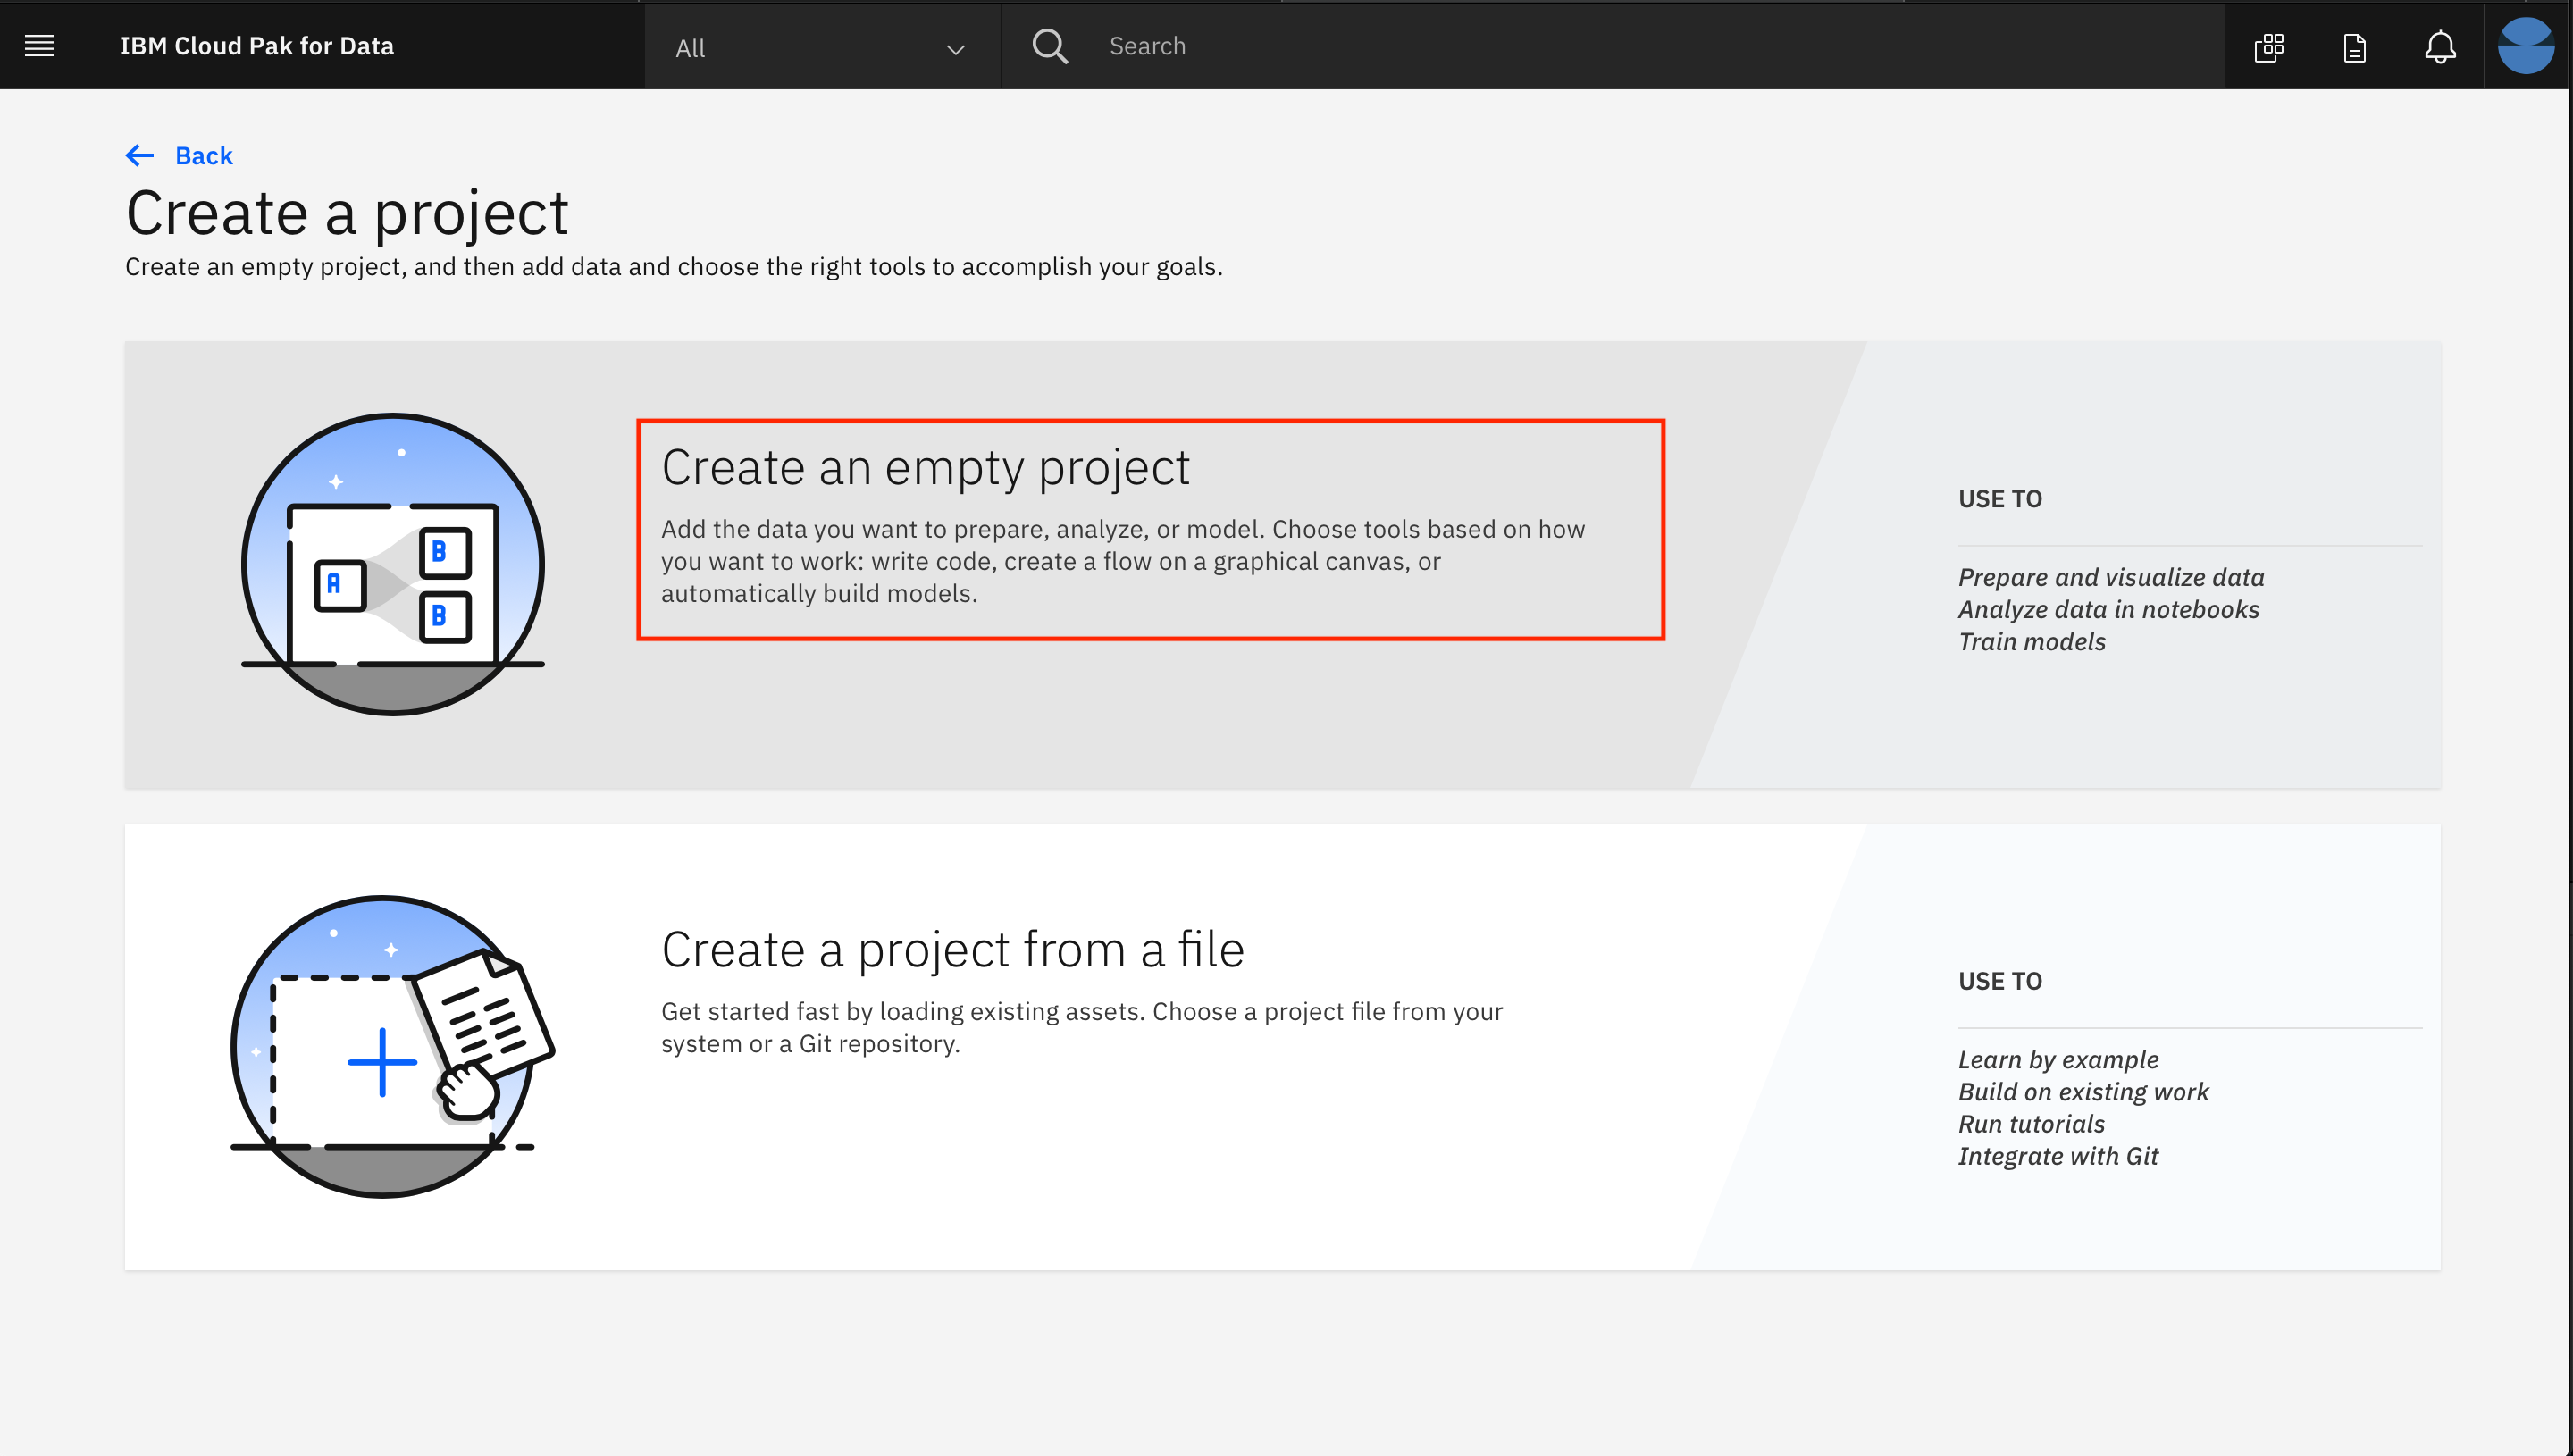
Select
Create an empty project. -
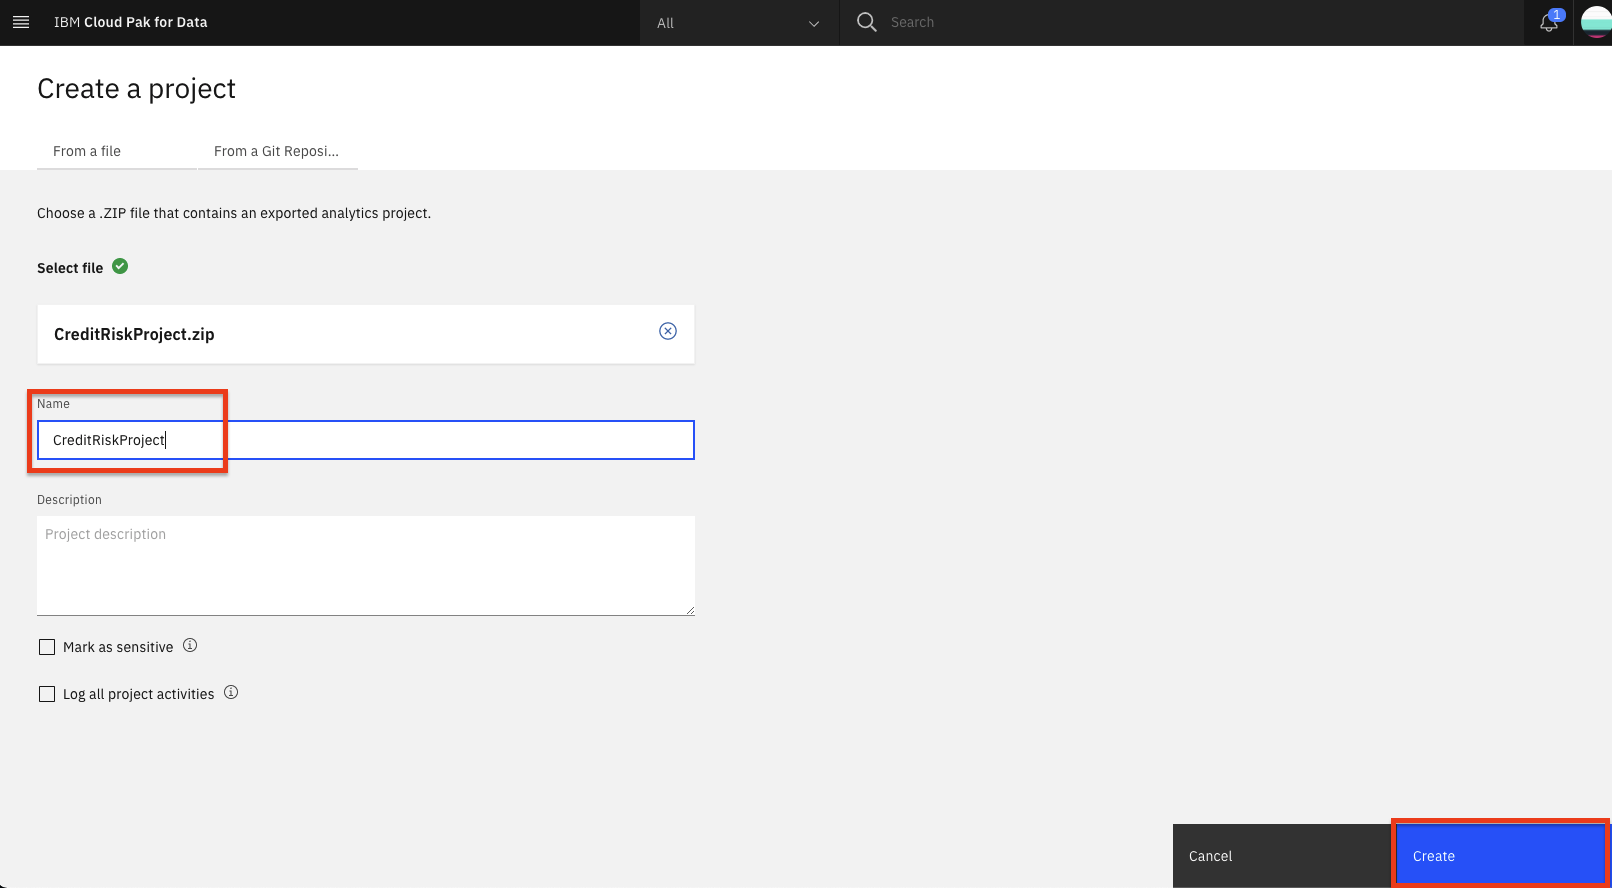
Provide a name and optional description for the project and click
Create.
-
Download the german_credit_data.csv dataset.
-
Upload the dataset to the analytics project by clicking on Browse and selecting the downloaded file.
-
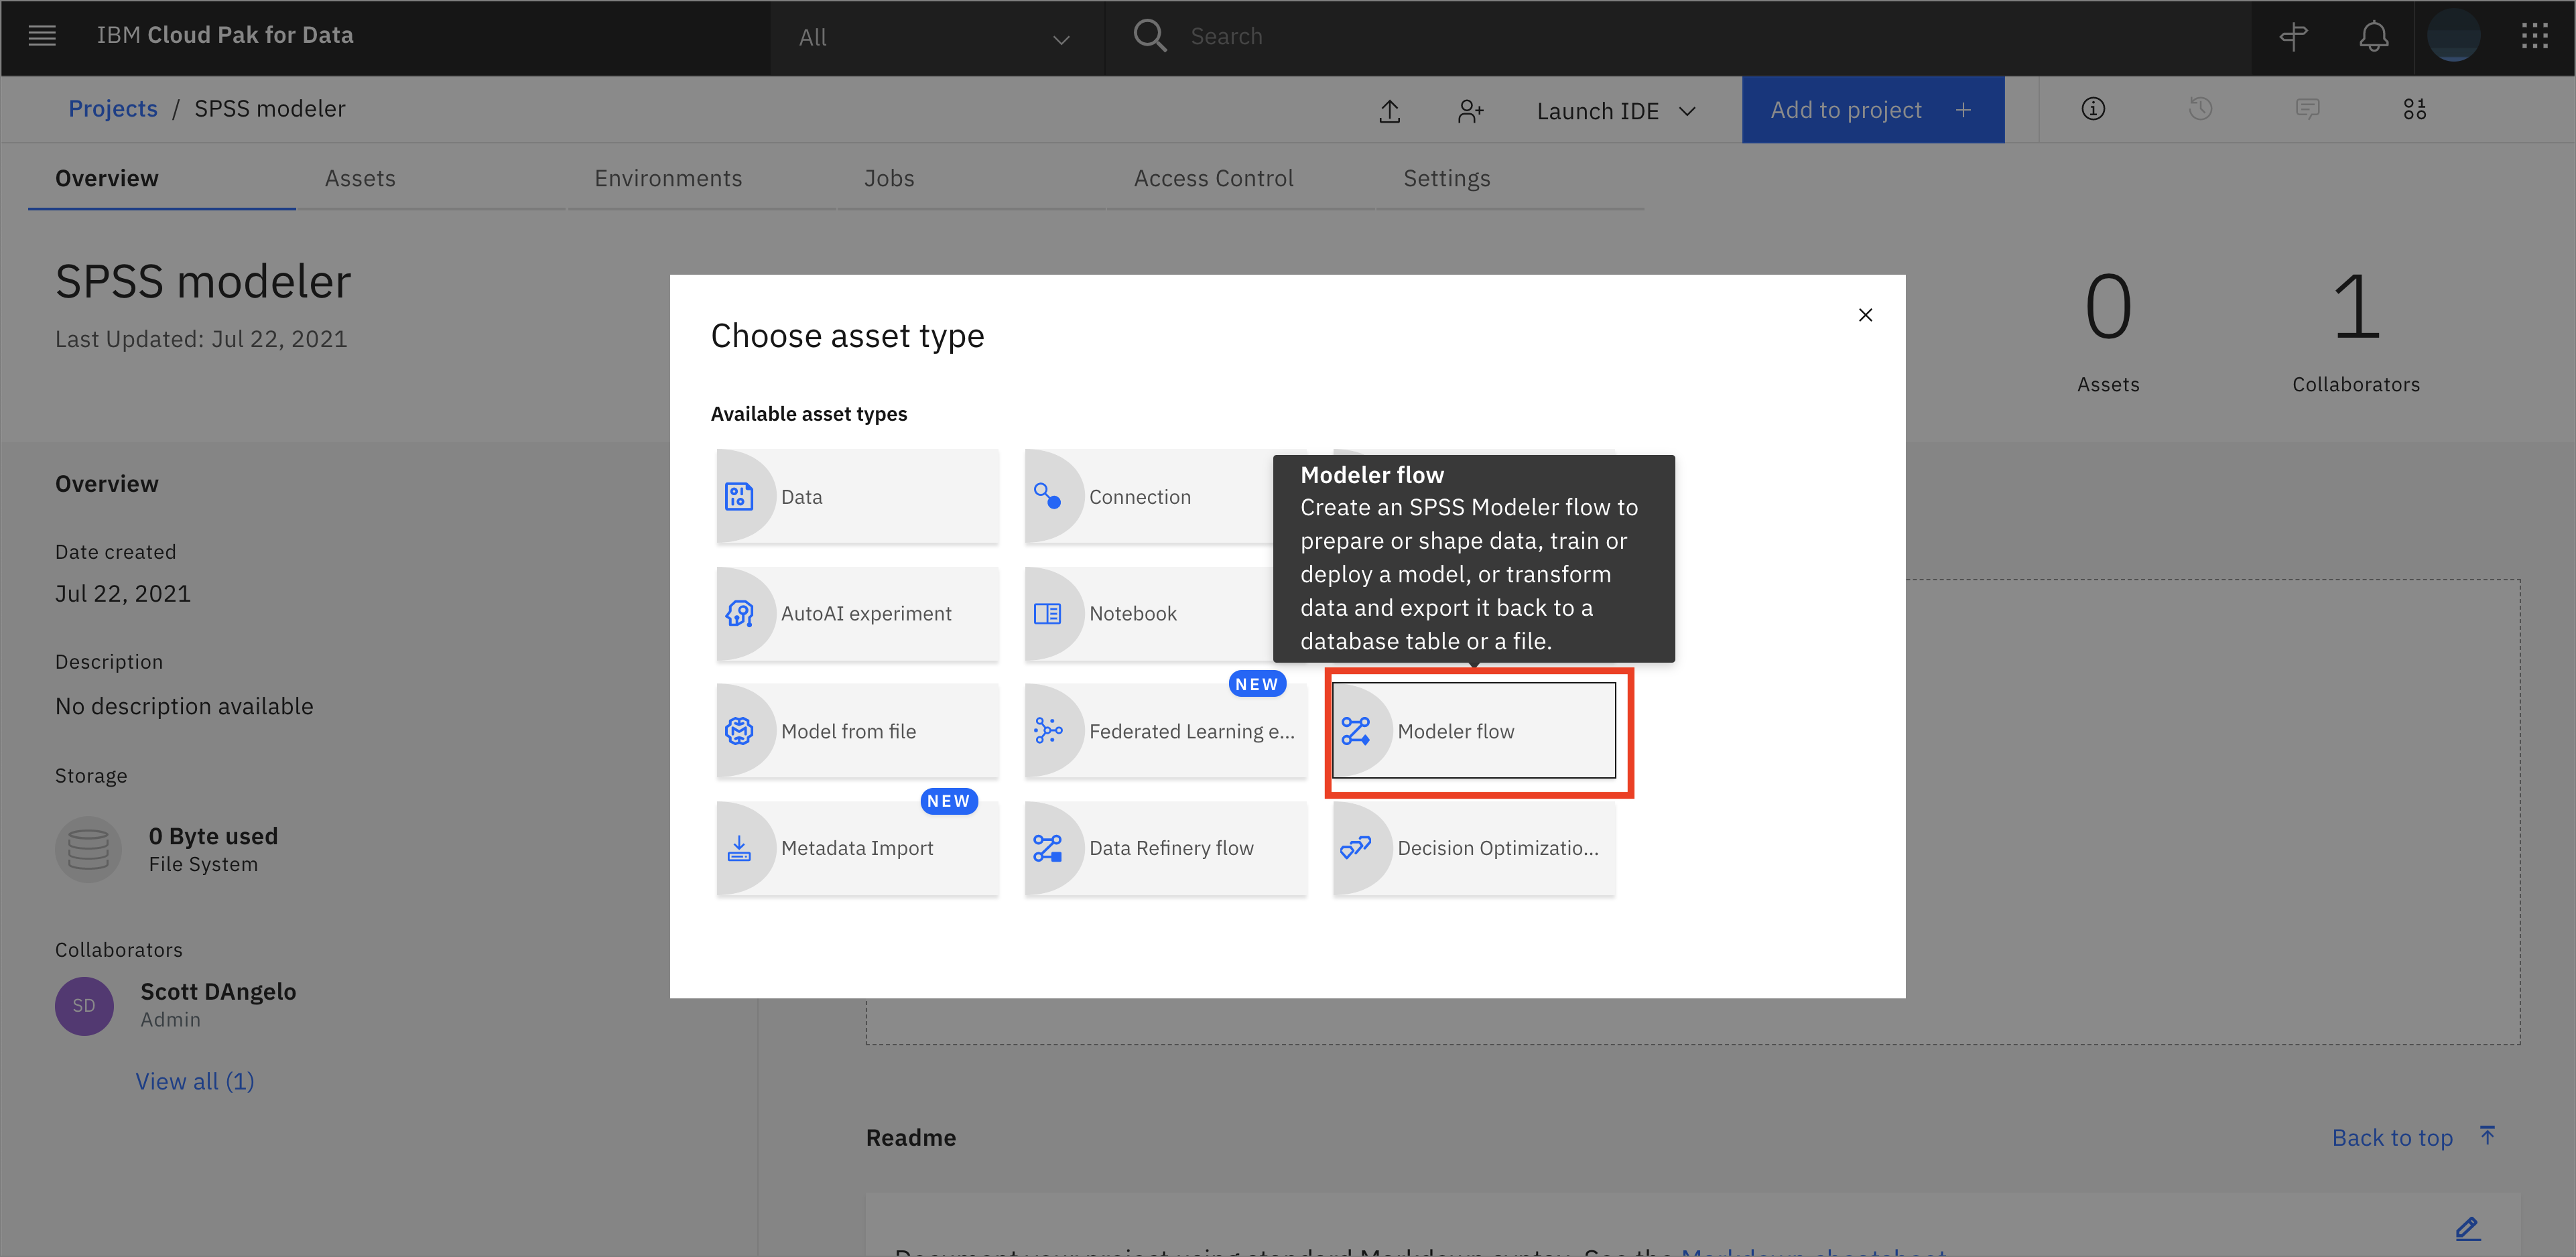
From the Project home page, click Add to Project + and choose Modeler flow.
-
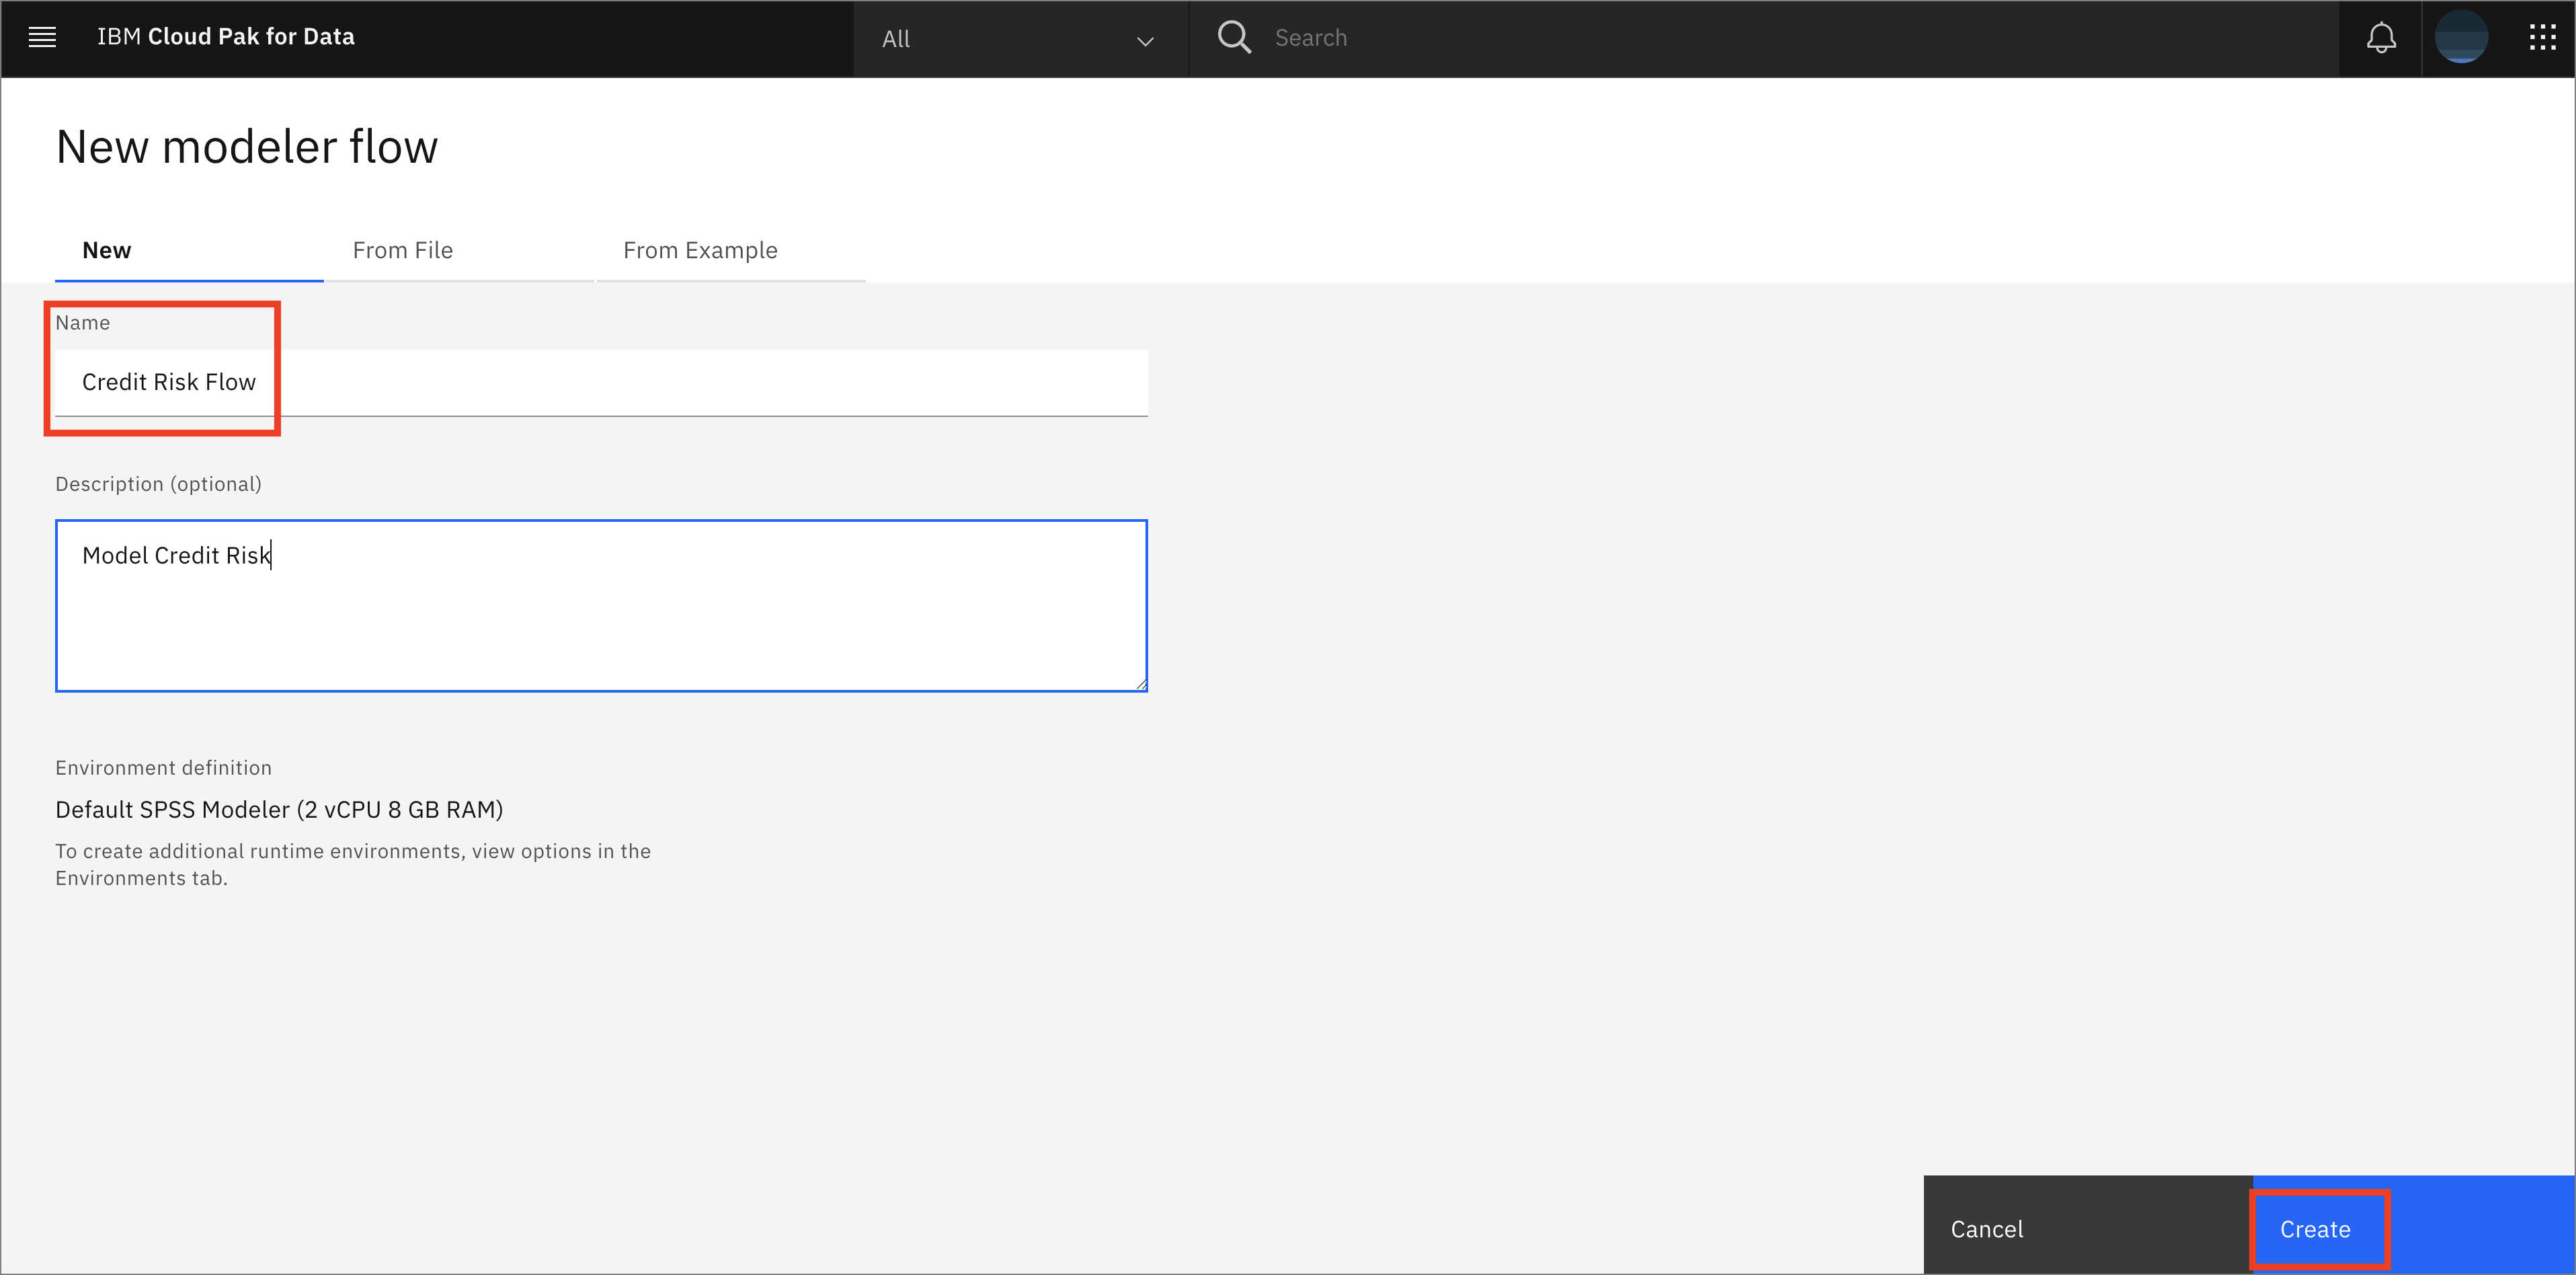
Give the flow a meaningful name, such as
Credit Risk Flow, then click Create.
-
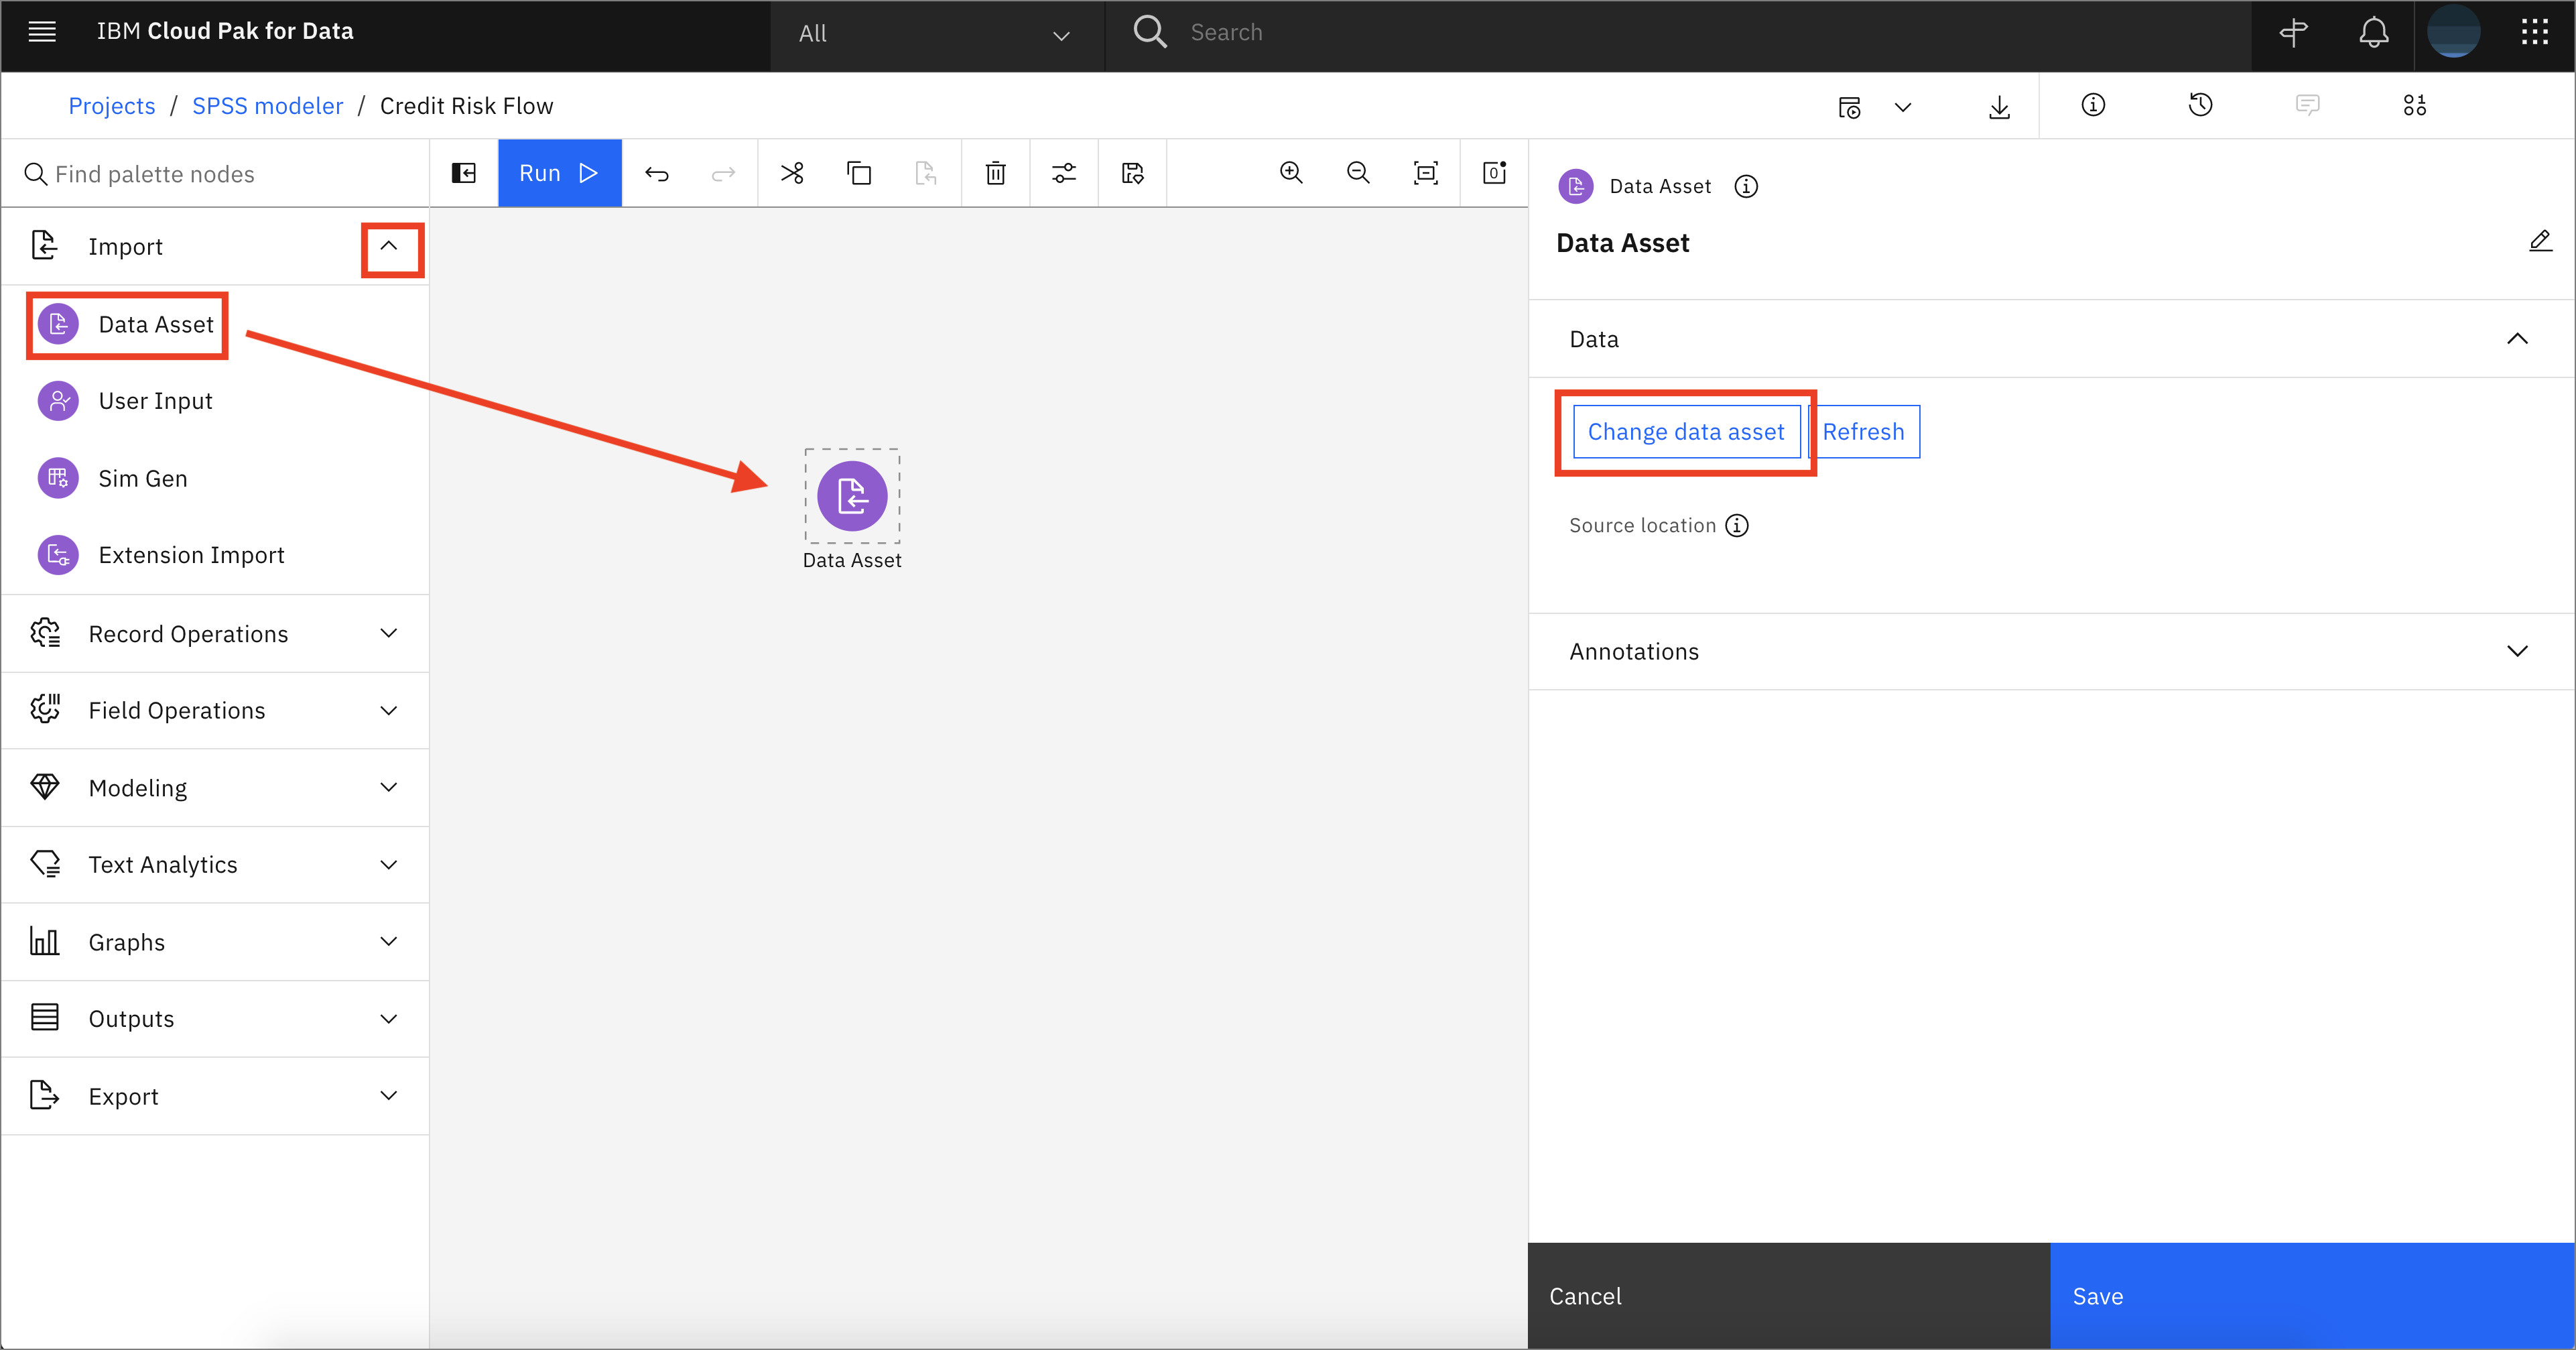
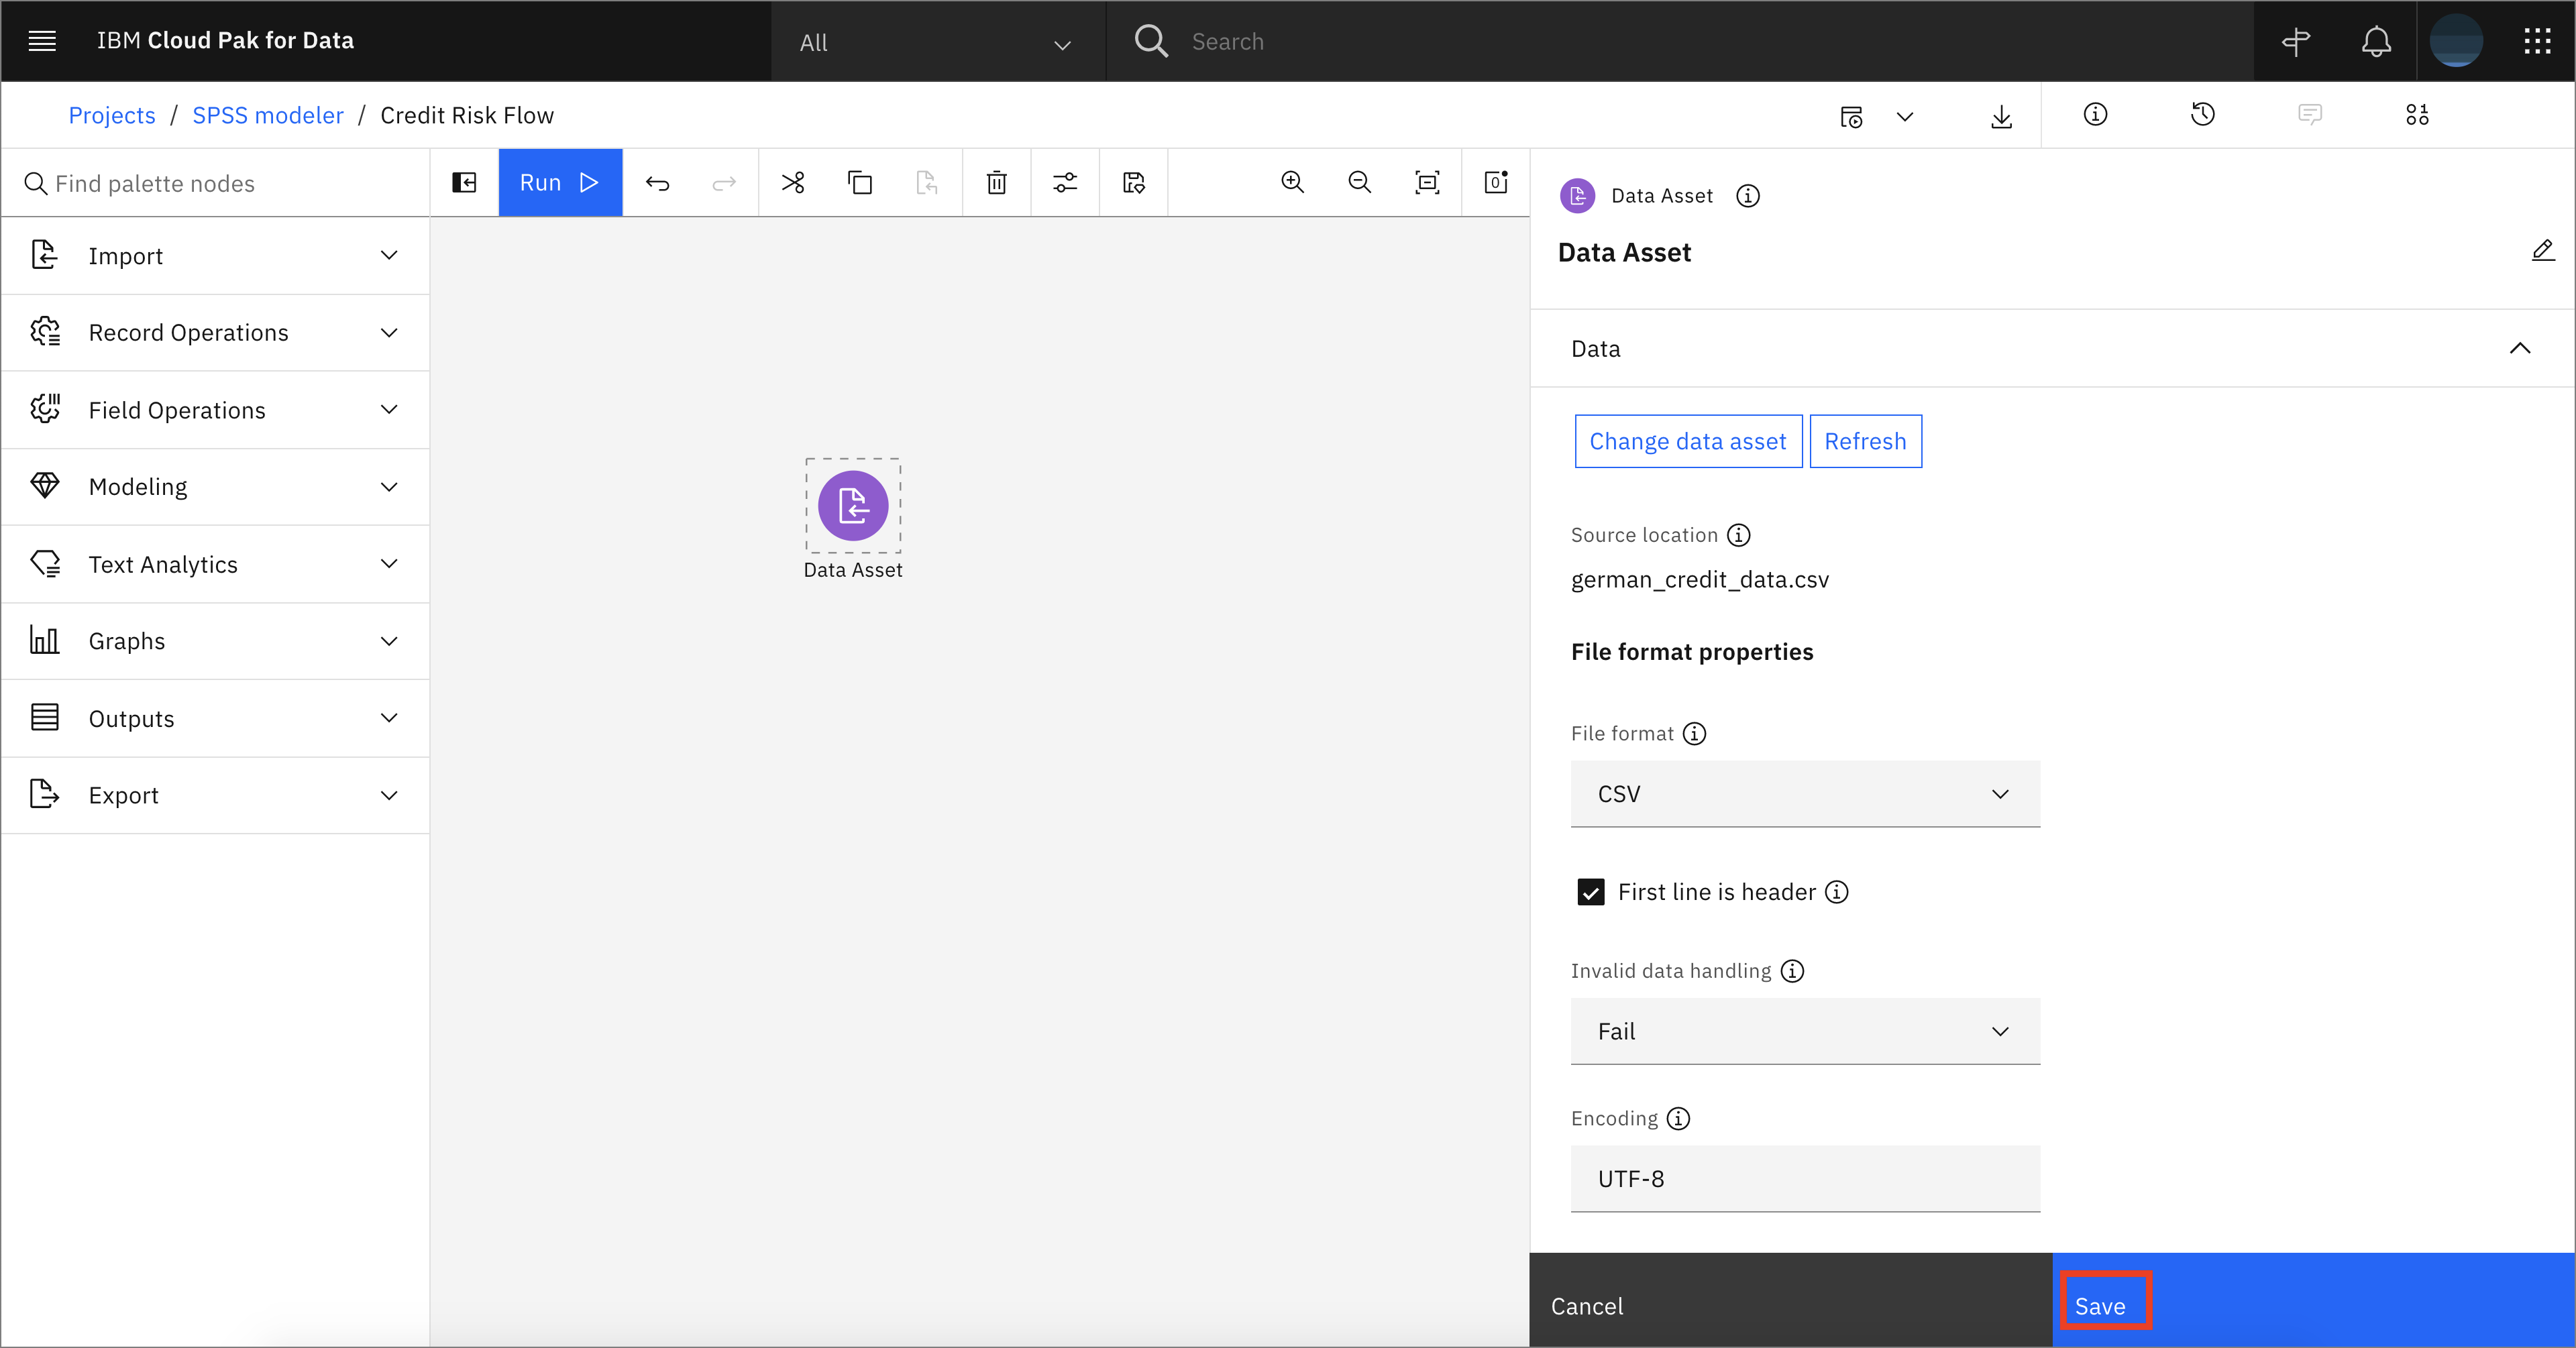
In the left-hand pane, expand Import, then drag and drop a Data Asset node on the canvas. Double-click on the node that was dropped on the canvas and click Change data asset.
-
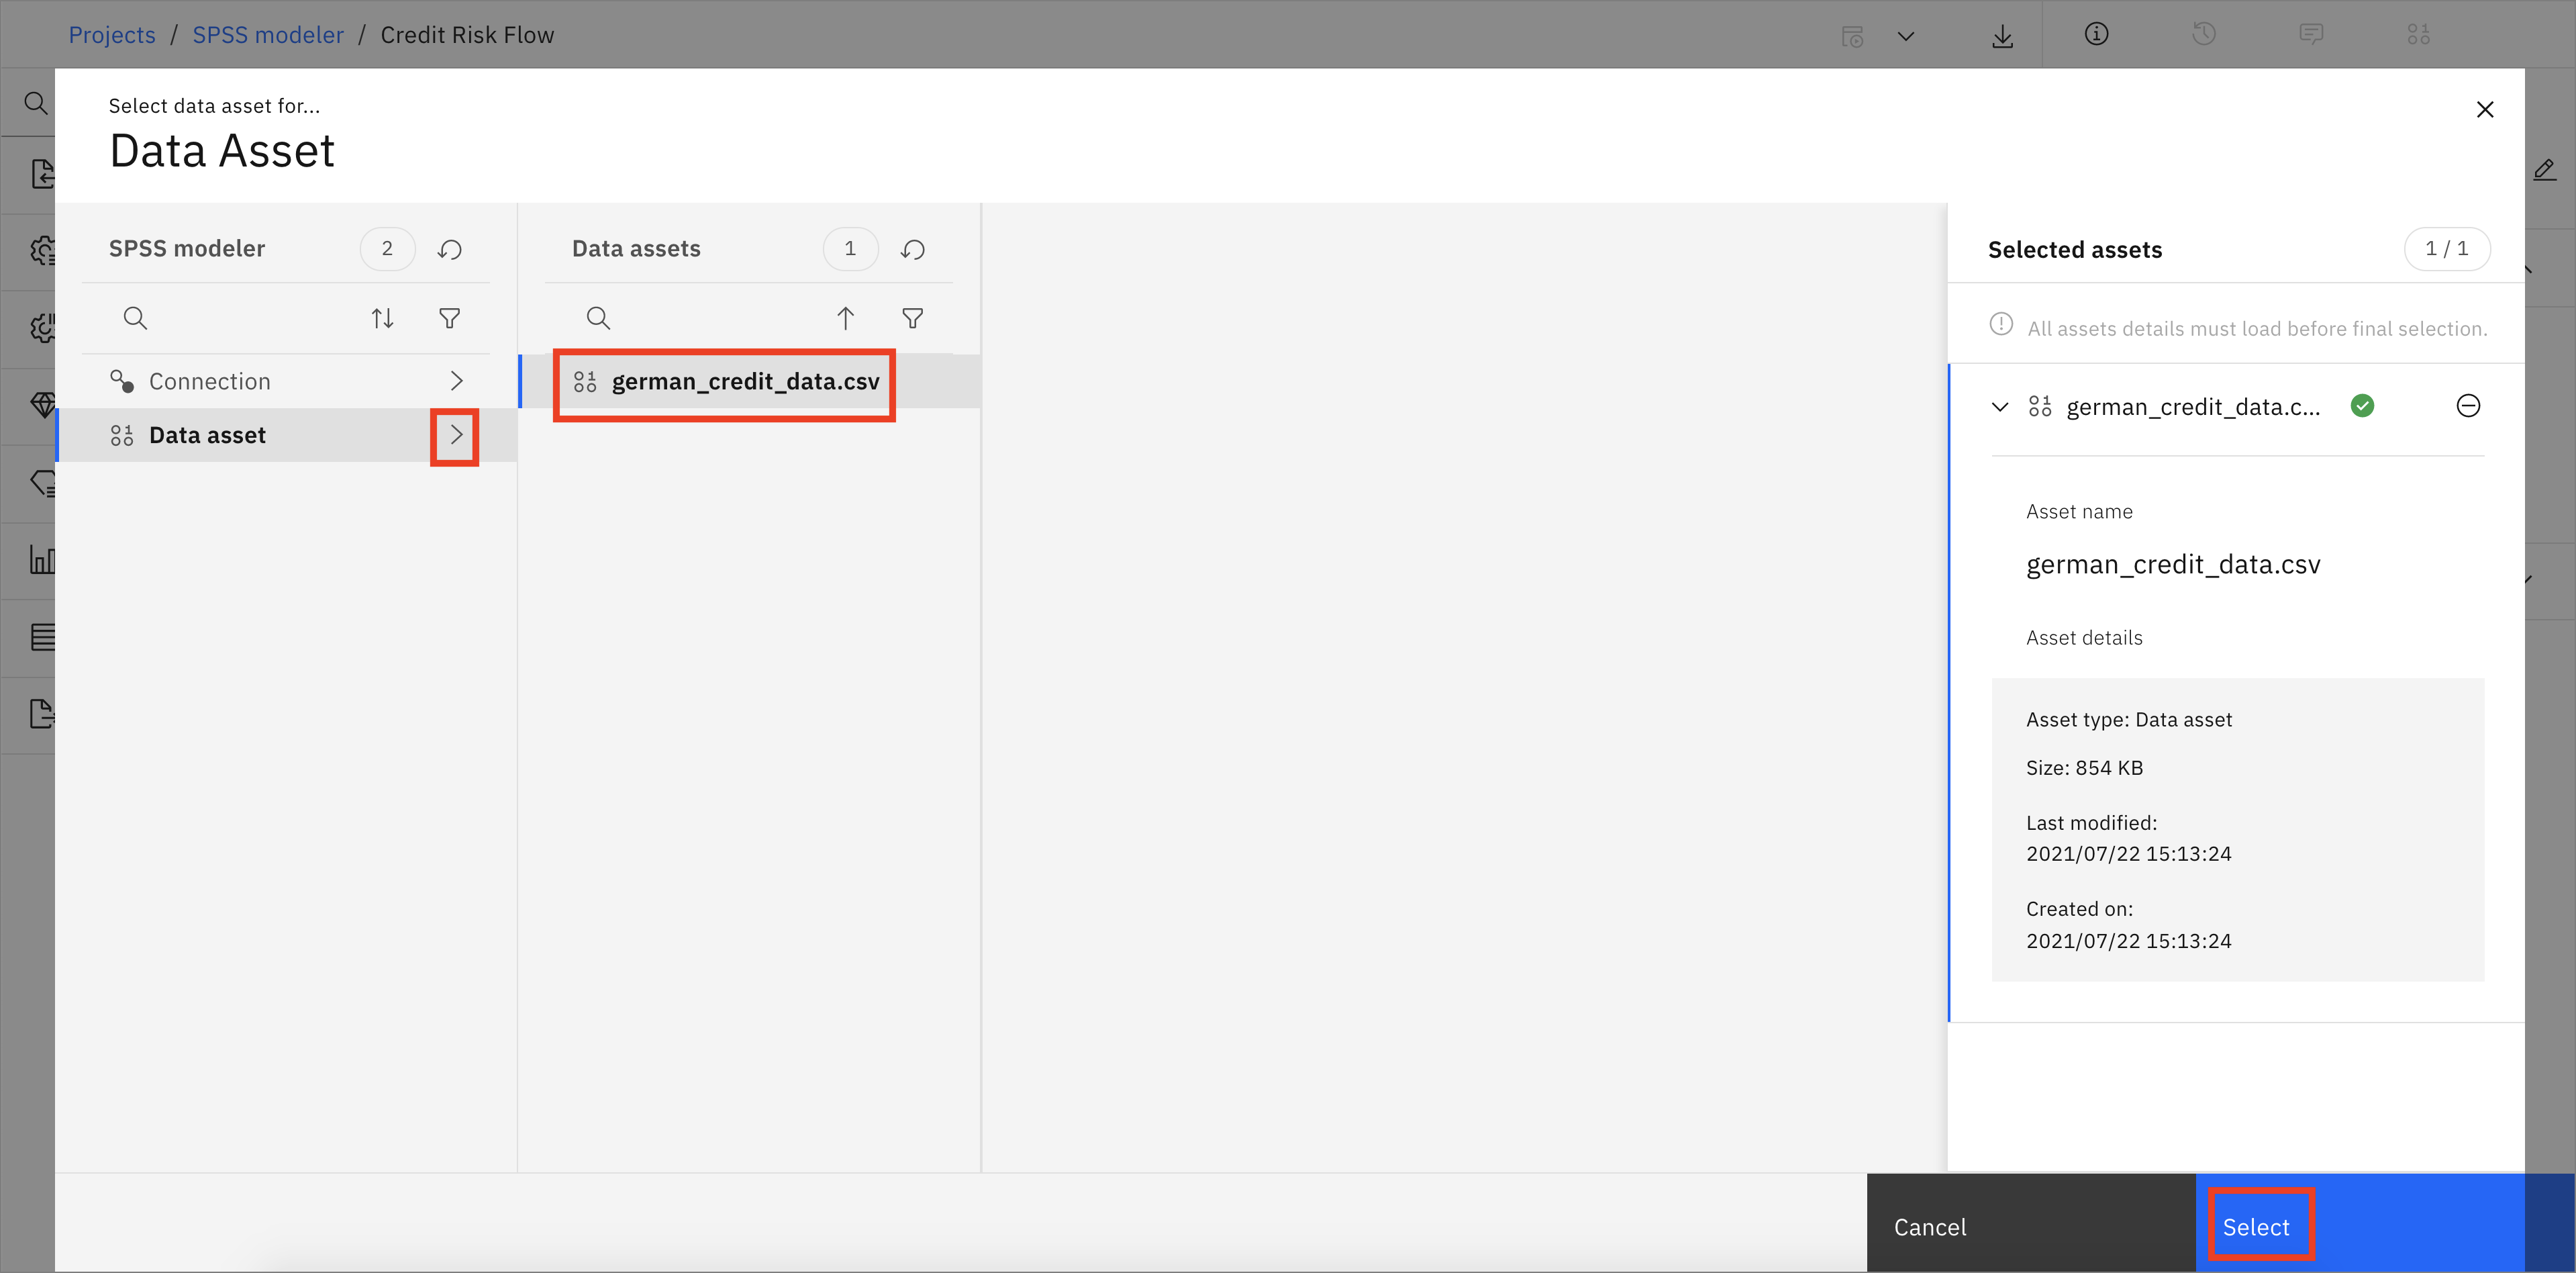
On the Assets page, open the Data Assets tab, choose the german_credit_data.csv file you previously uploaded and click Select.
-
When the data is imported, click Save.
-
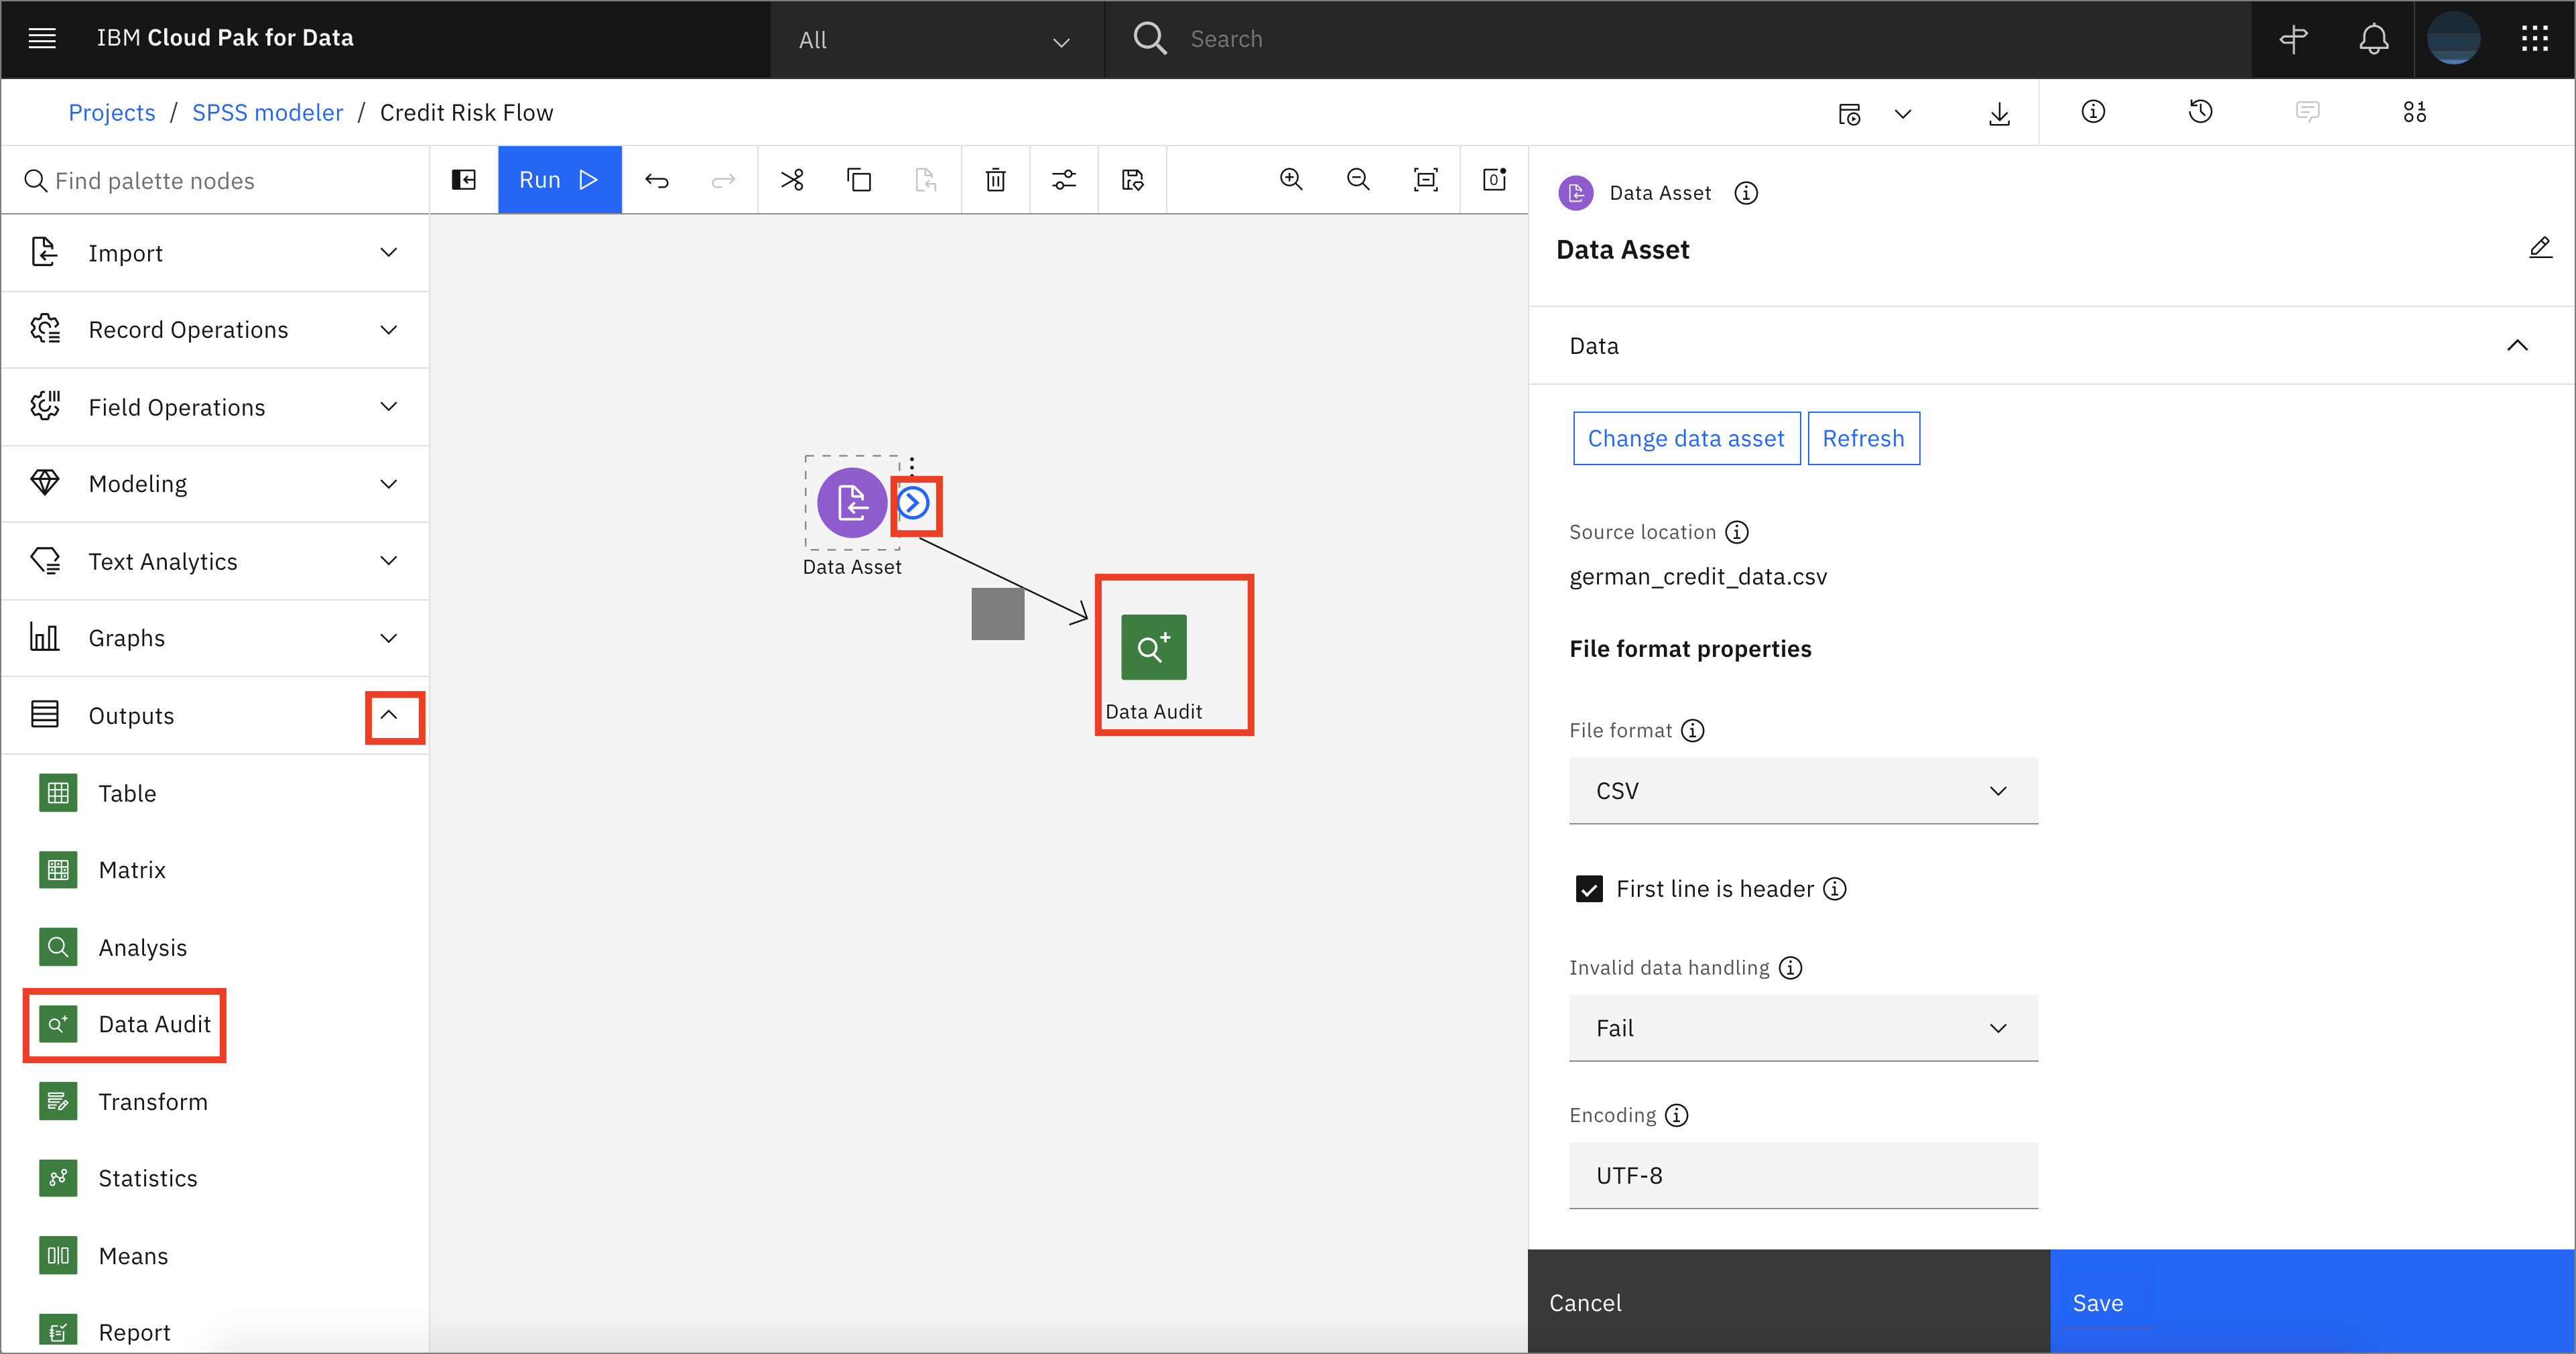
To gain insight into your data, open the Output tab and drag and drop the data audit node onto the canvas. Hover over the Data Asset node that was dragged and dropped on the canvas earlier, and it should show a blue circular icon on the side. Click on the icon and drag over to the Data Audit node. This will connect the two nodes.
-
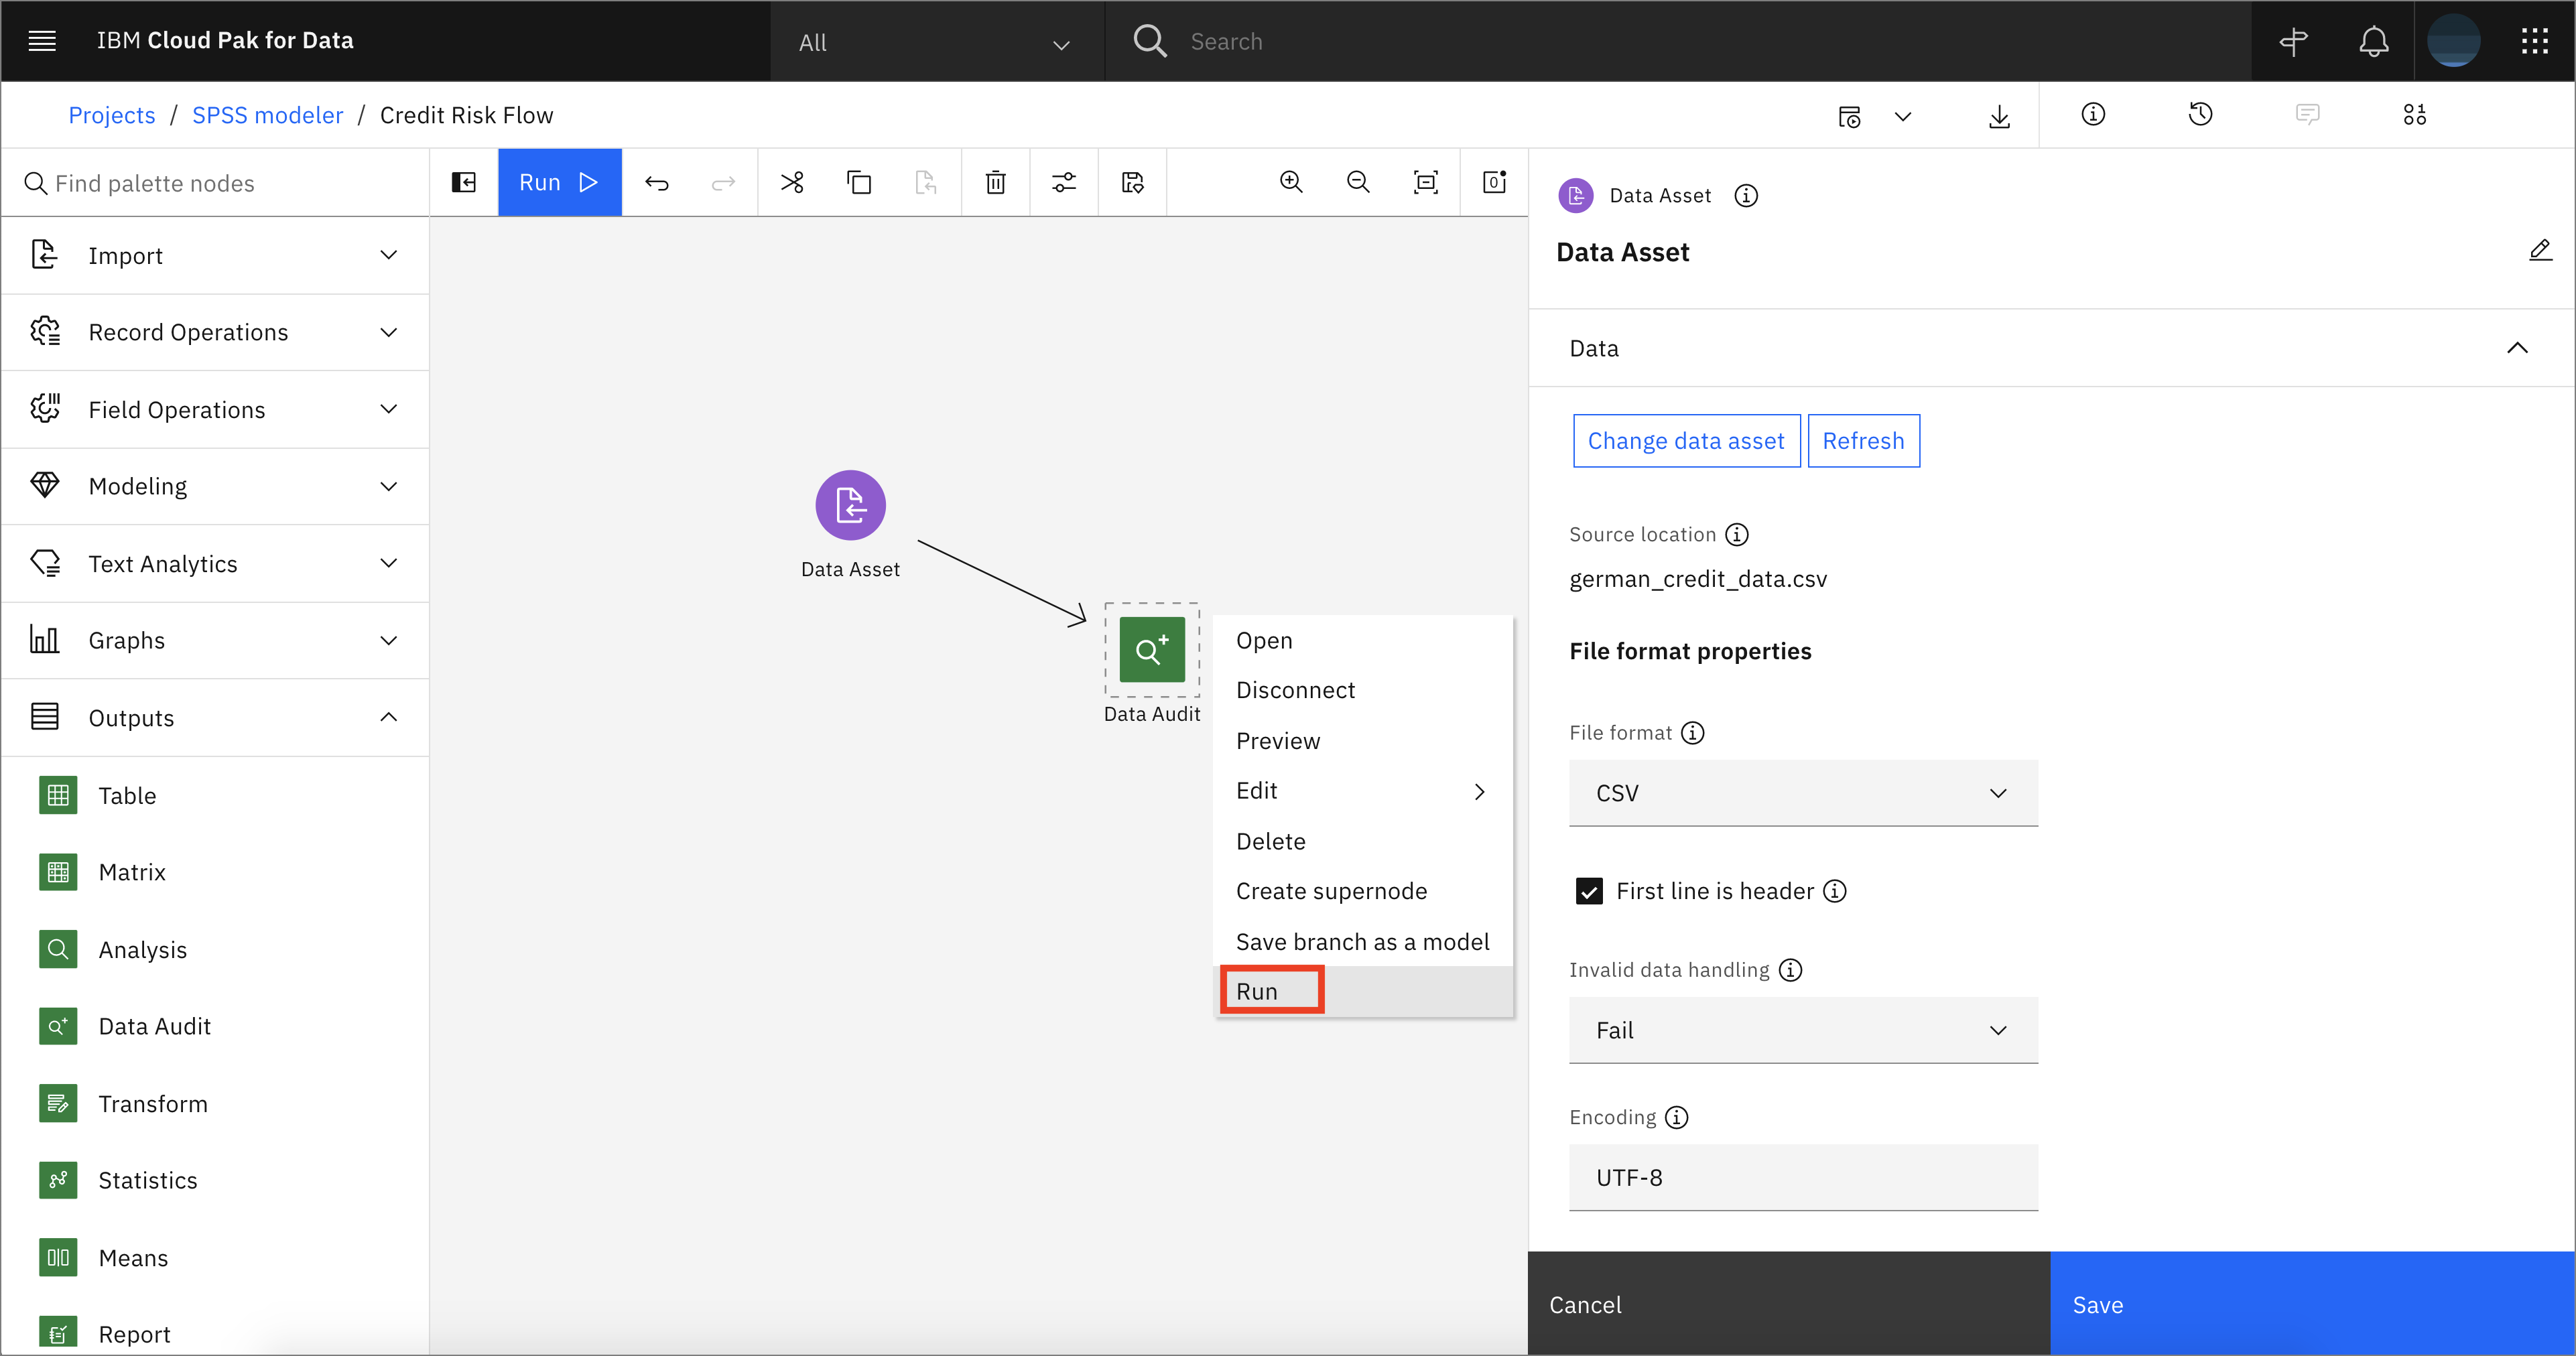
Hover over the Data Audit node and click on the three vertical dots to open the menu for the node. Alternatively, right-click on the Data Audit node and click Run.
-
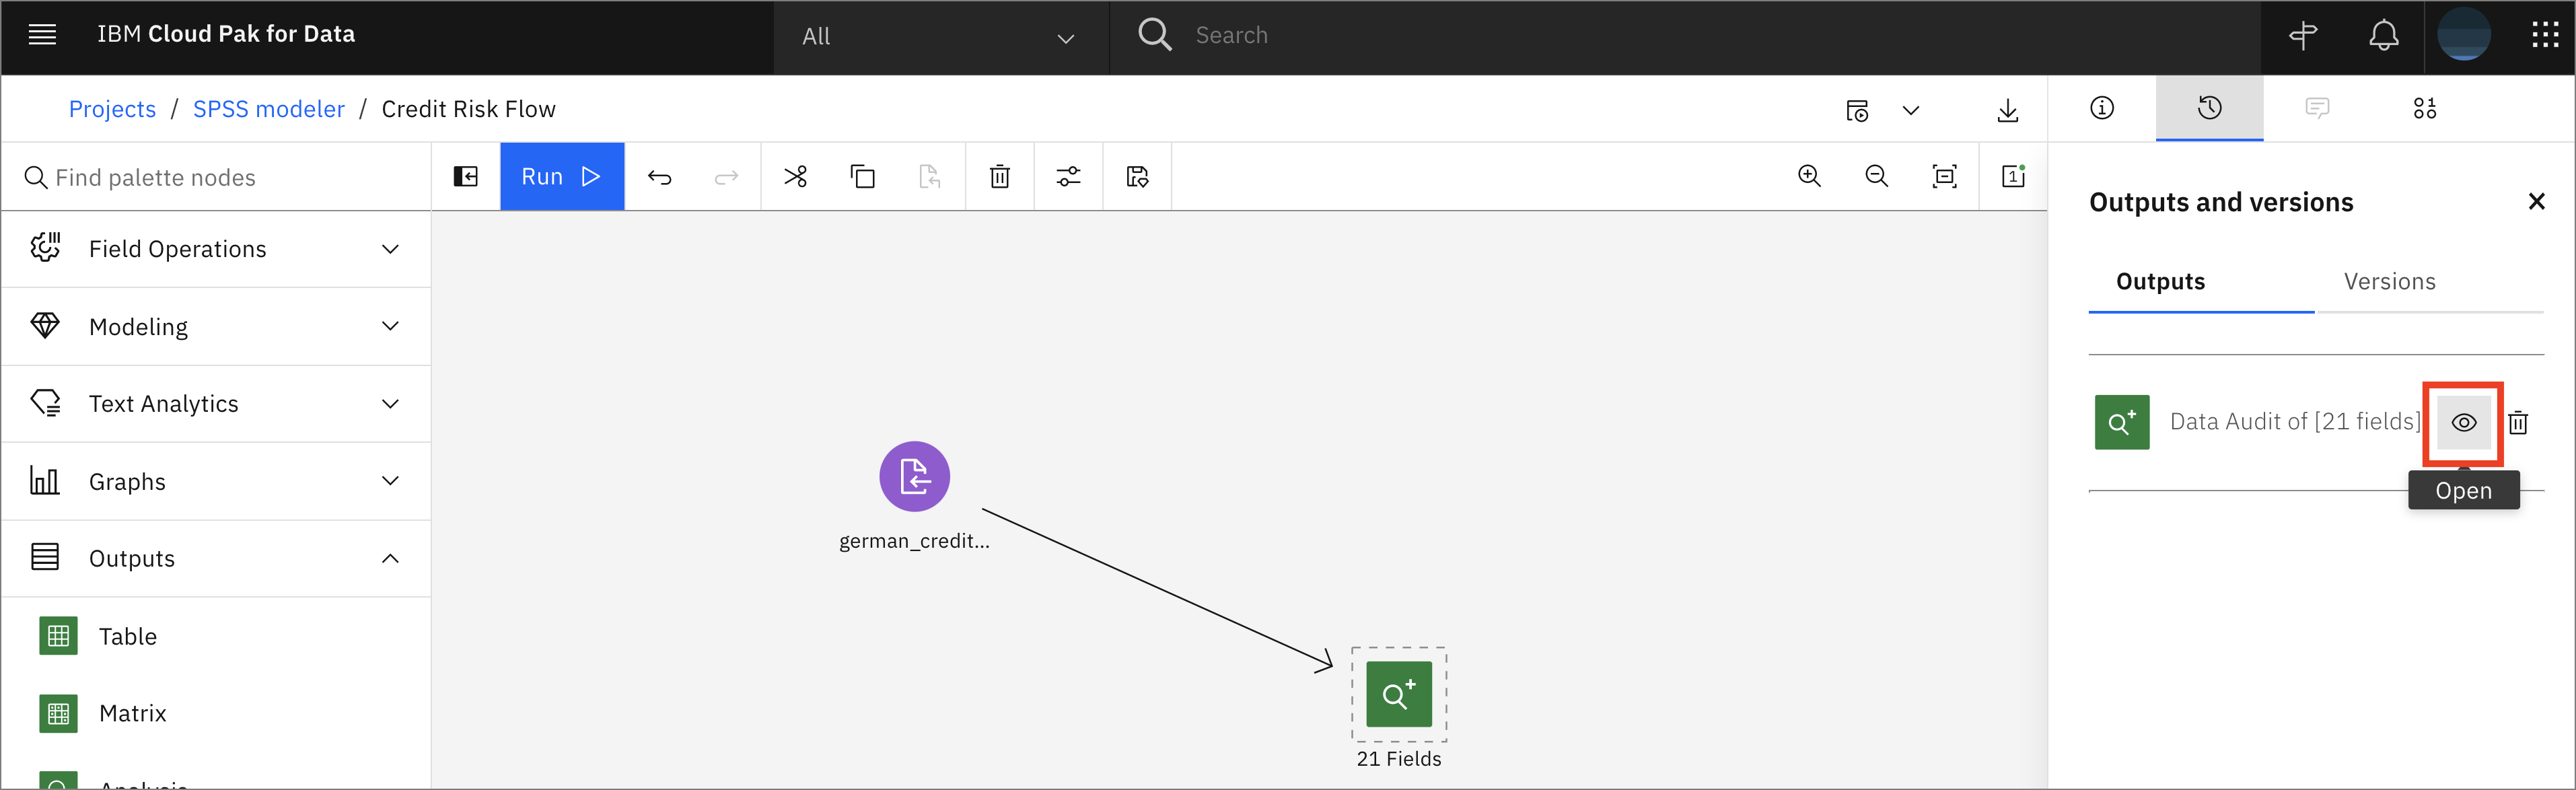
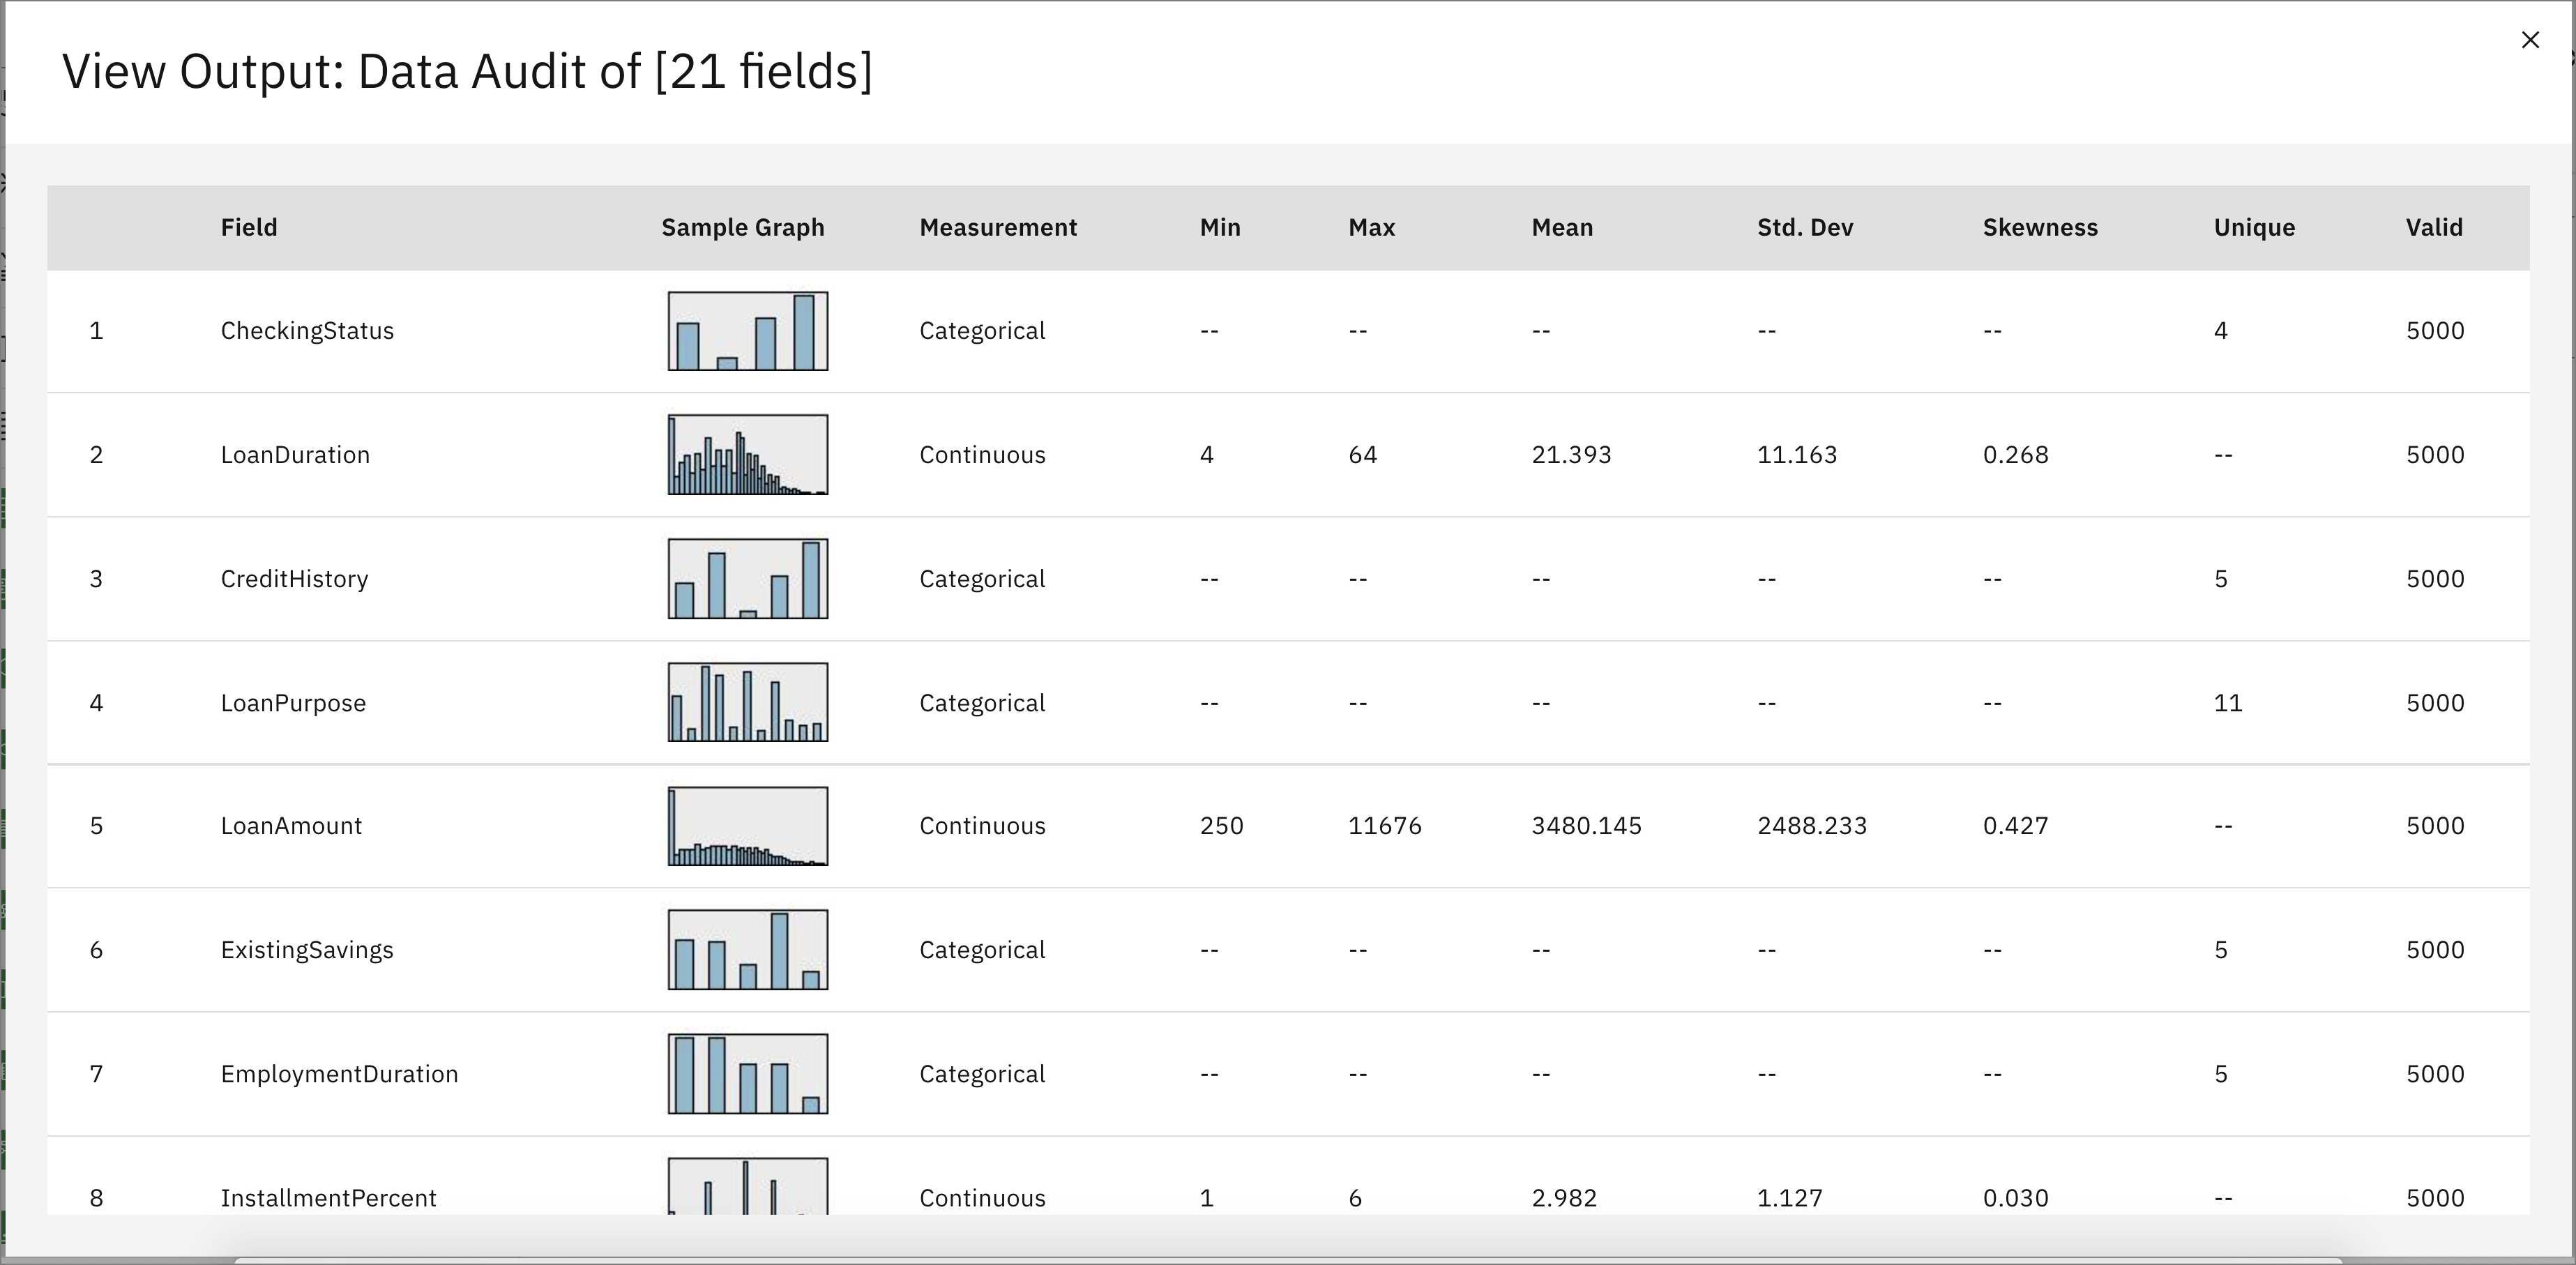
Once it is ready, the output can be viewed by opening the Outputs menu on the right. Click on the "eye" icon to open the Data Audit (Data Audit of [21 fields]) to view statistics about the data.
-
Click X in the upper right corner to close the window.
-
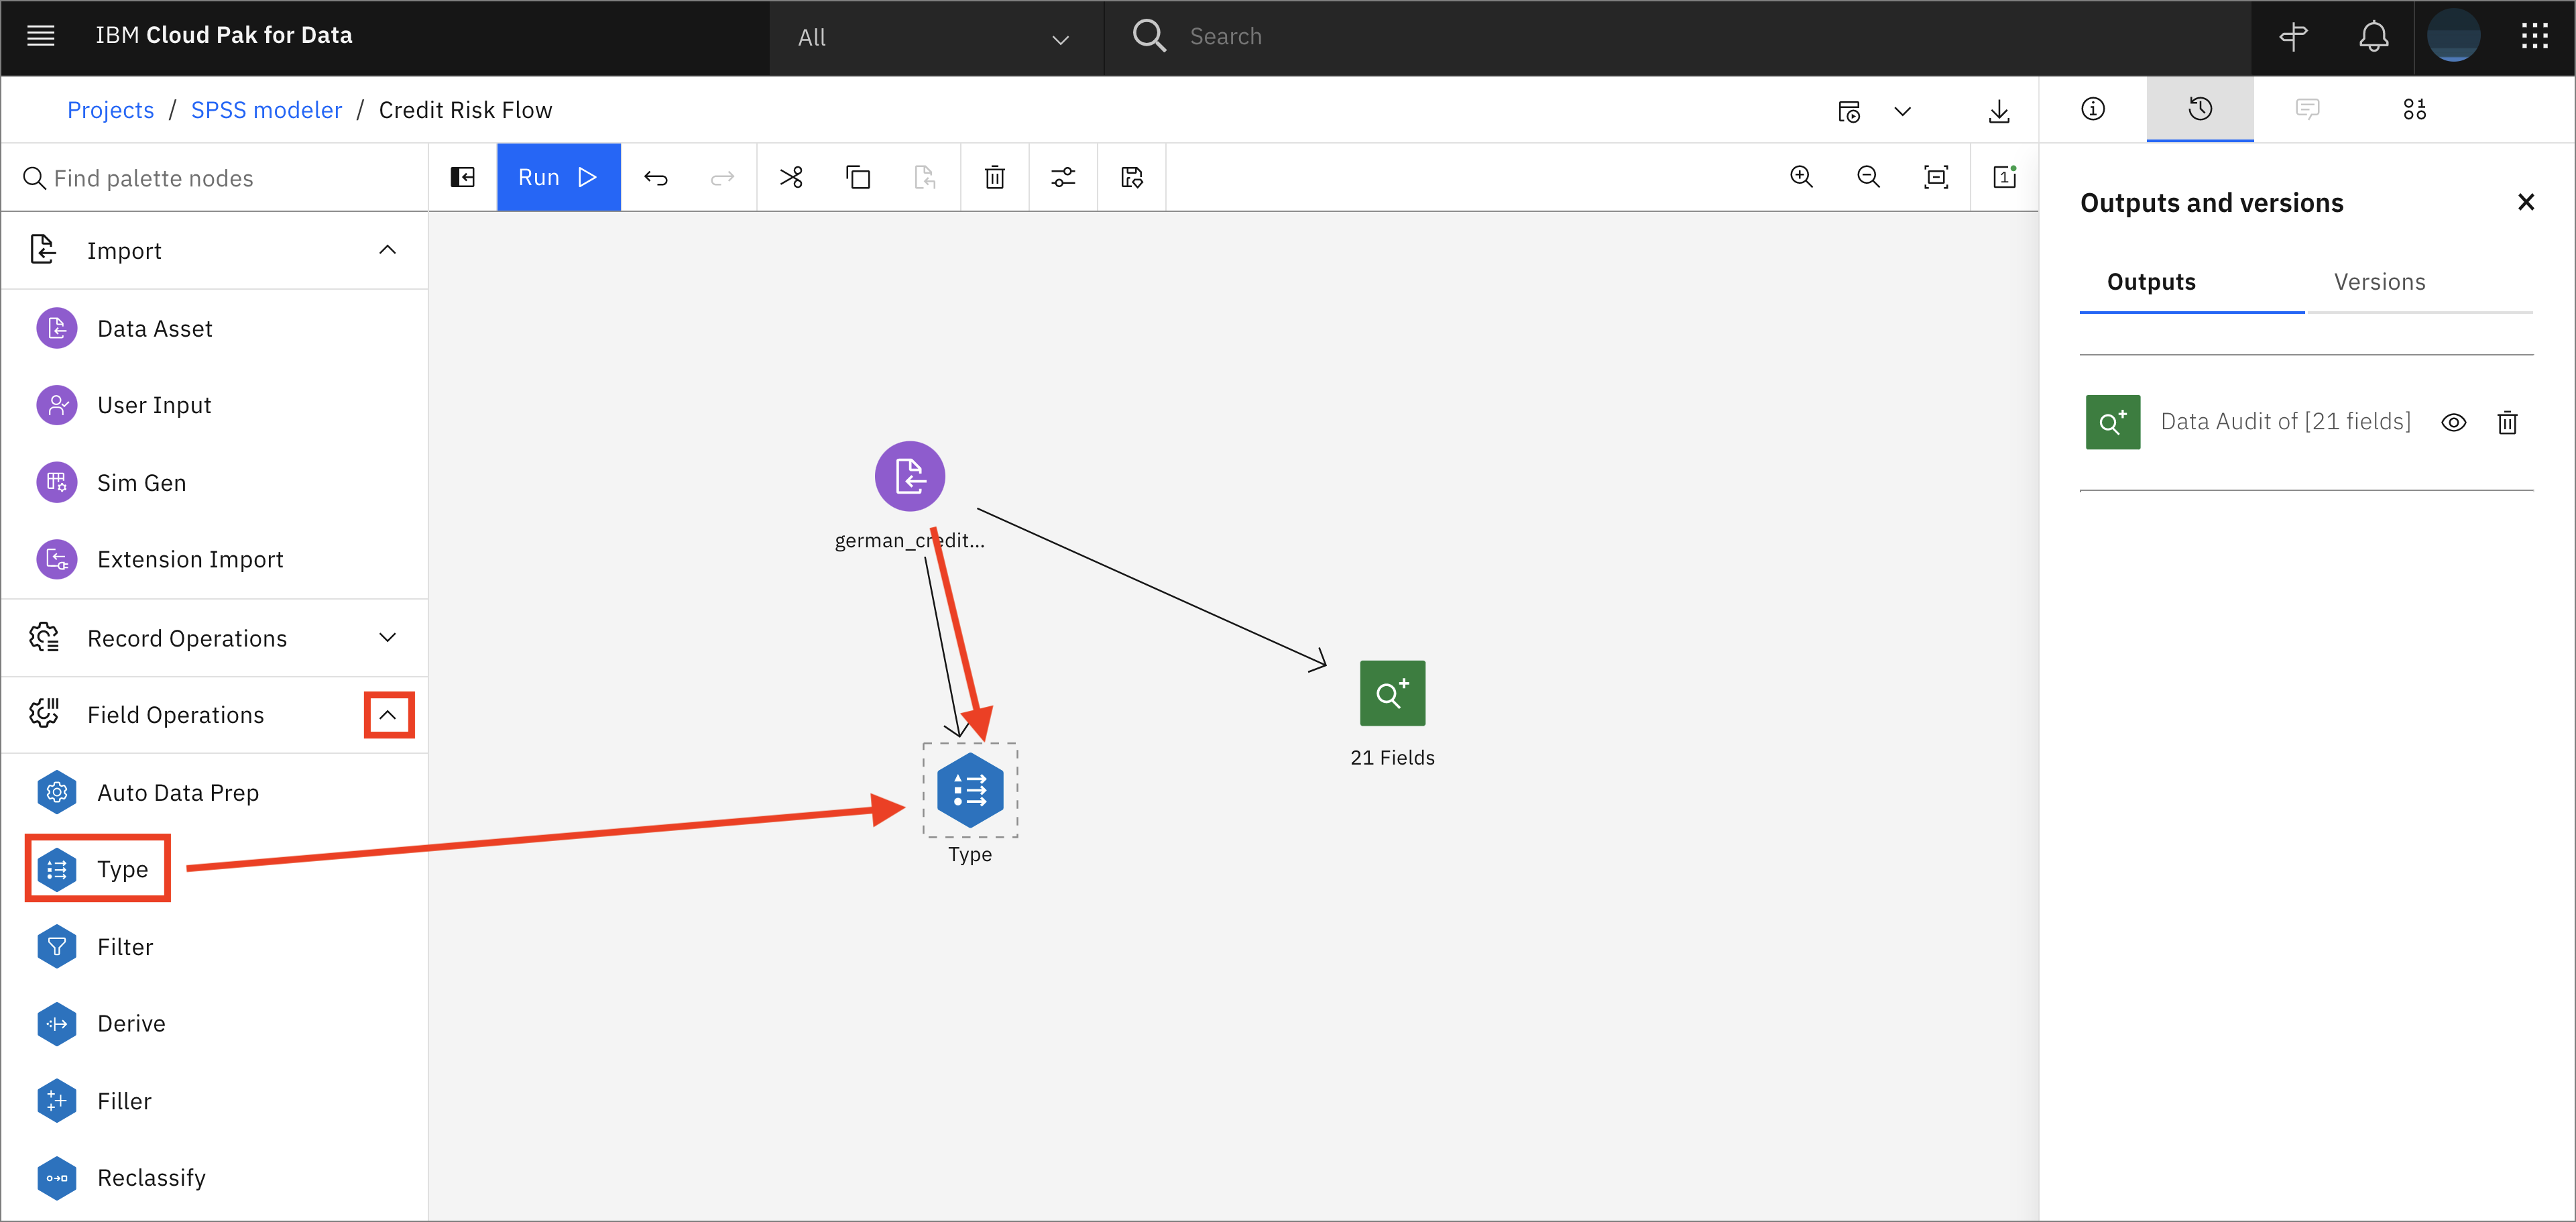
Expand the Field Operations tab and drag and drop the Type node onto the canvas. Connect the Data Asset node with the Type node, then double-click on the Type node to make the necessary configurations.
-
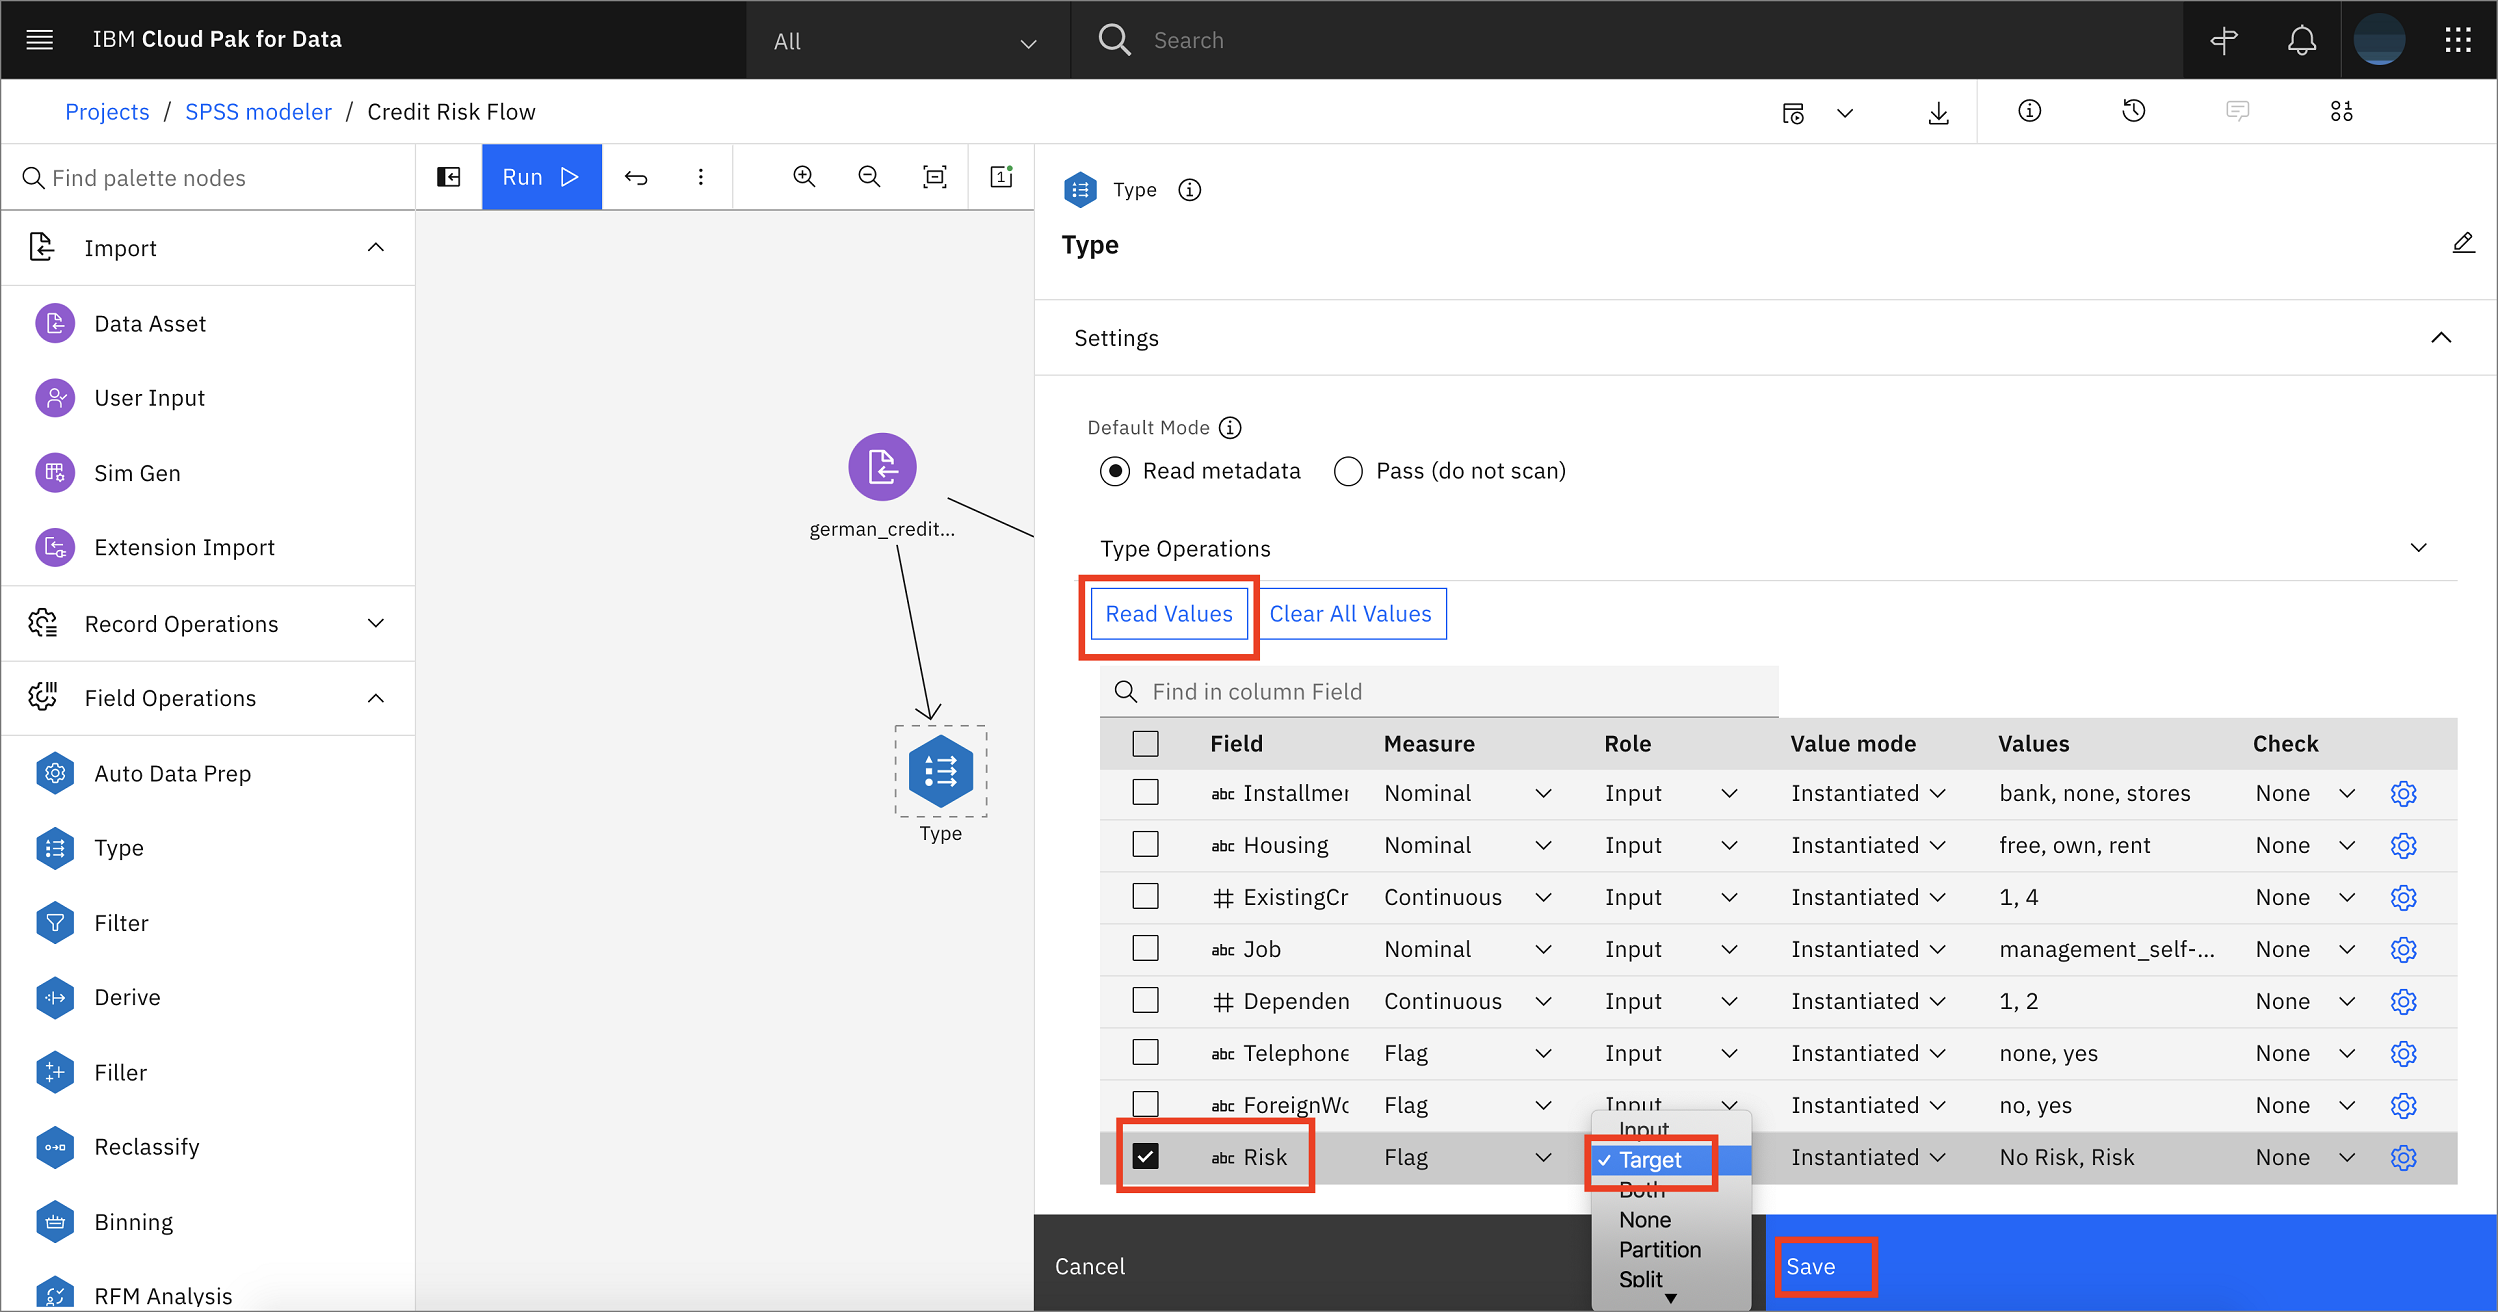
Click on Read Values. Once the read operation completes, check that the measure and role for each field is correct. Change the role of Risk from
InputtoTarget, then click Save to close the tab.
-
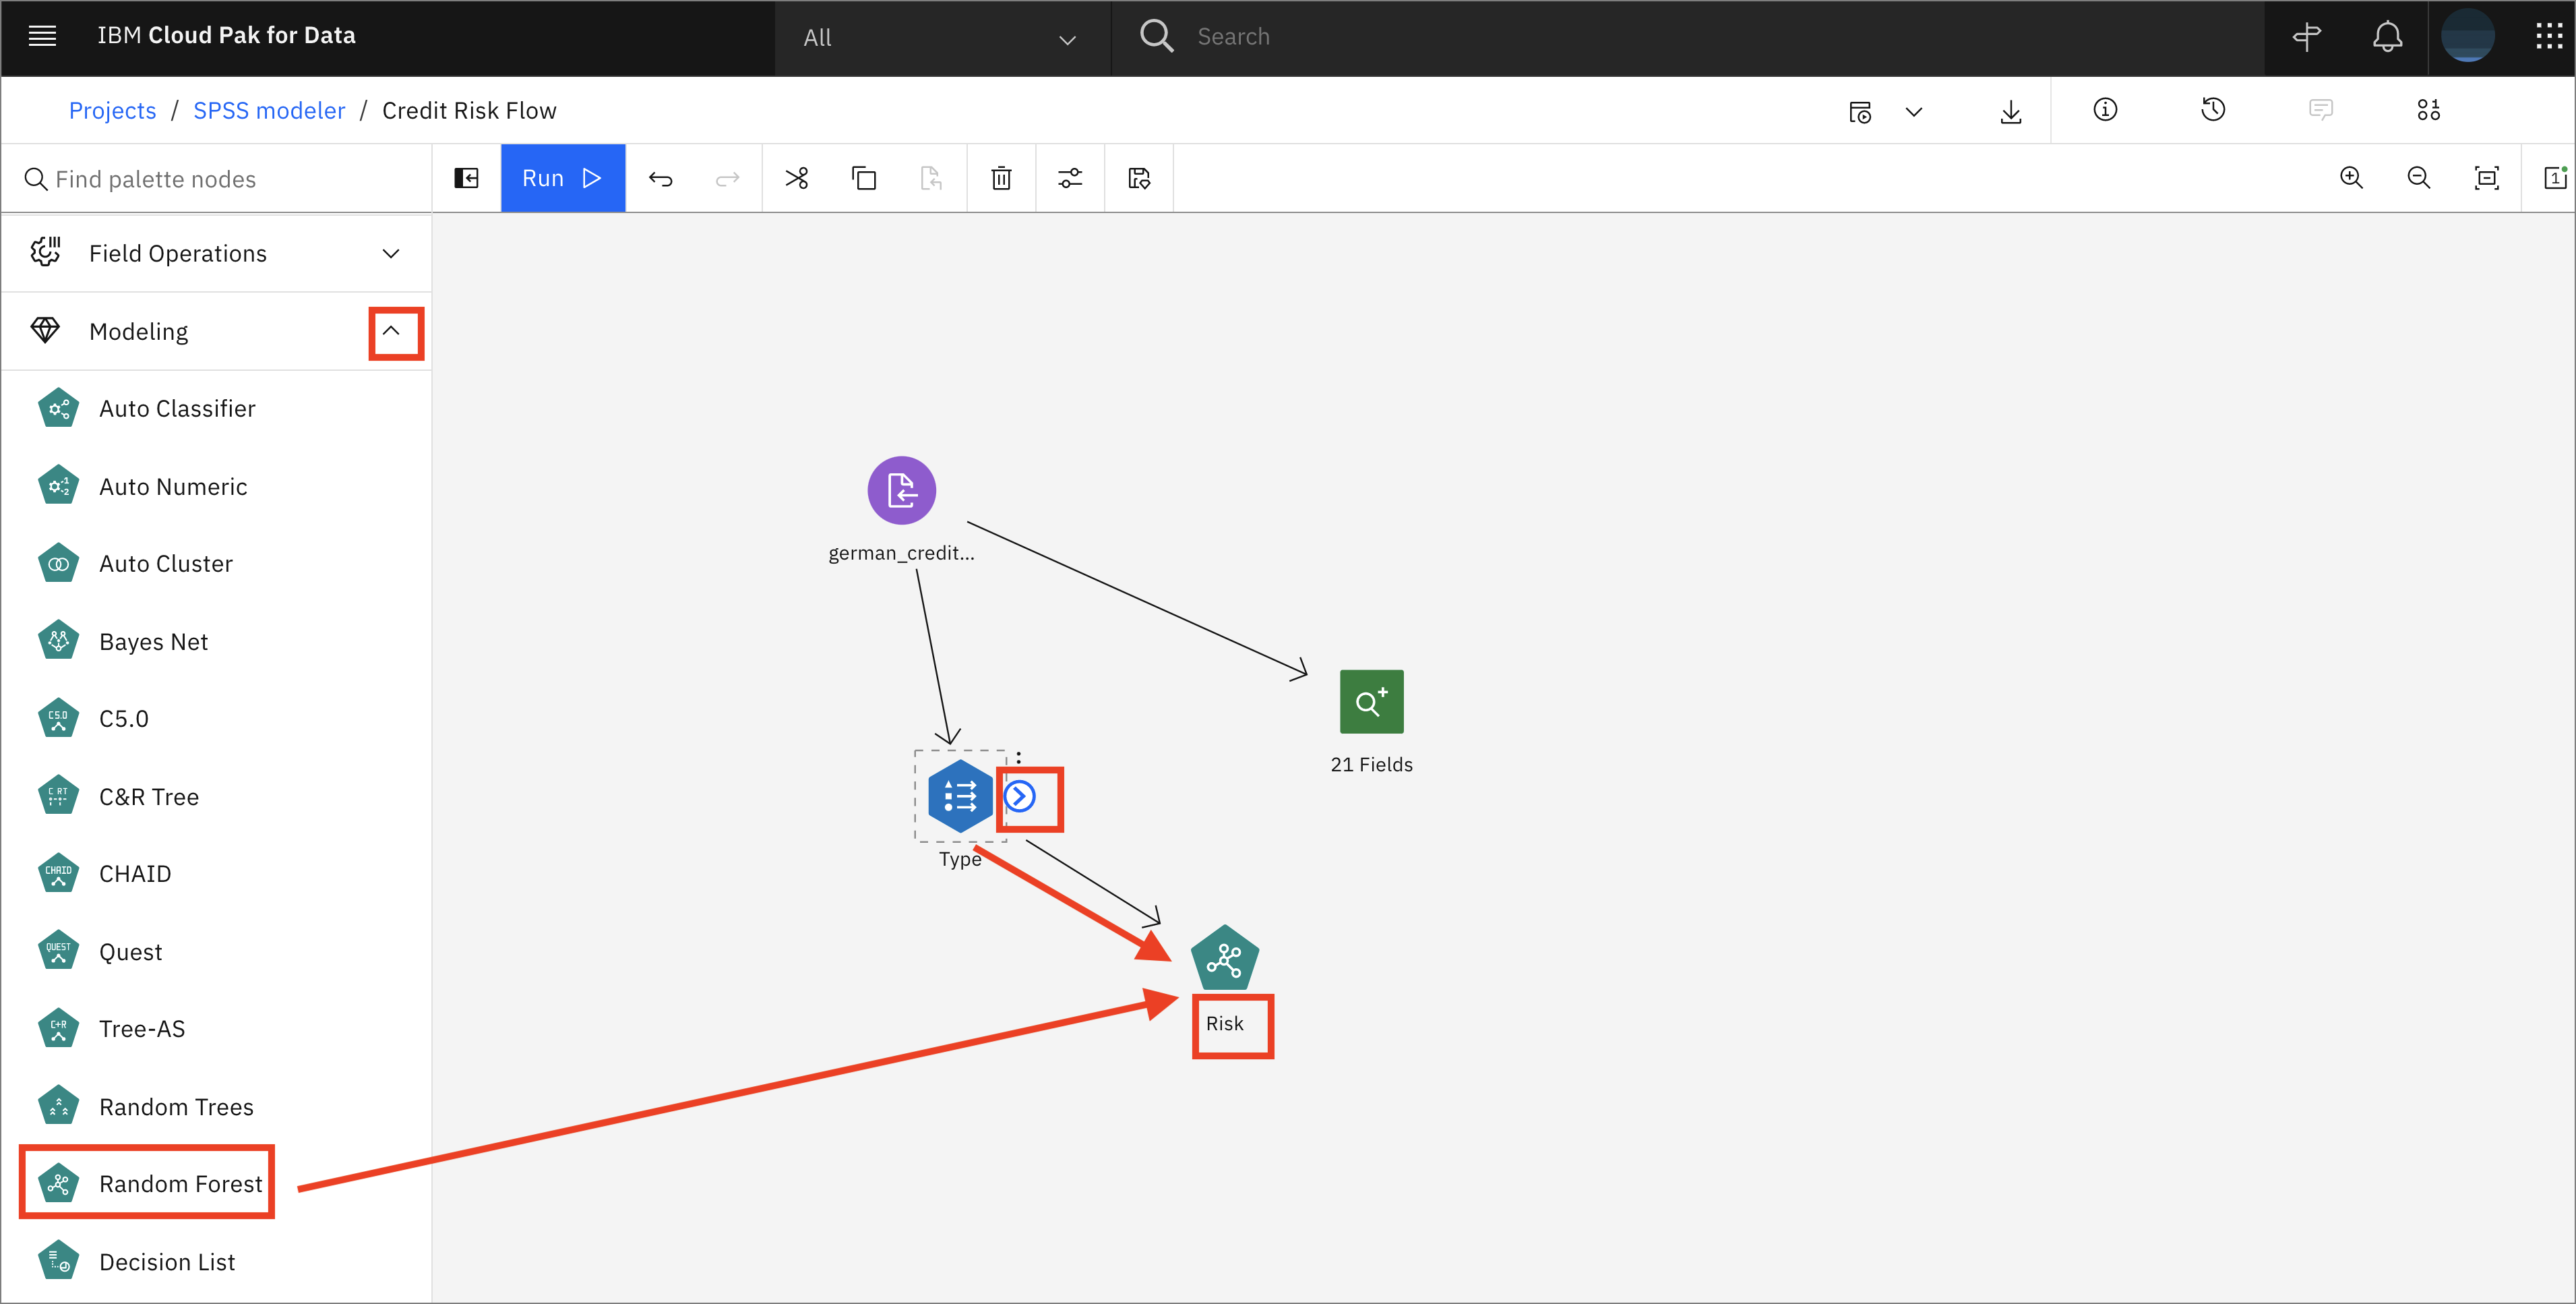
Expand the Modeling tab, then drag and drop the Random Forest node onto the canvas. Connect the Type node to the Random Forest node. The Random Forest node will automatically be renamed Risk.
-
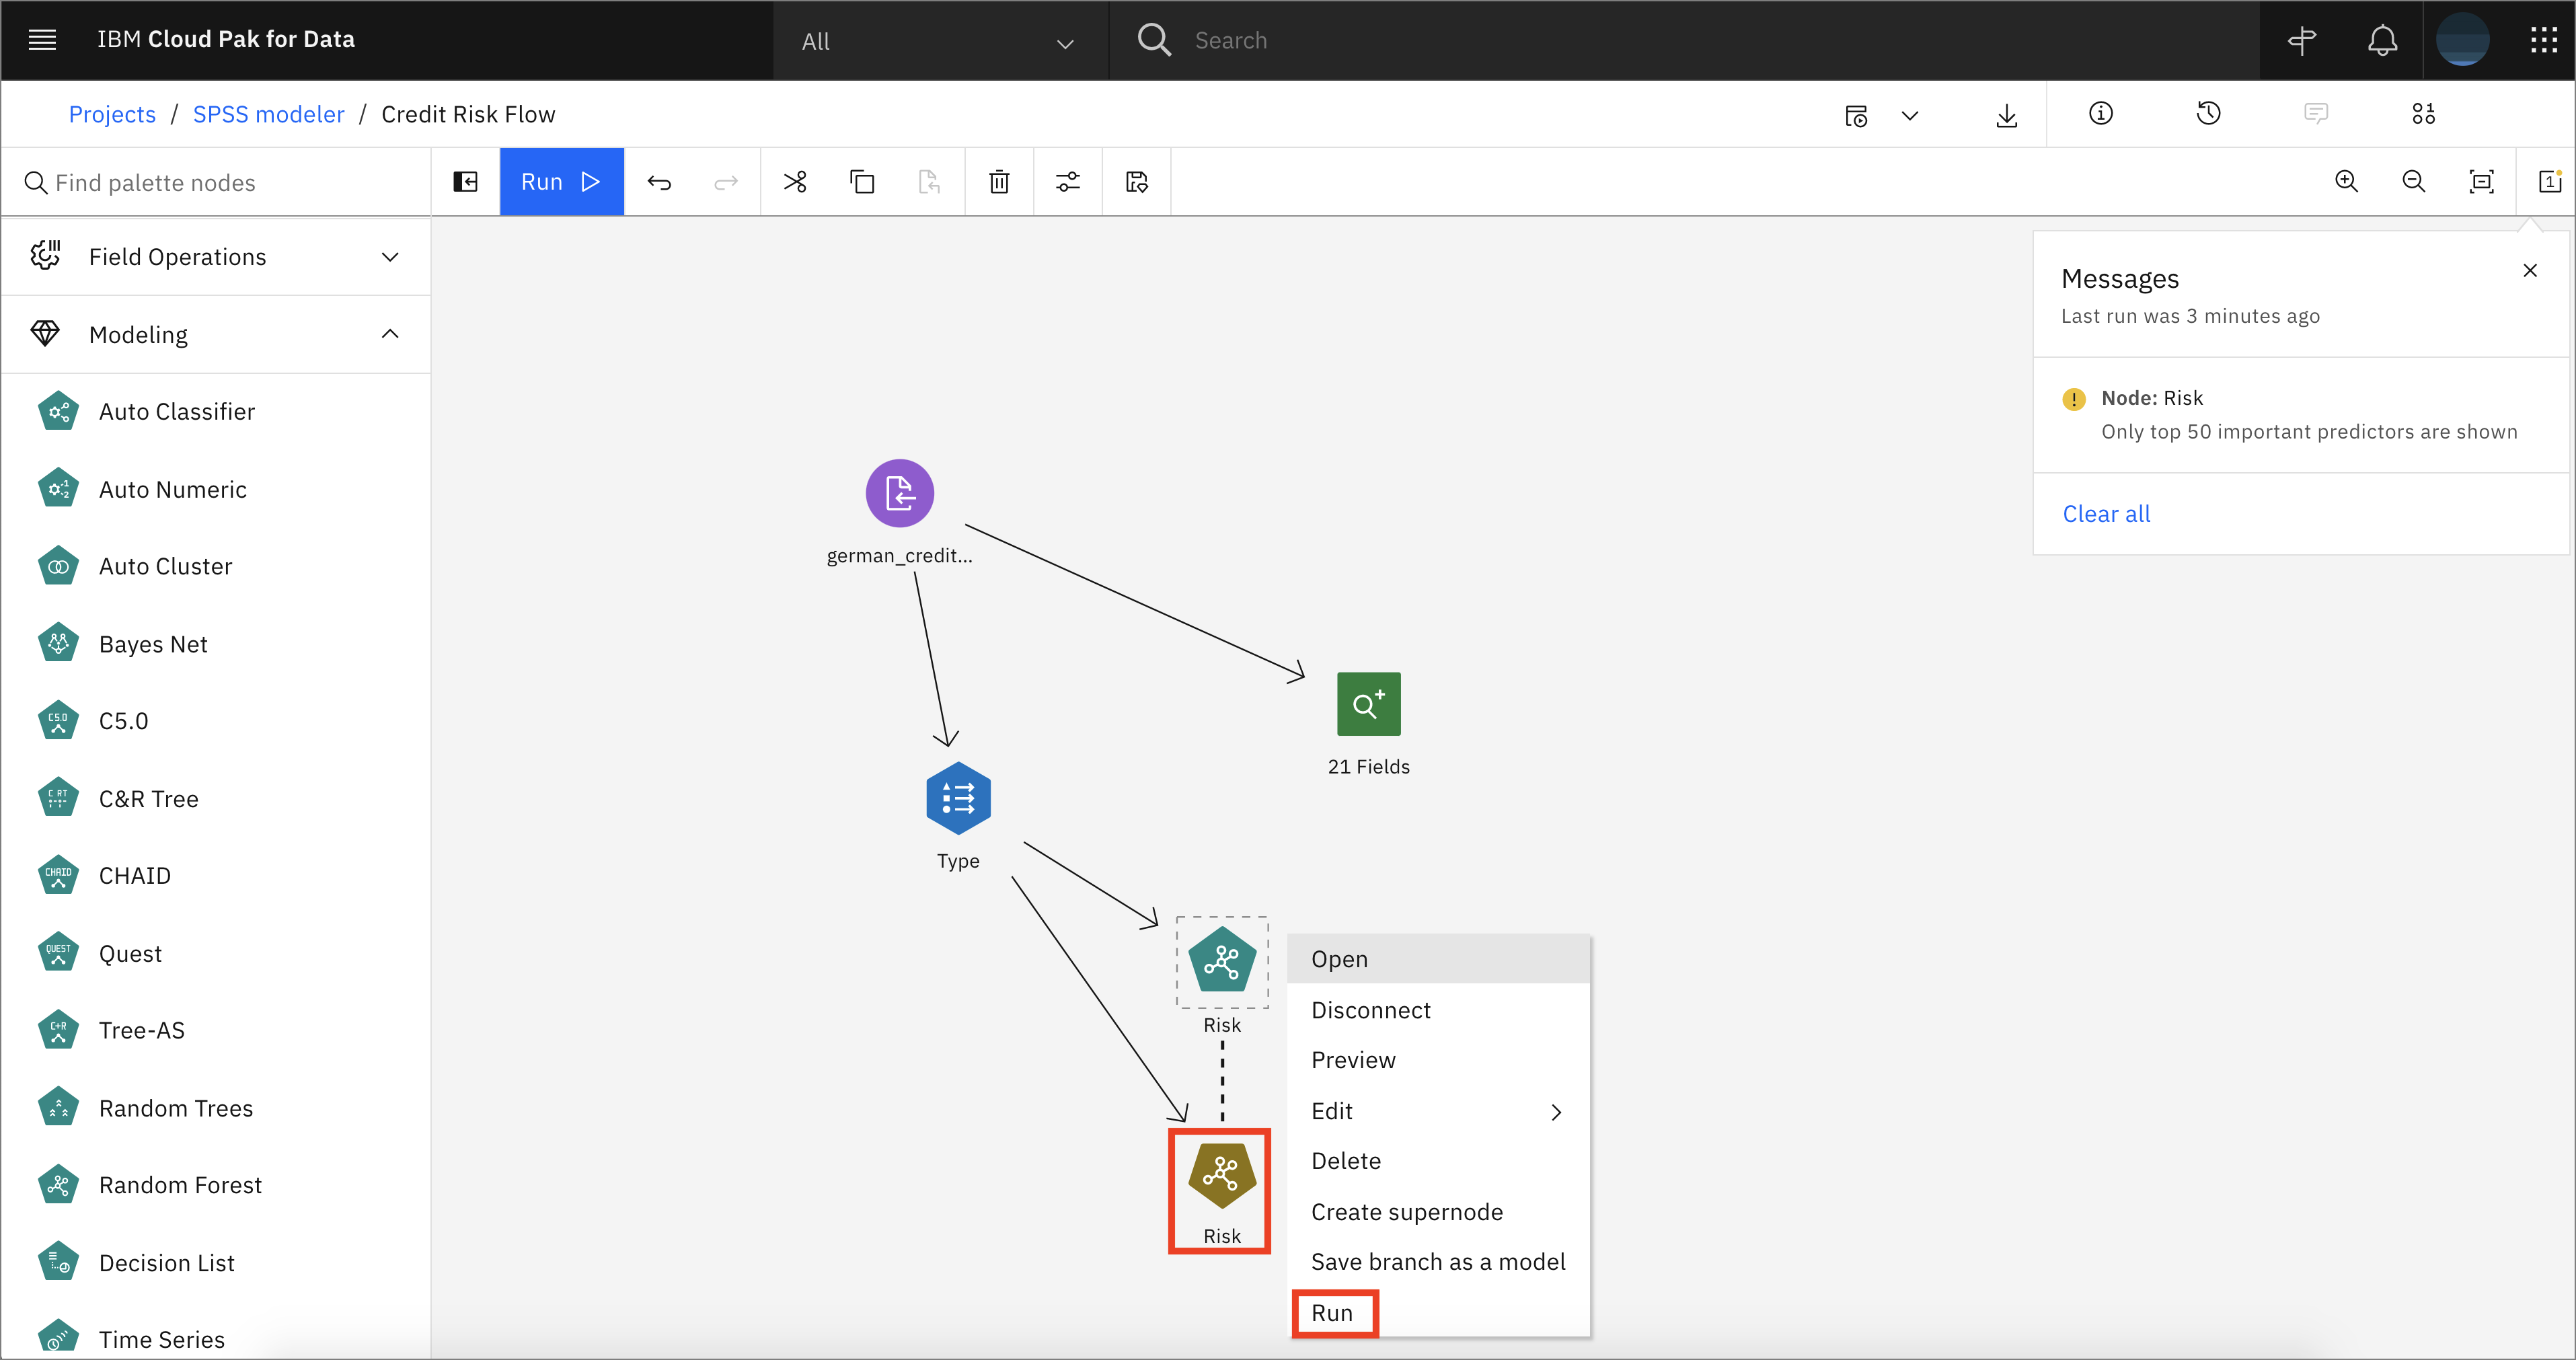
Right-click on the Random Forest node and click Run. When the execution is done, you will see a new golden nugget-like Risk node added to the canvas.
-
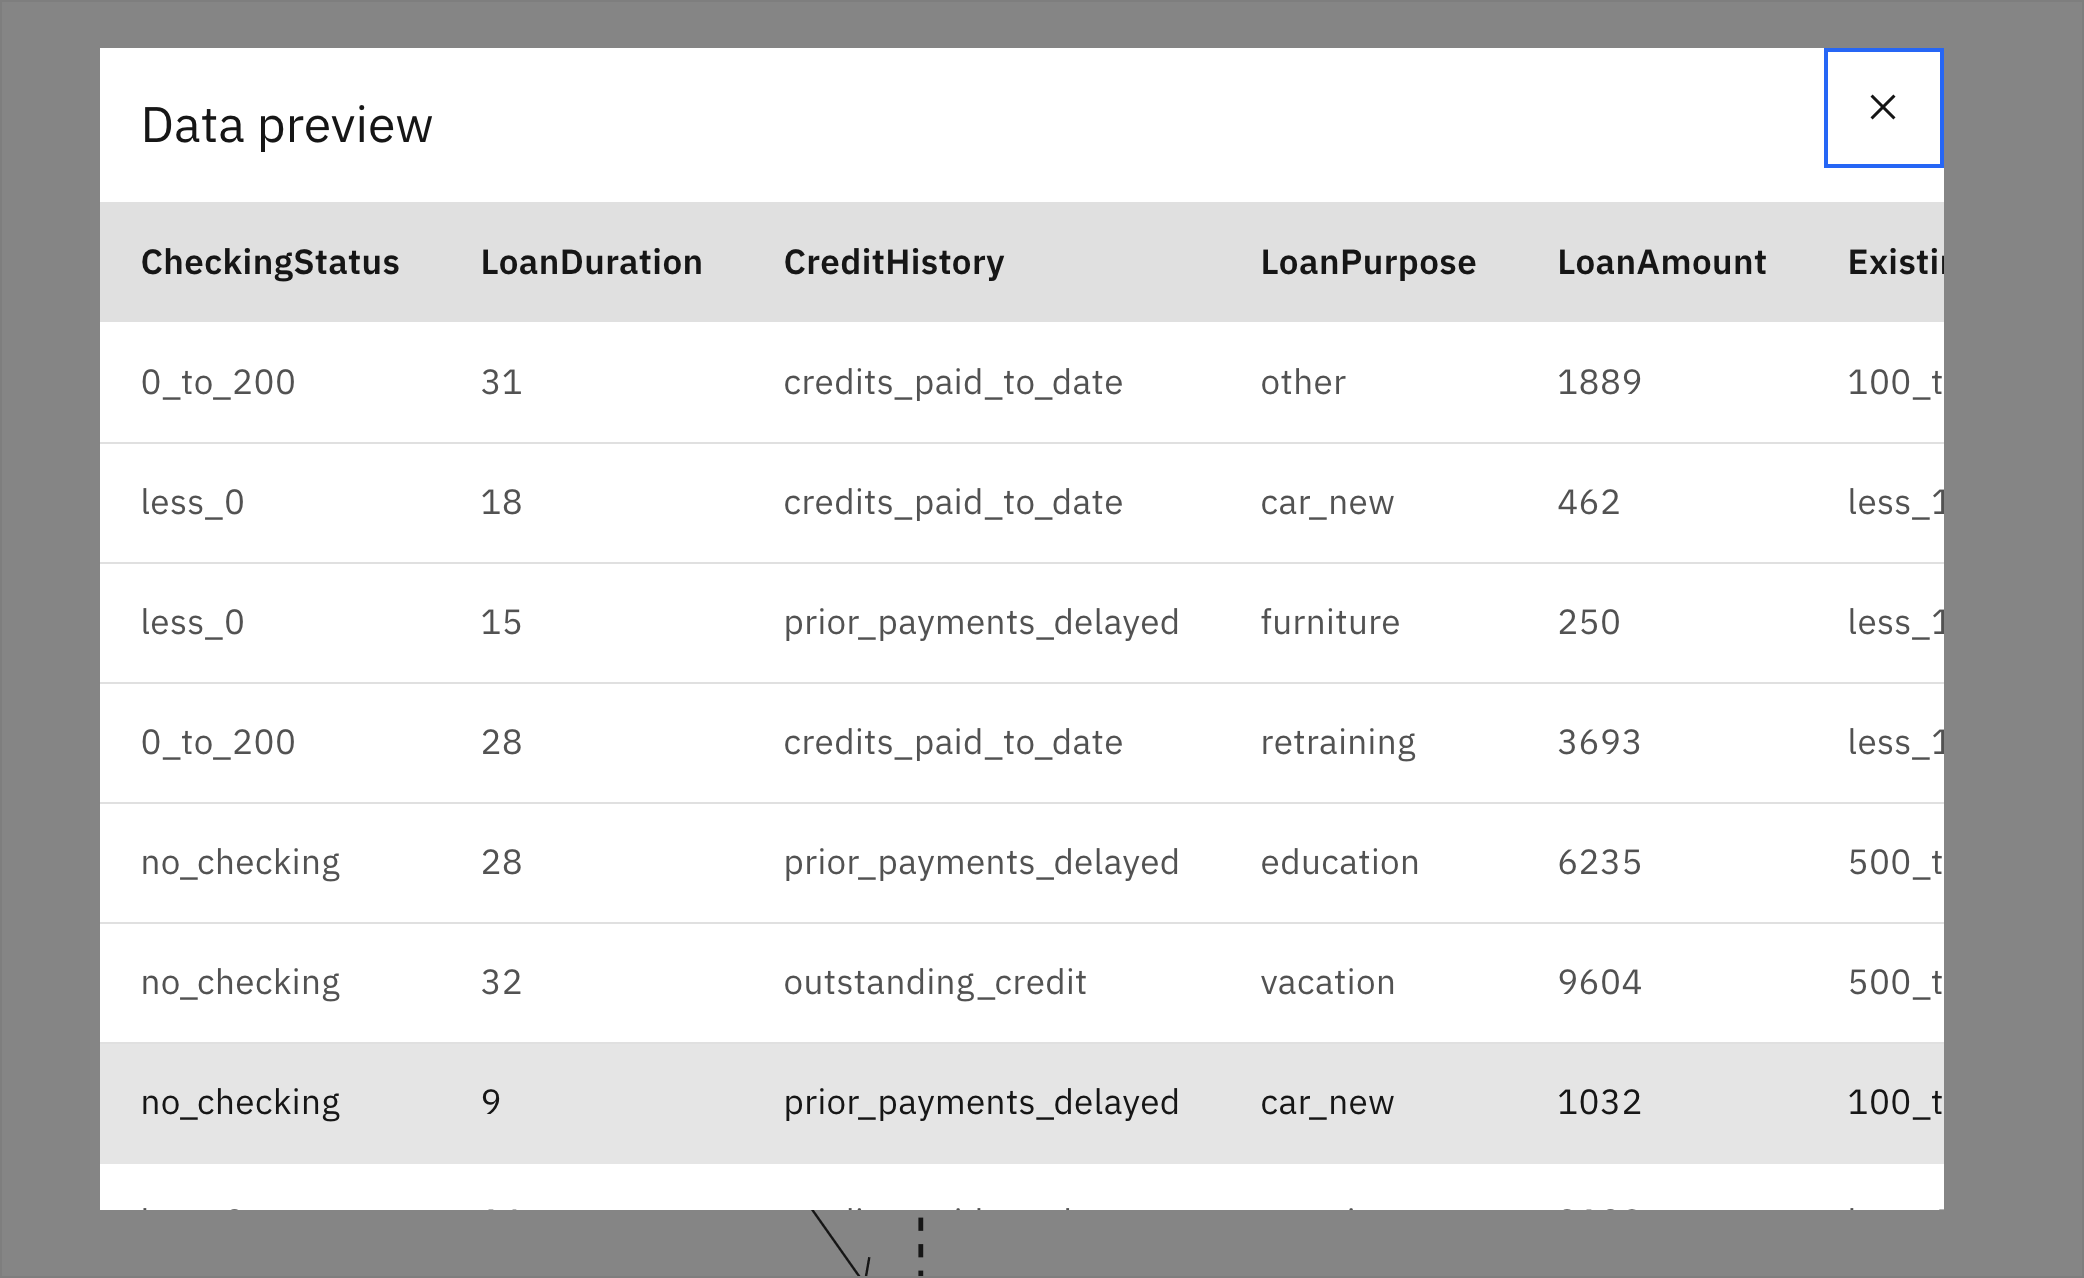
Right-click on the new Risk golden nugget node and choose Preview to inspect the output results.
-
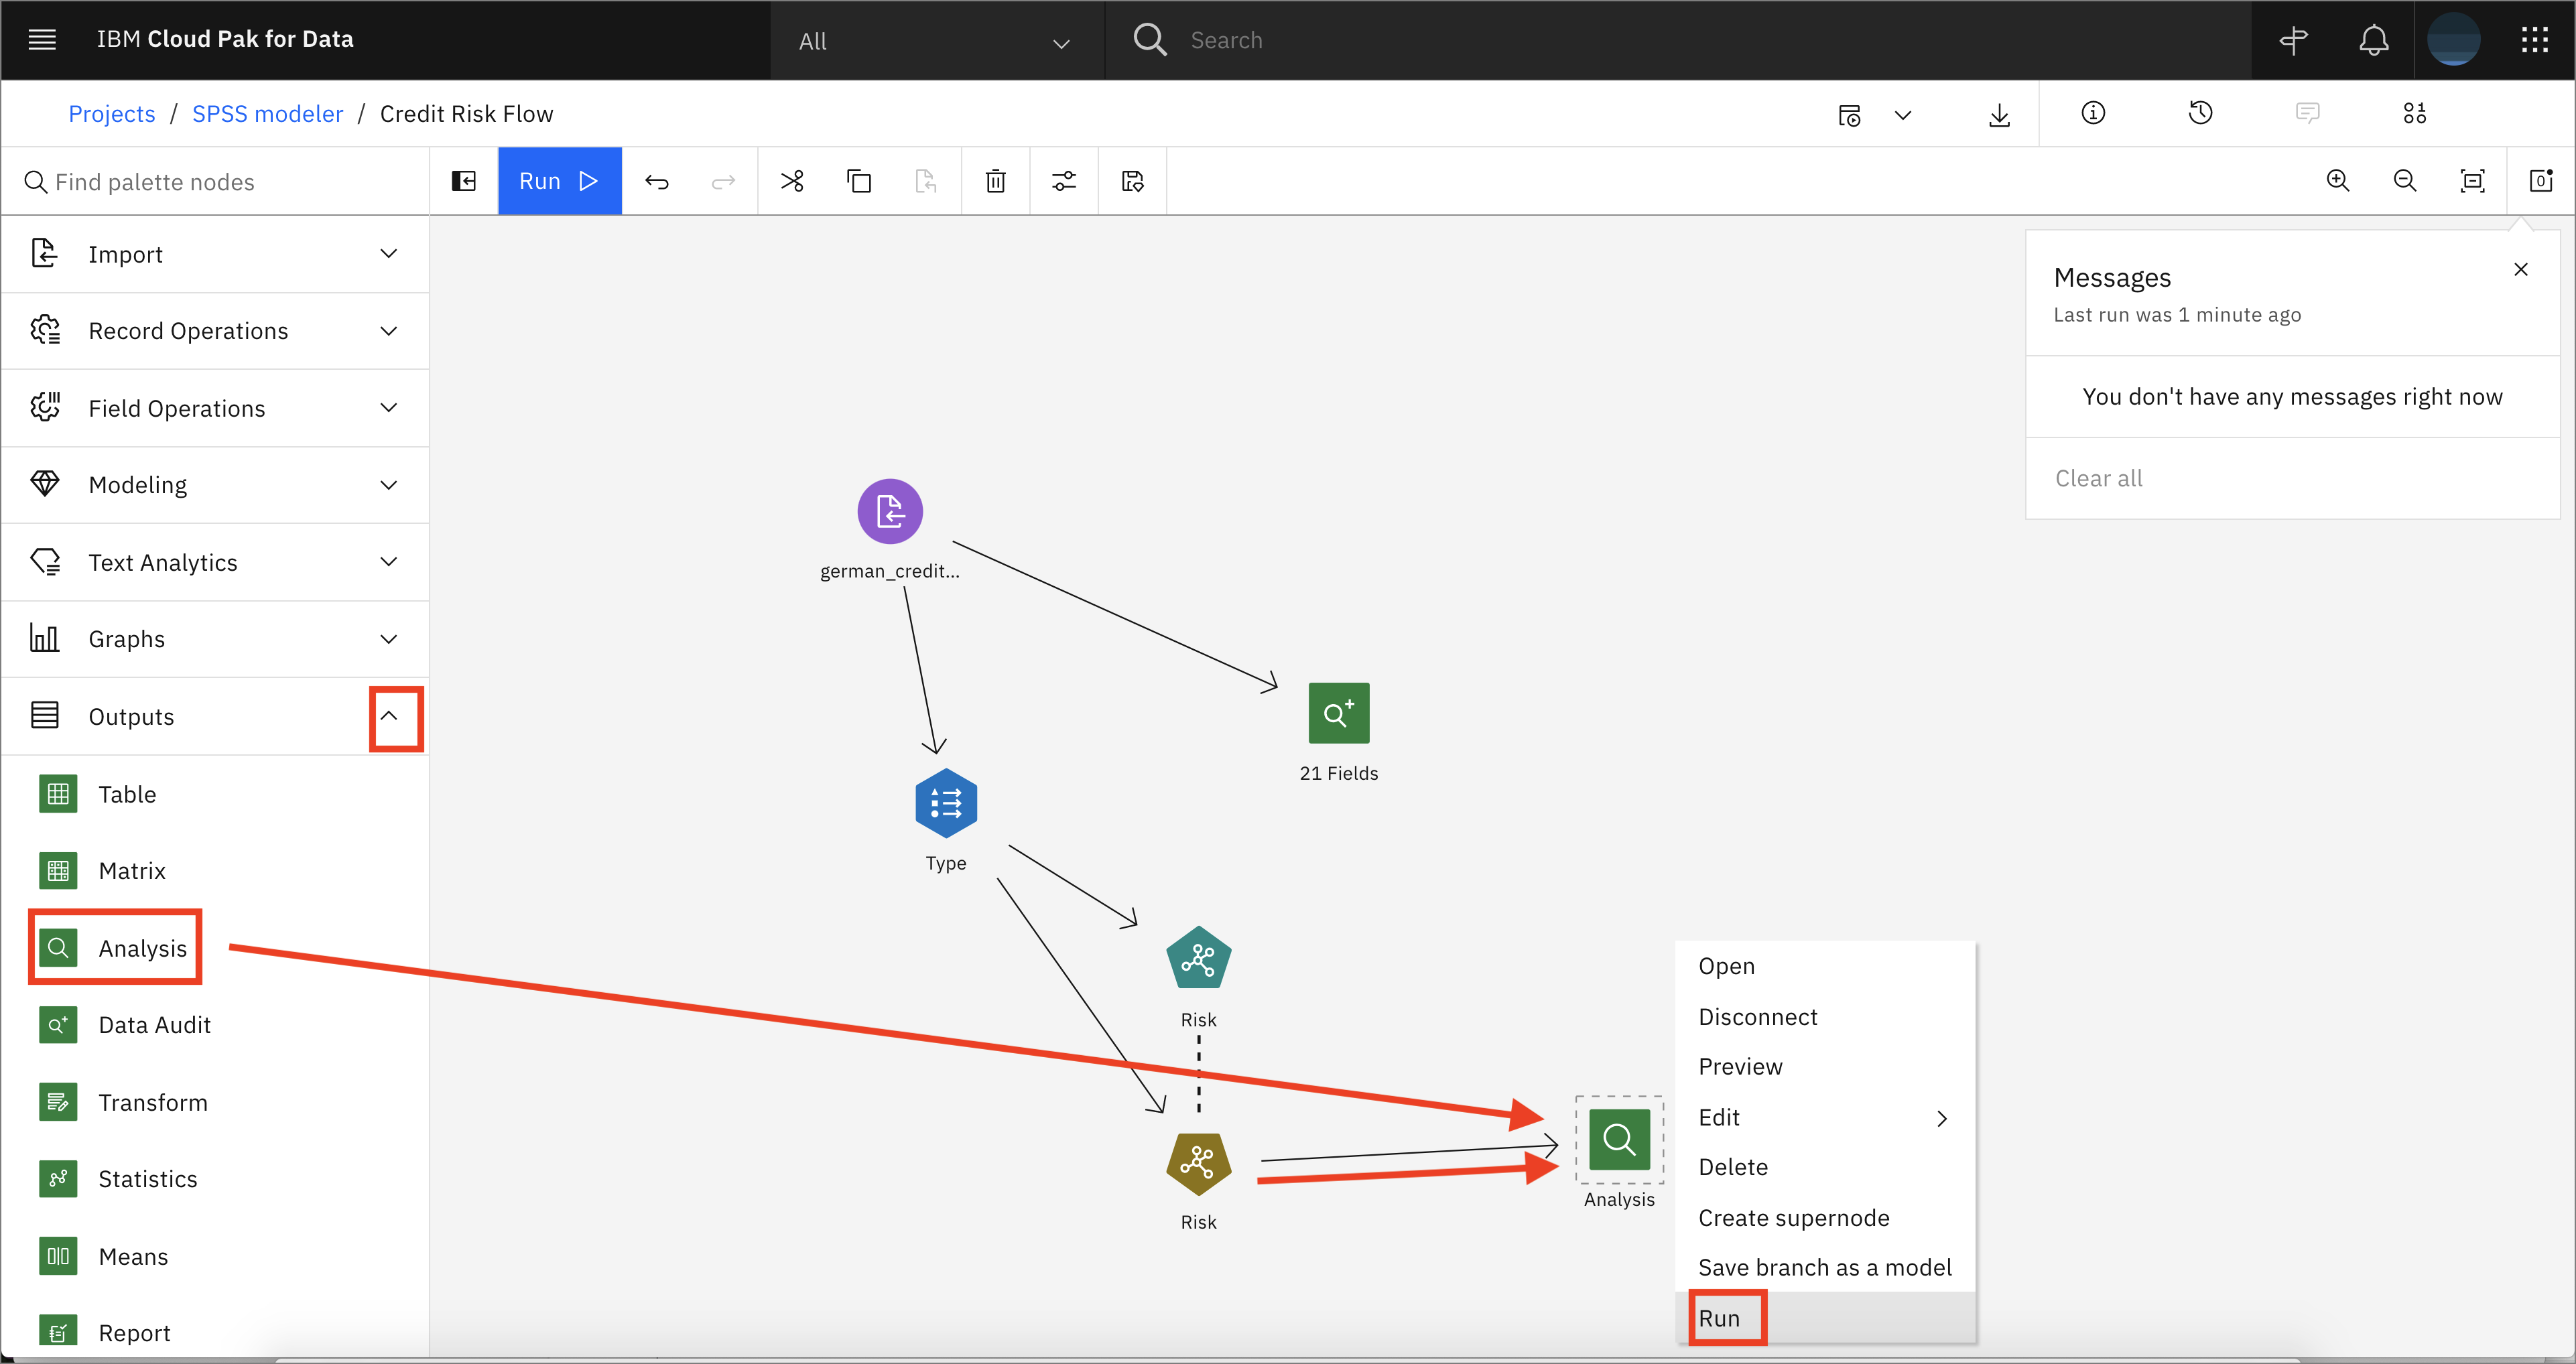
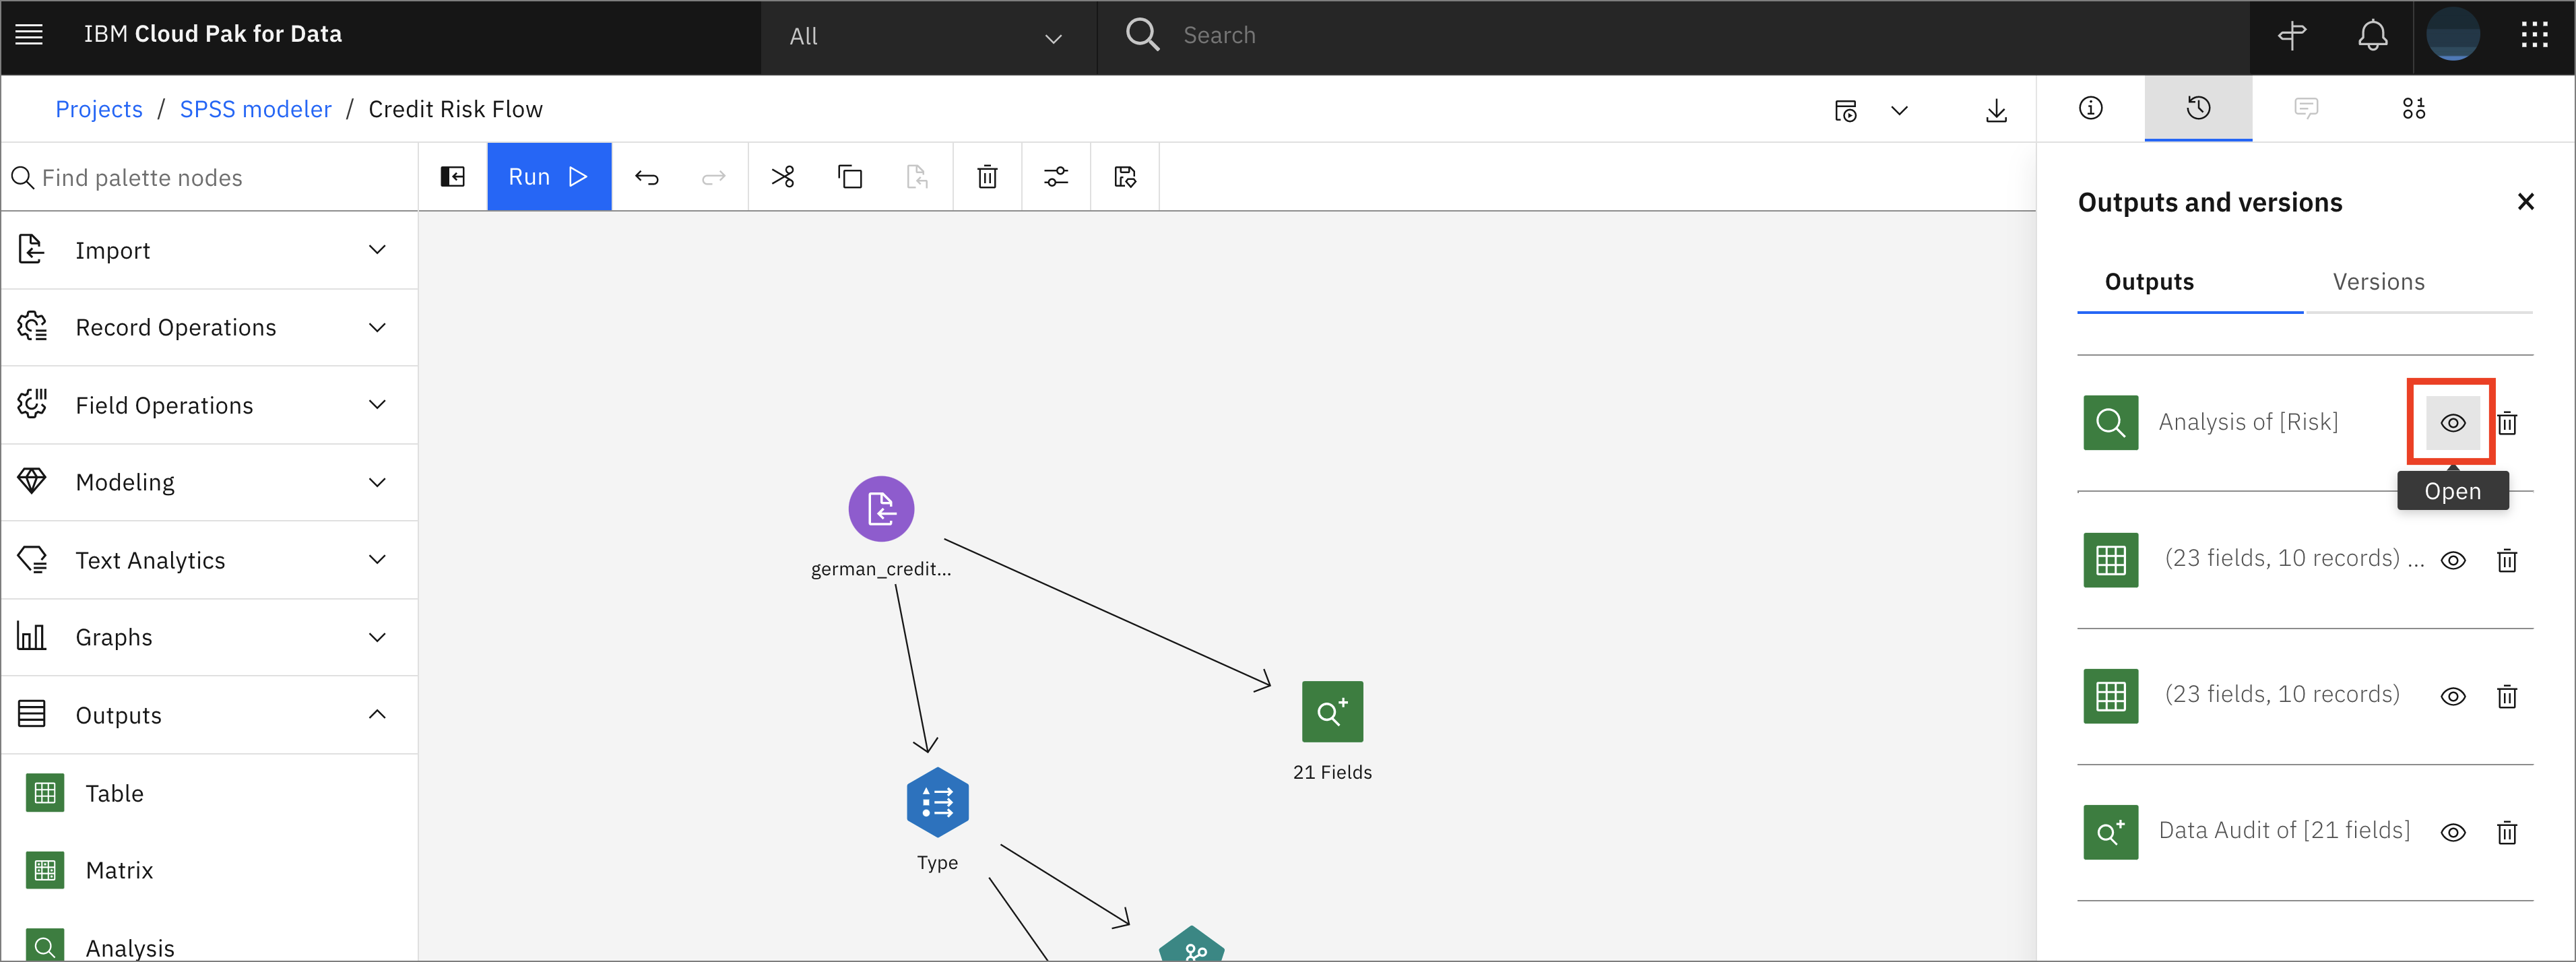
Expand the Outputs tab, then drag and drop an analysis node onto the canvas. Connect the Risk golden nugget node to the Analysis node. Right-click on the Analysis node and click Run.
-
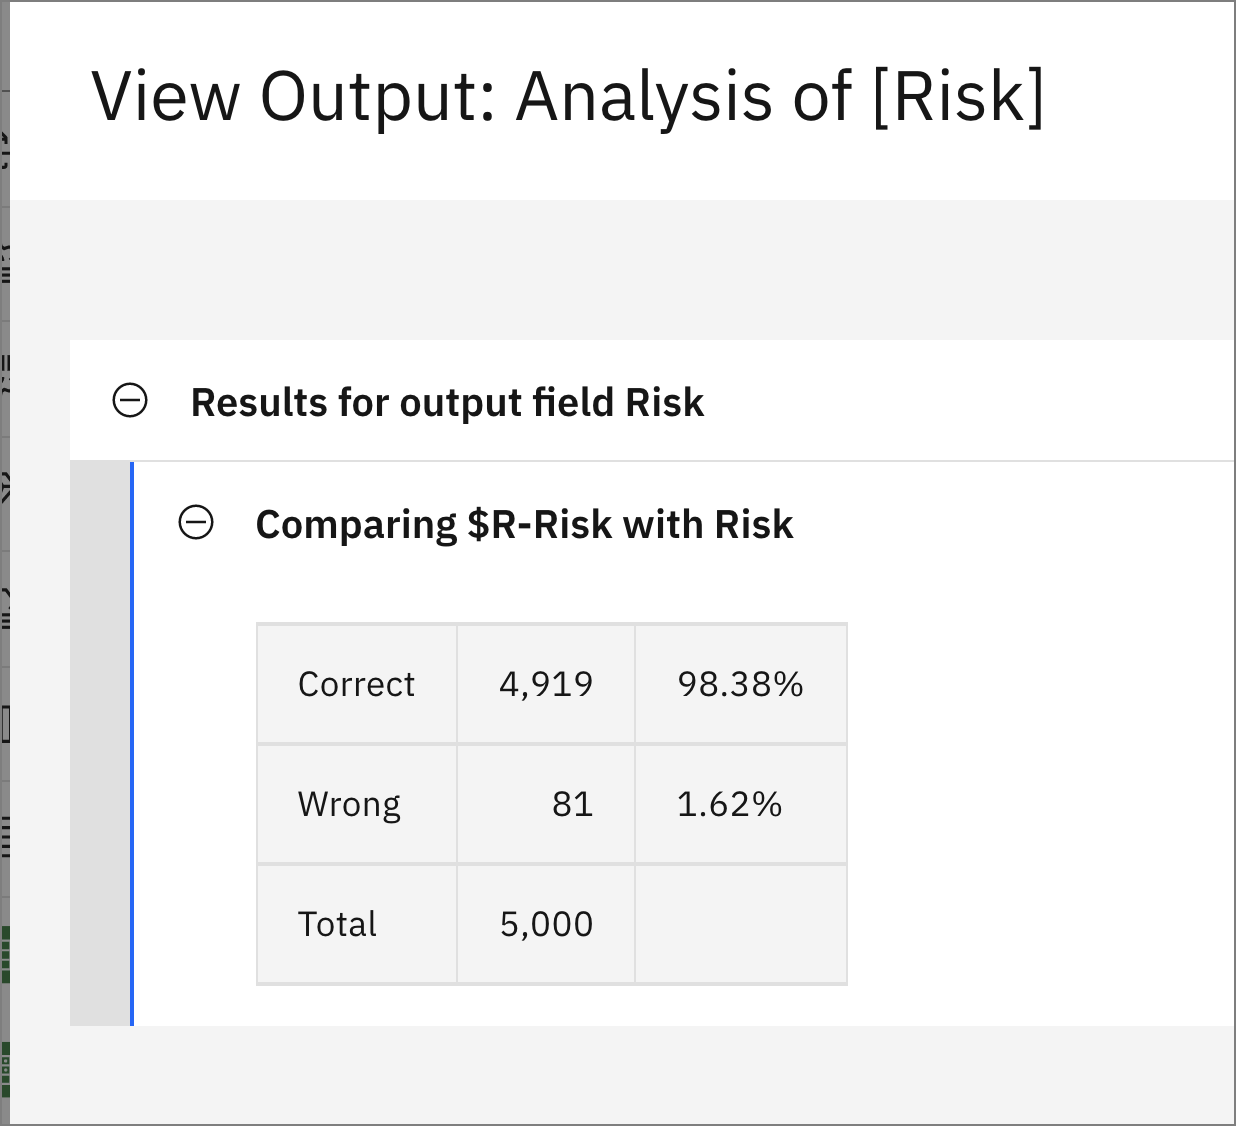
From the Outputs tab on the right, click on the "eye" icon next to analysis of [Risk] to gain insight into the accuracy of the results.
-
Click on Return to flow to go back.
-
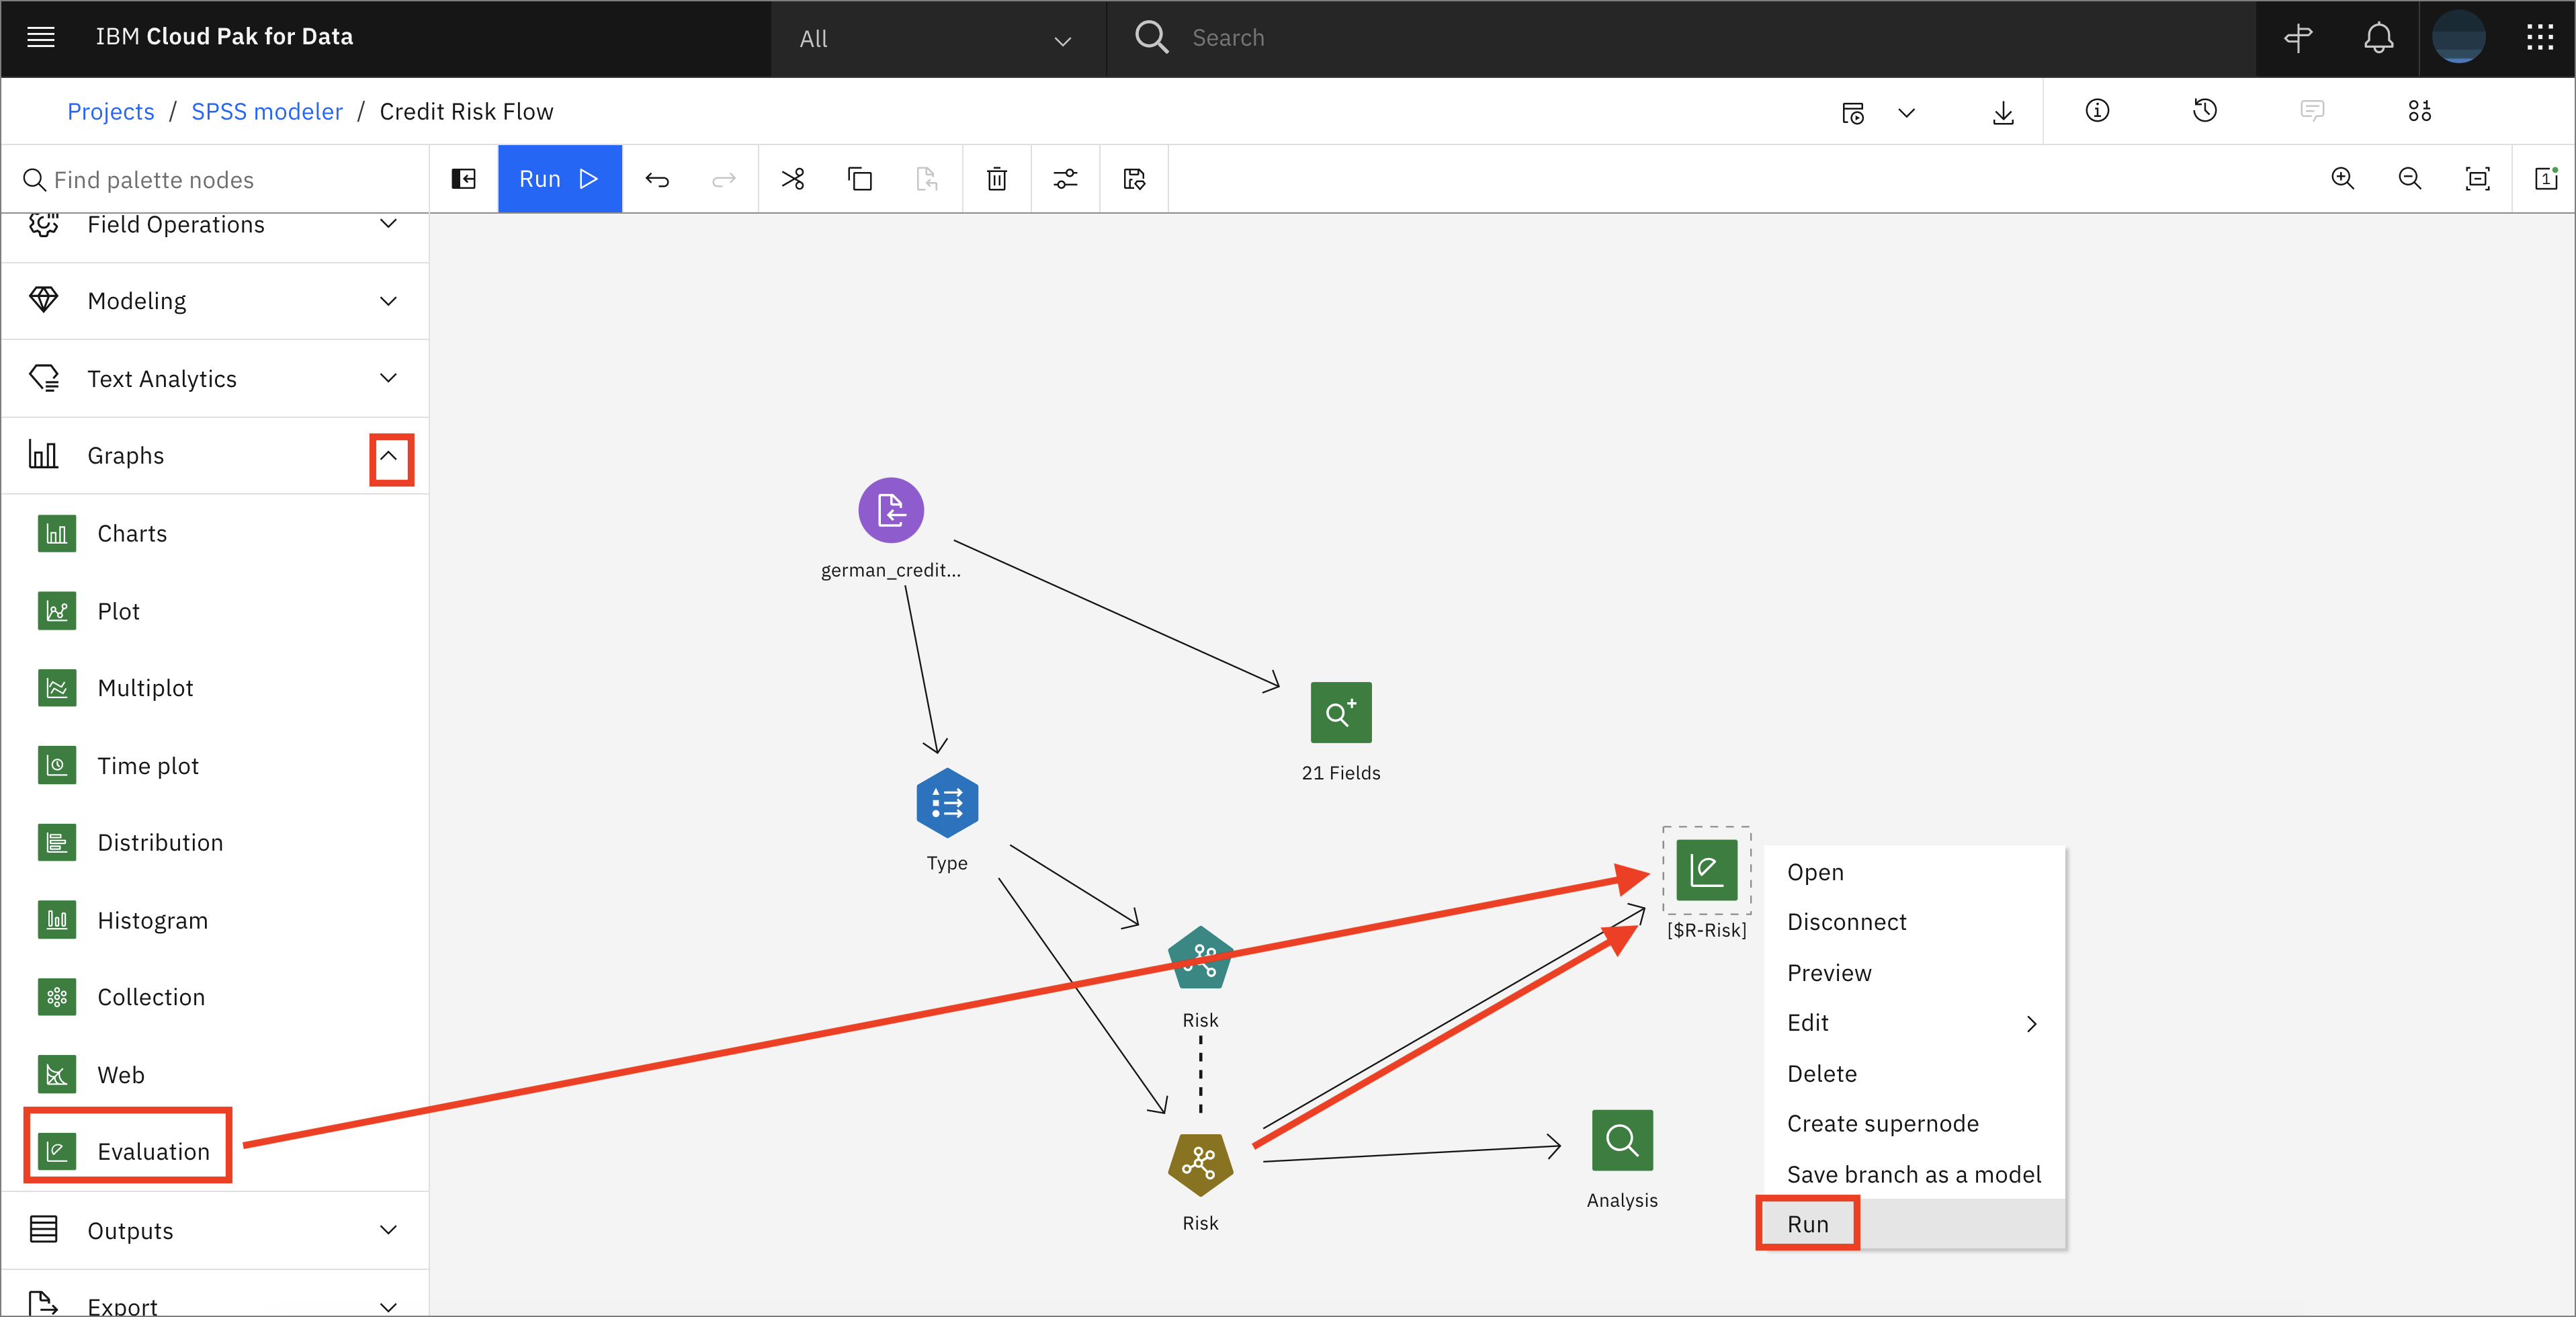
Expand the Graphs tab, then drag and drop the Evaluation node onto the canvas. Connect the Risk golden nugget node with the Evaluation node. The Evaluation node will automatically be renamed $R-Risk. Right-click on the node and click Run.
-
Double-click on the "eye" icon next to the $R-Risk output (evaluation of [$R-Risk]: Gains) to visualize the graph for the Gains. This will give the Predicted Positive Rate (or support of the classifier) vs. True Positive Rate (or sensitivity of the classifier).
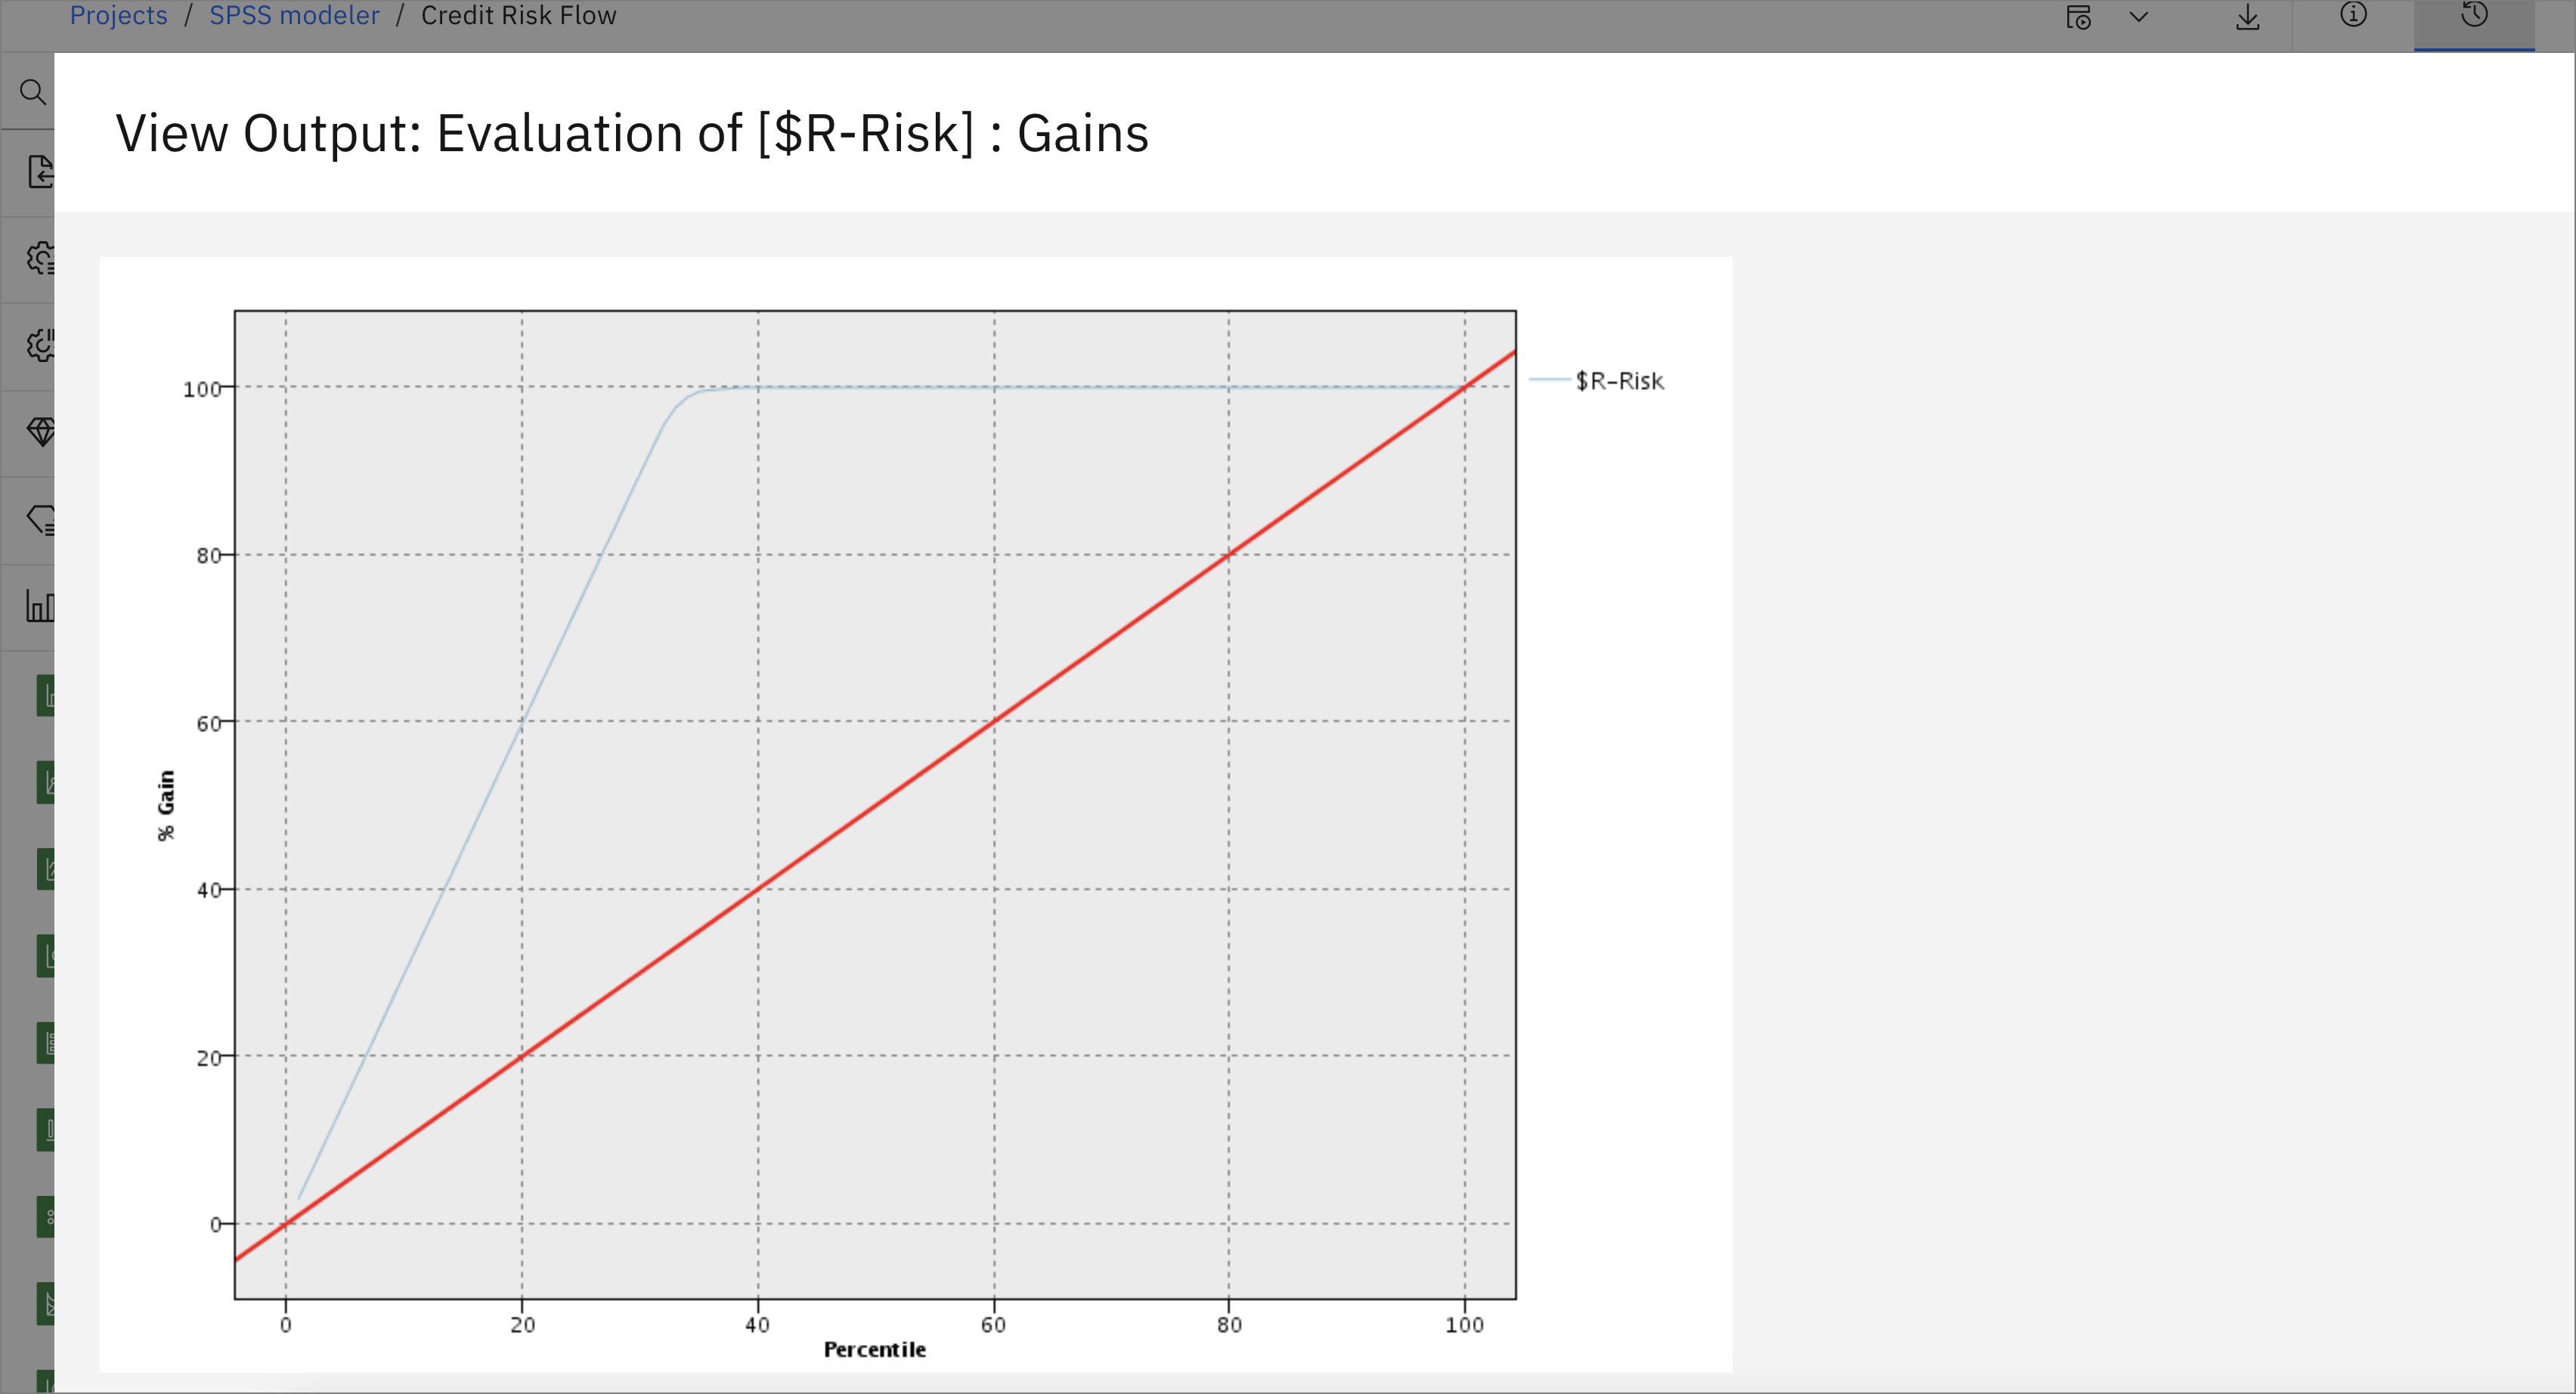
This tutorial demonstrated a small example of creating a predictive machine learning model on IBM SPSS Modeler on IBM Cloud Pak for Data. It went over importing the data into the project and the modeler flow, and preparing the data for modeling, then over the steps of choosing an appropriate algorithm for the data and training a prediction model. The last step explained how to visualize and evaluate the results of the trained model.
-
Login/Sign Up for IBM Cloud: https://ibm.biz/EasyModels
-
Hands-On Guide: https://ibm.biz/EasyModels-Workshop
-
Workshop Replay: https://www.crowdcast.io/e/build-a-predictive-2


