React Surveillance Dashboard
Full cloud architecture diagram of the implemented application is shown below.
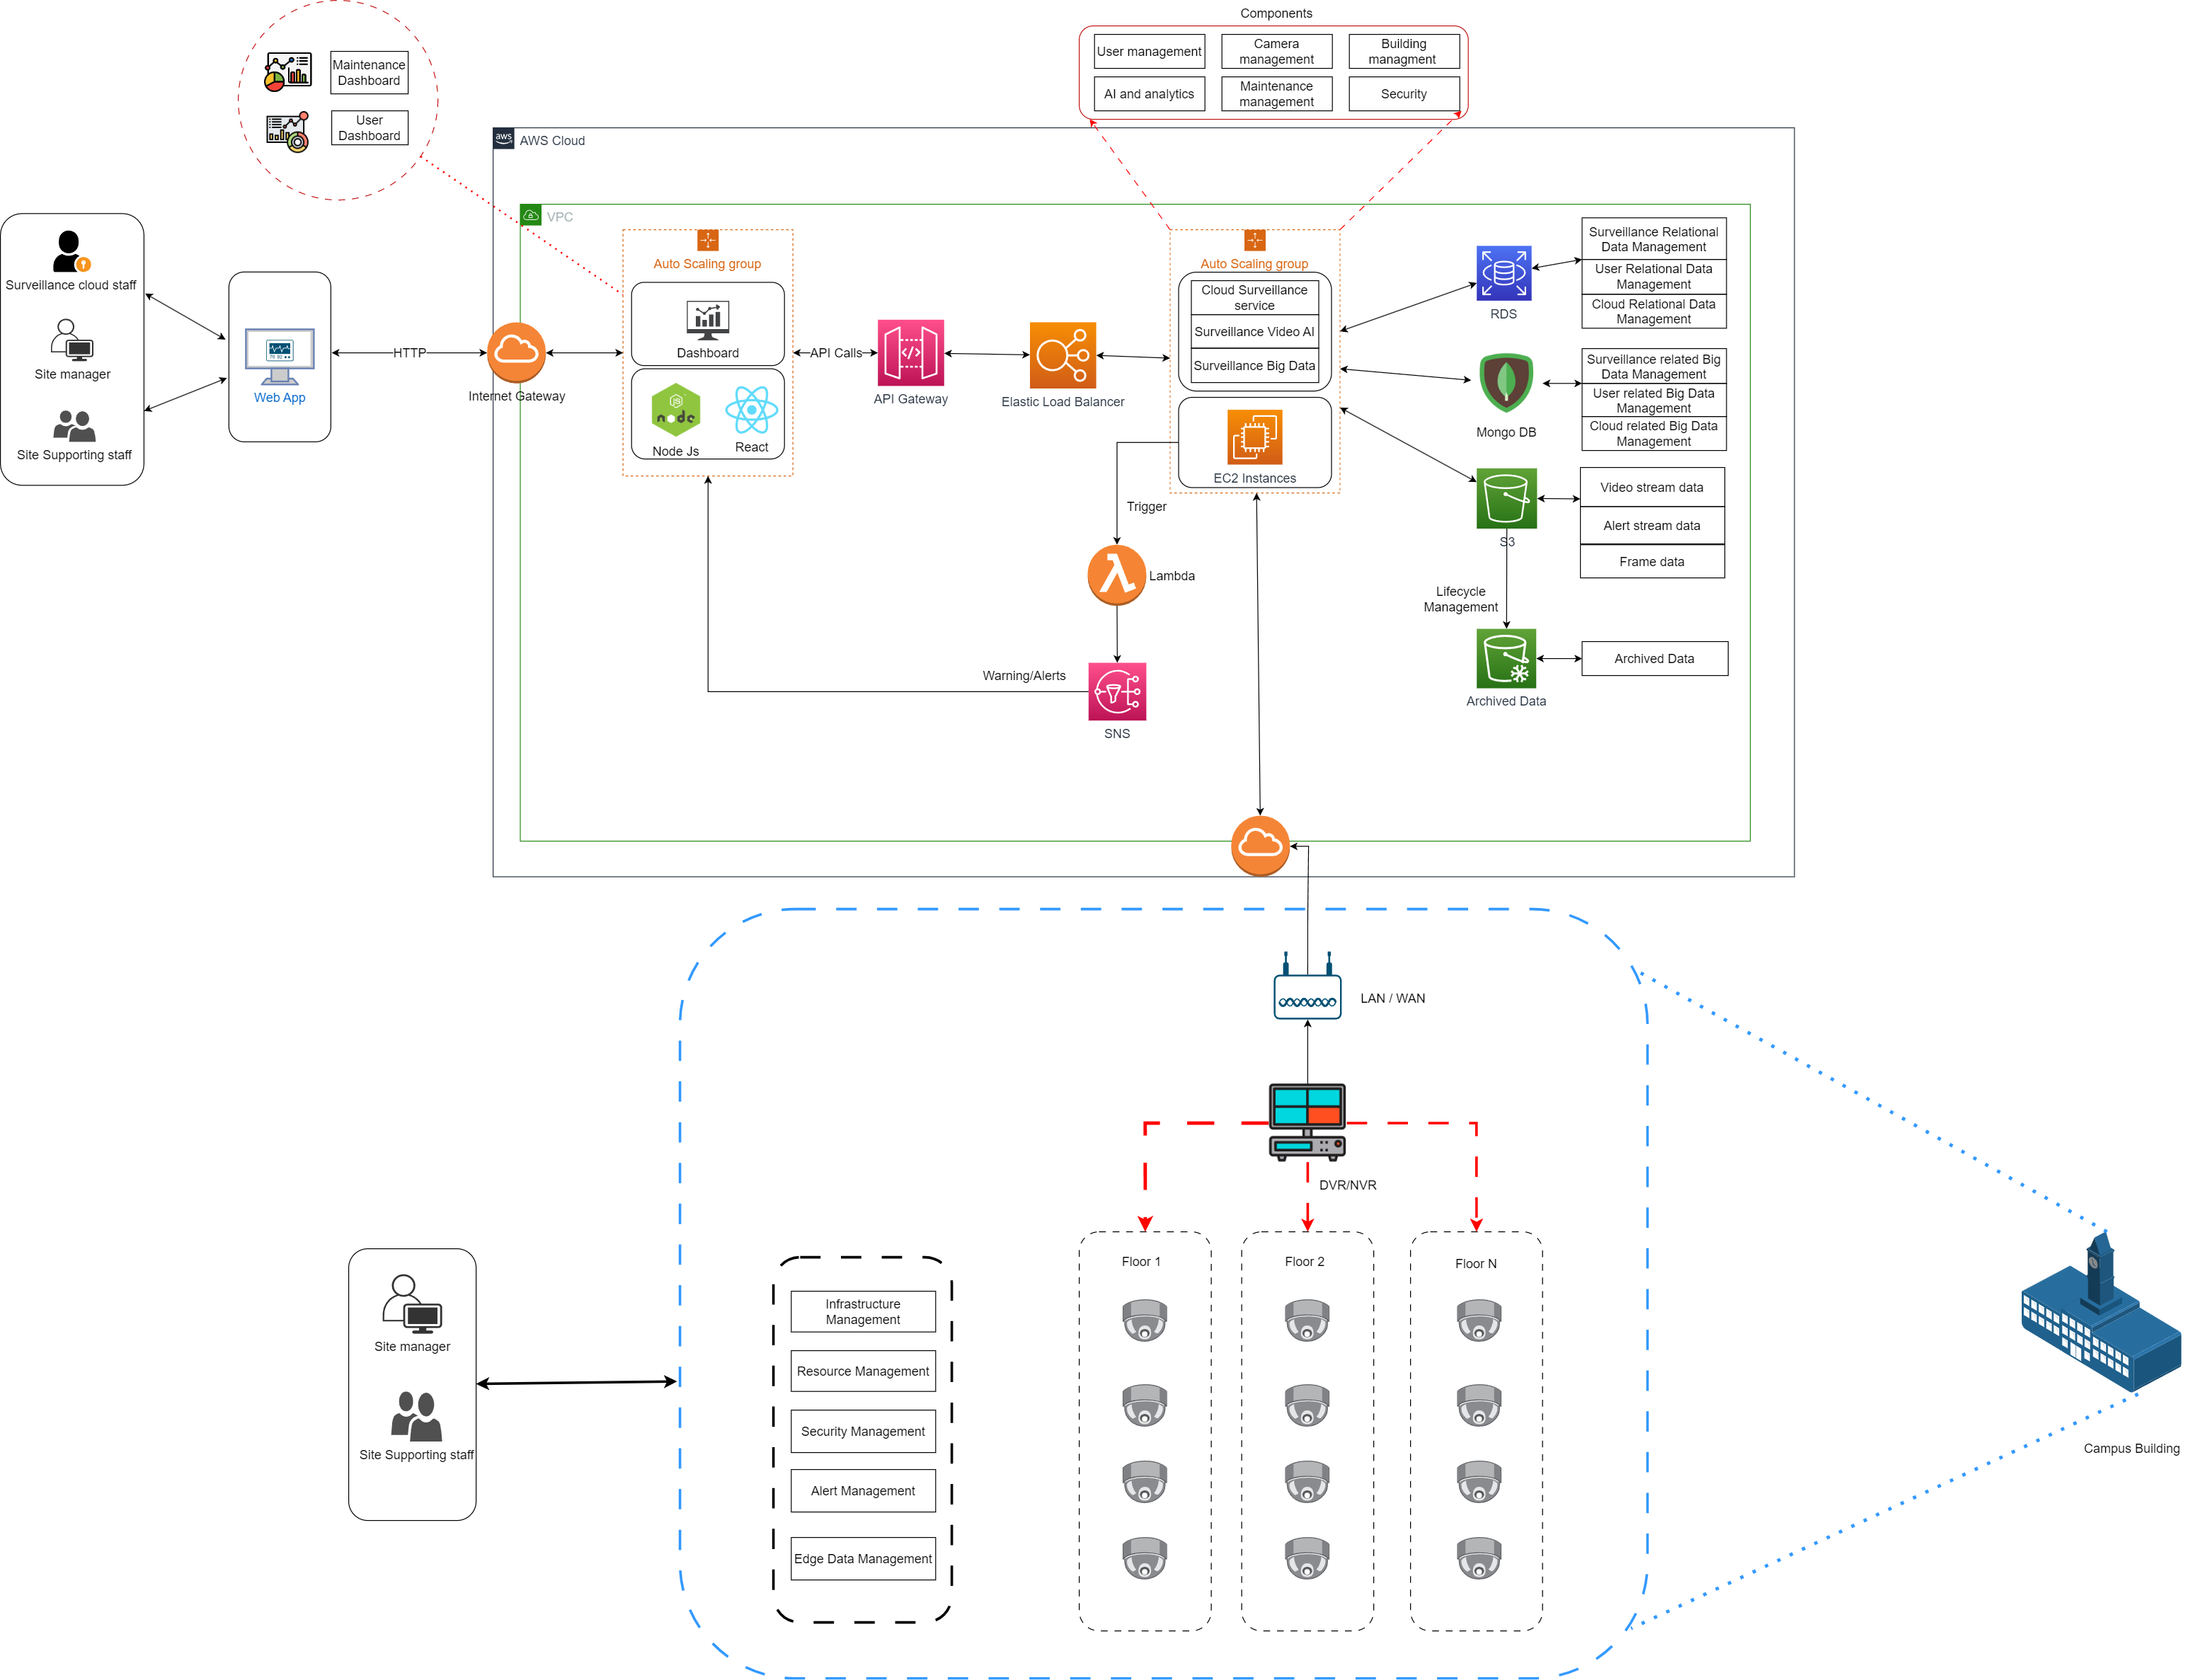
This repository is for a React Dashboard application. The application is a Camera surveillance dashboard that allows its users to hook live streams from their IP Cameras to the dashboard. The application is a fully managed software powered by AI that supports multiple anomaly detection including but not limited to arson, robbery, theft and illegal dumping.
The application is hosted on AWS through AWS amplify, which utilizes AWS resources under one umbrella. And on the backend uses CloudFormation to deploy the stack.
The user login systems is made using AWS Cognito user pools. A private user pool is setup in AWS Cognito, various parameters are set that are application specific. An image of the login screen is shown below:
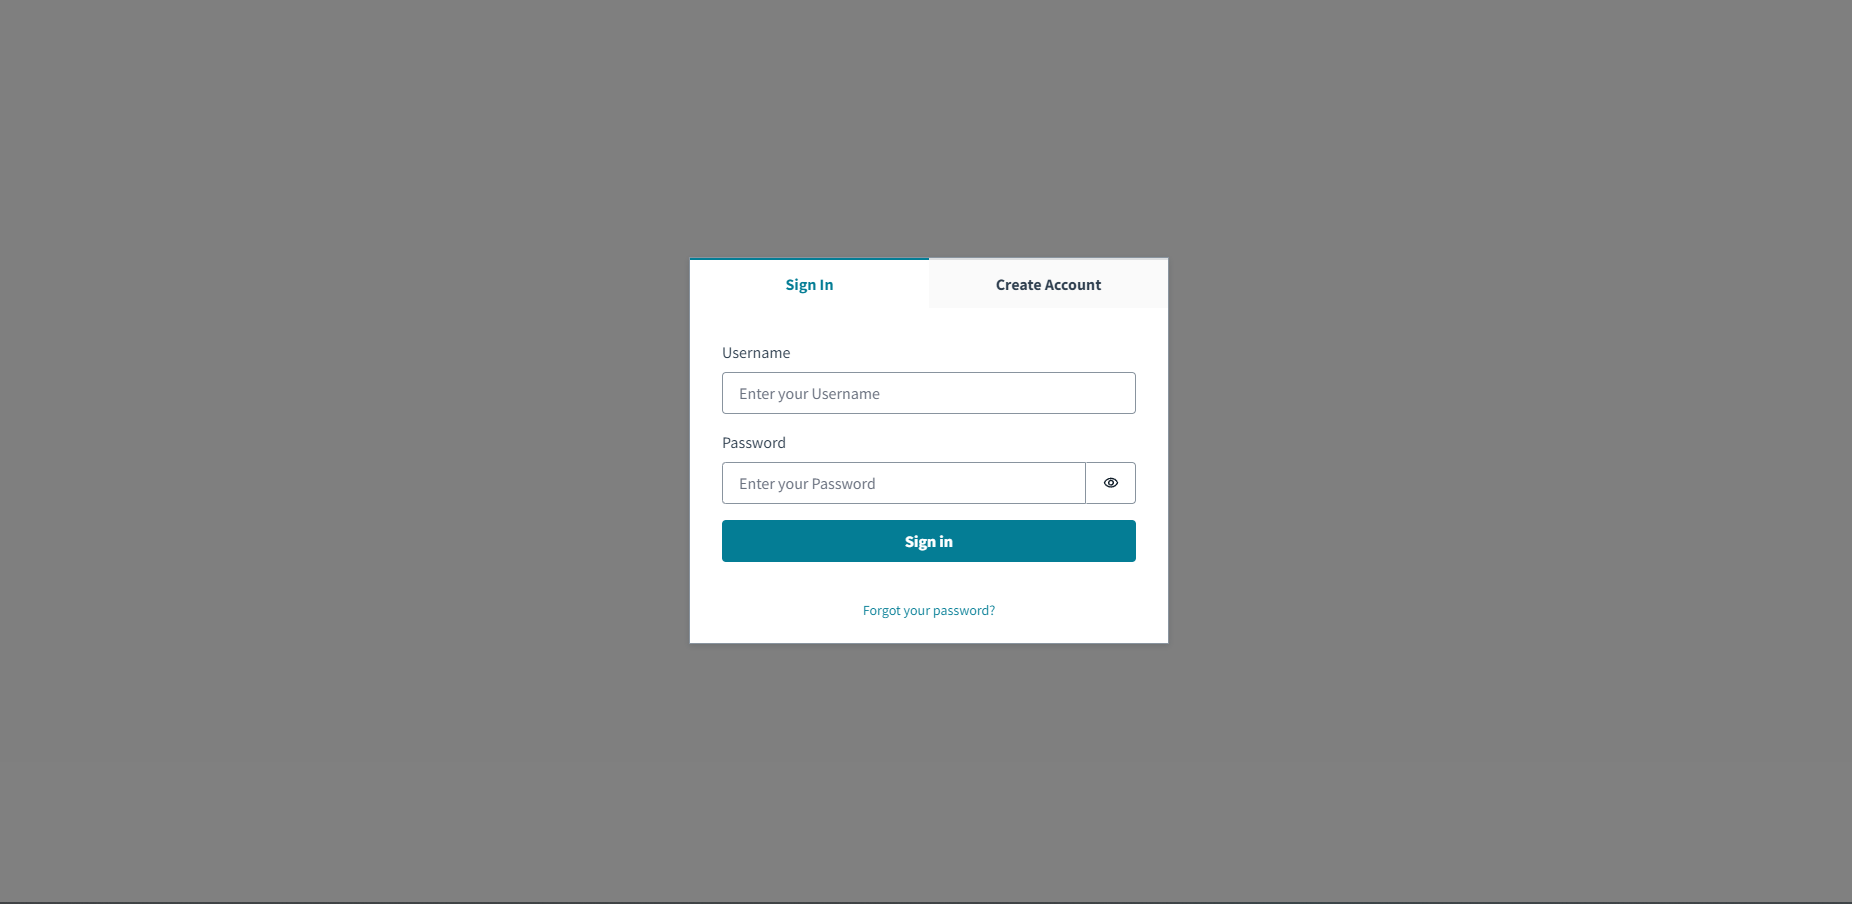
Fig.1 Login page
The user signup function has been turned off, and a user cannot be created from outside the application. The user when logs in, its credentials are checked against the users credentials in the Cognito user pool.
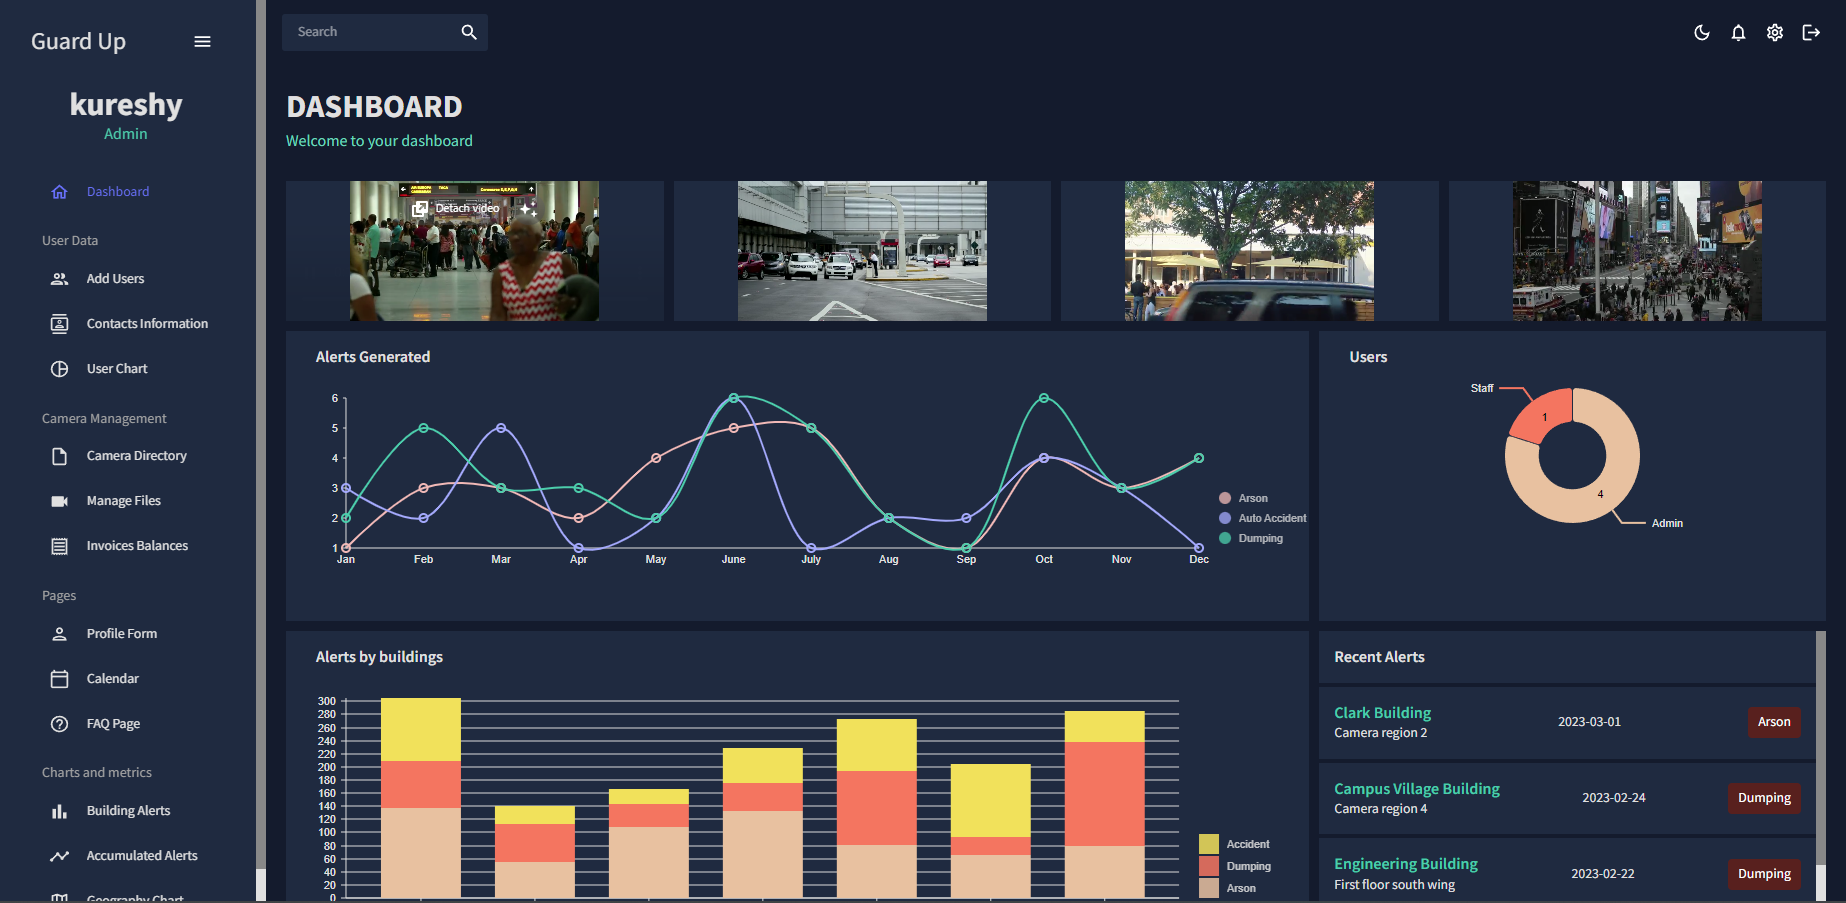
Fig.2 Dashboard dark mode
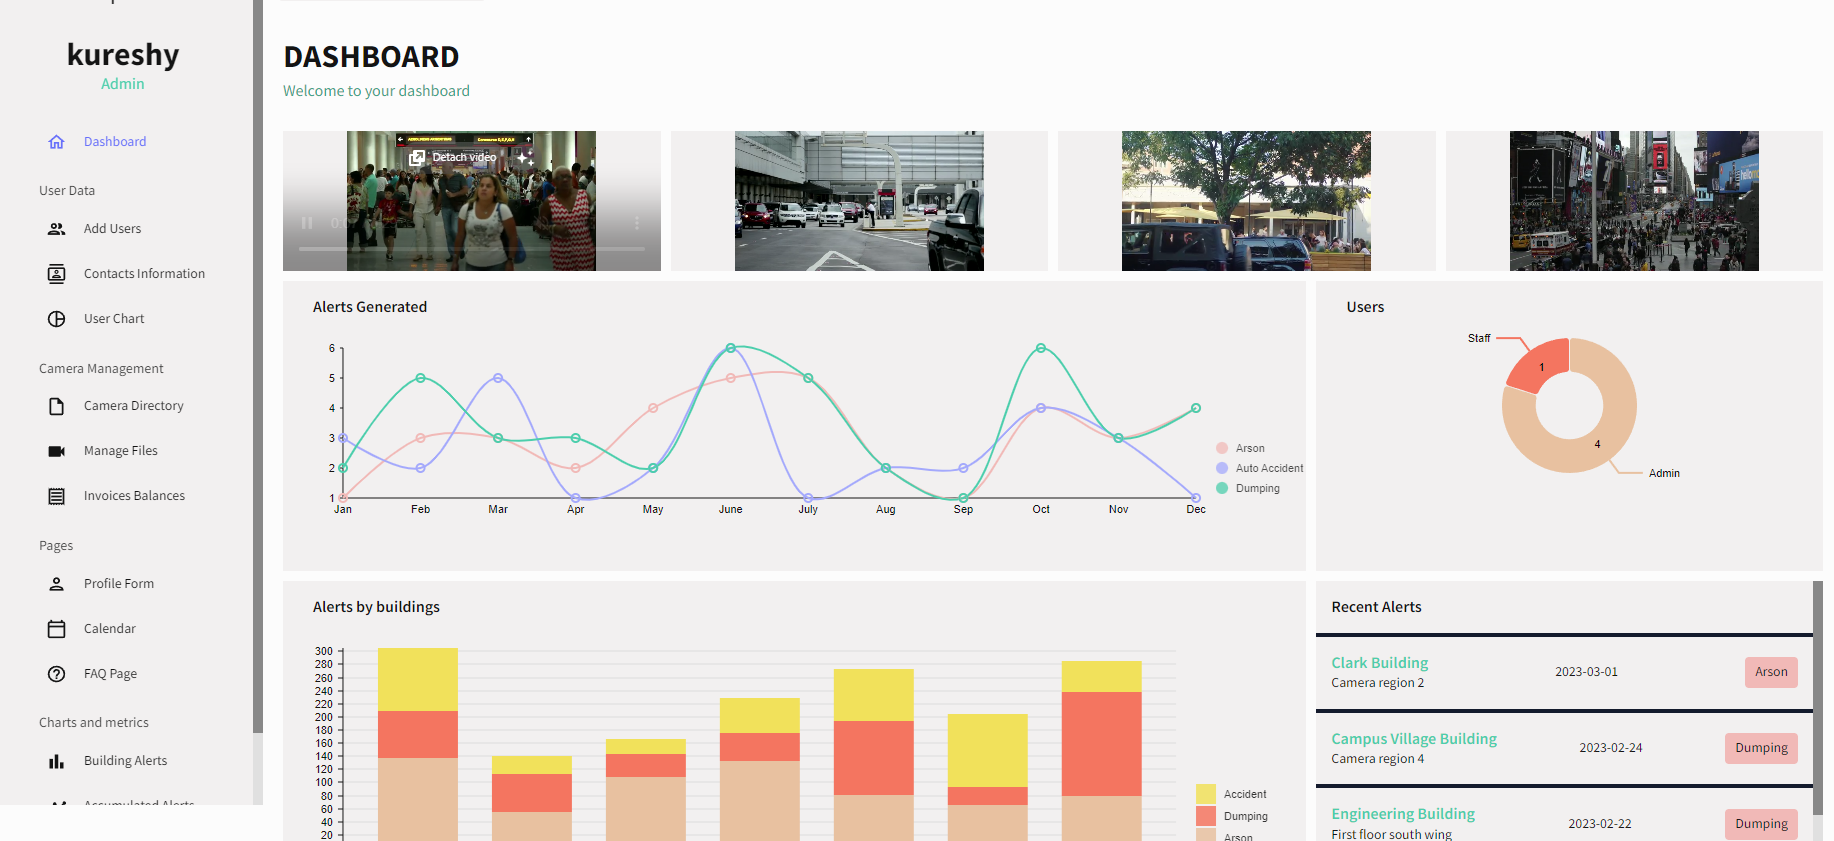
Fig.2 Dashboard light mode
The dashboard is made up of multiple UI components, they are enumerated below:
- Top bar: The top bar is made using material UI, it ha various elements, there is a search bar on the left side, and couple of buttons for various operations on the right side. The options include logging out, toggling dark mode, light mode, settings and alerts. An image of top bar is shown in figure 3.

Fig.3 Topbar
- Sidebar: is a collapsible sidebar with different menu items, the user name and user clearance level for easy view is shown on the sidebar. The Sidebar is made using react sidebar and material UI. An image of the sidebar is shown below in figure 4.

Fig.4 Sidebar
- Video feeds: for simulation purposes, 4 static video sources have been added on the dashboard for the user to view, in essence they imitate live video feeds coming from IP cameras that are meant to be monitored. The video cards are shown in figure 5.
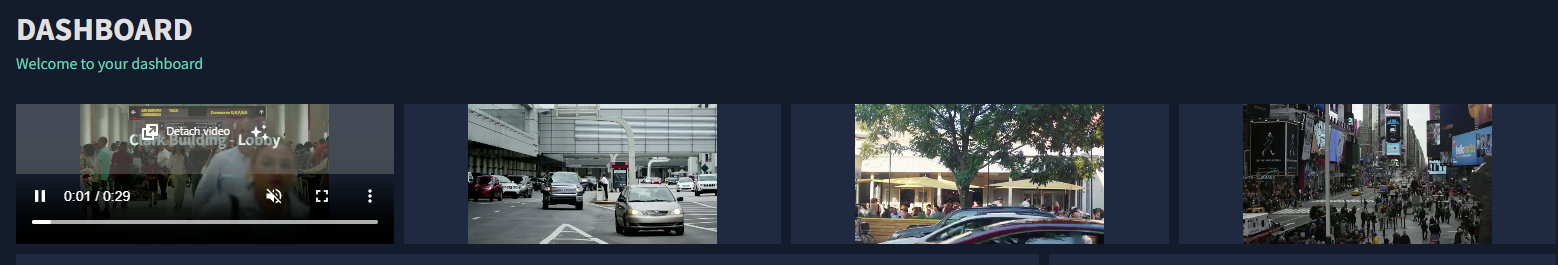
Fig.5 video feeds
- User chart: the user chart is a dynamic chart which shows the number of users that have access to the dashboard. Two types of users are authorized to work on the application and their permissions vary accordingly. The information displayed is dynamic and is queried and displayed from the user pool. The user chart is shown in figure 6.
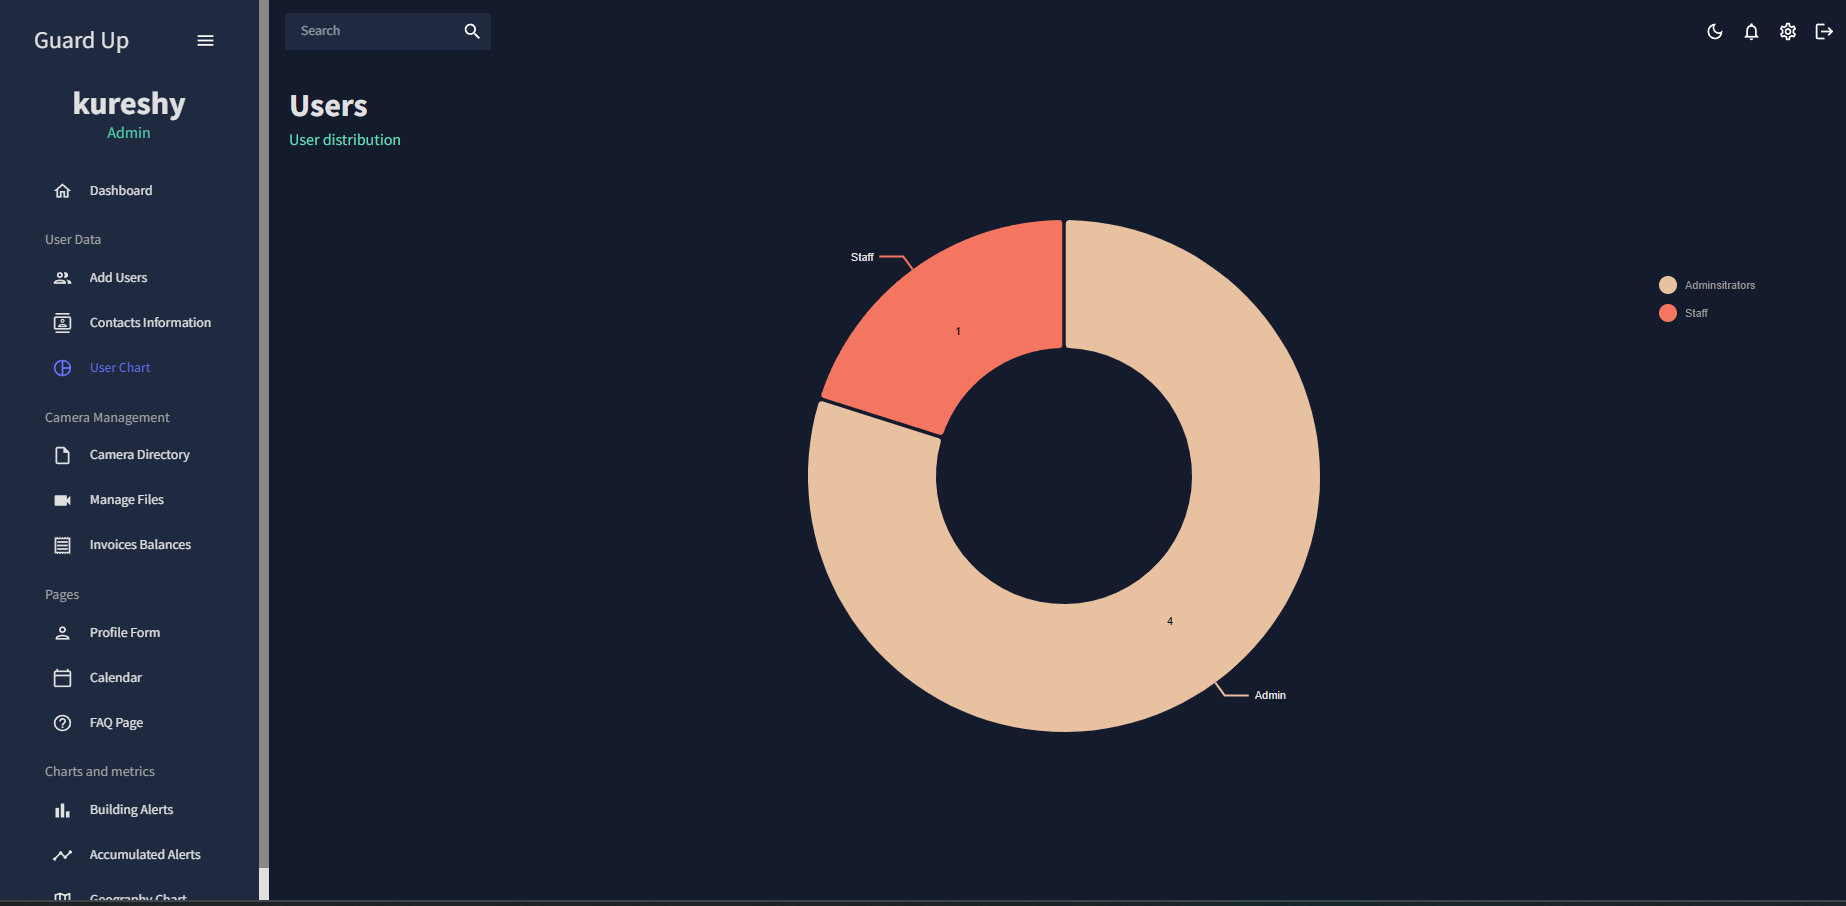
Fig.6 User chart
- Alert generated chart: The alerts generated chart compiles the alerts accrued over the year, it represents the count of these alerts separated by months, the graph is dynamic and the number of alerts can be queried when the mouse is hovered over the graph. An image of this graph can be seen in the figure below.
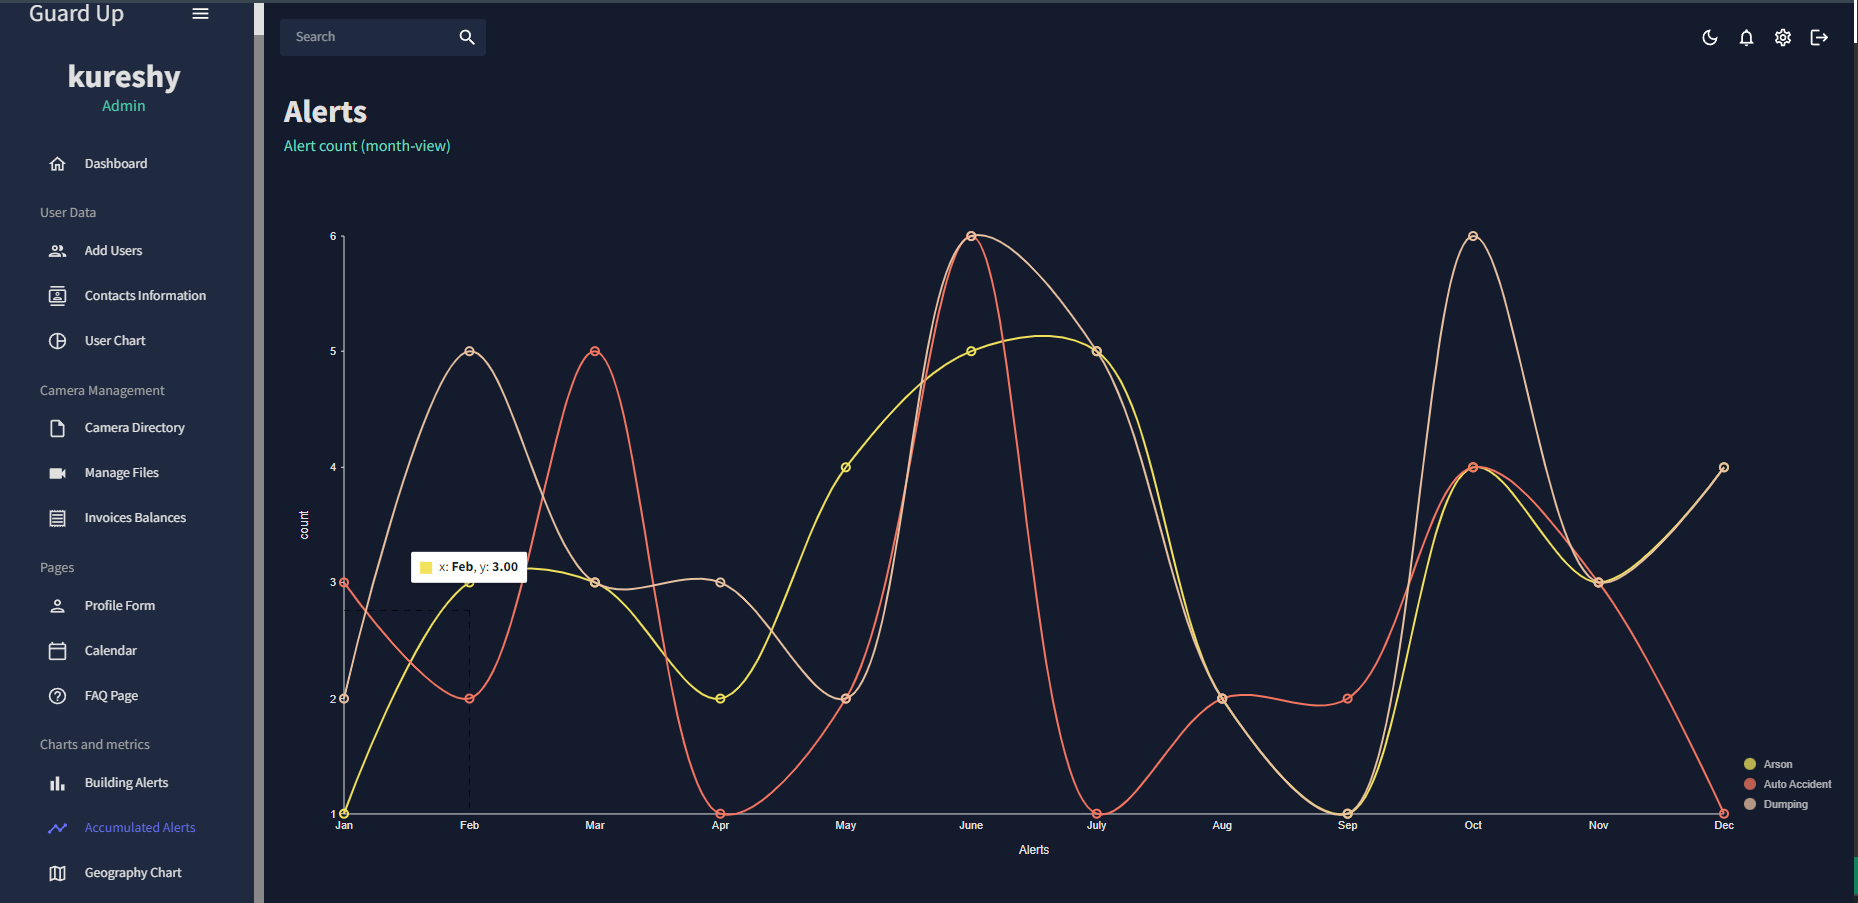
Fig 8. Alerts generated graph
- Recent alerts component: the recent alerts component presents the latest alerts recorded, it gives the name of the building/are the alert was recorded in, the camera name that captured the event, a time stamp and the alert type that was detected. A figure below shows the recent alert component.

Fig 9. Recent alerts
- Alerts by buildings chart: the alerts by building charts compiles all the number of alerts generated separated by the building/area the alert was recorded at. It also presents a count of the particular alert. For the moment only three alert classes have been used that include: Arson, Dumpling and motor accident. The graph is dynamic and the number of alerts can be queried when the mouse is hovered over the graph. An image below shows the graph.
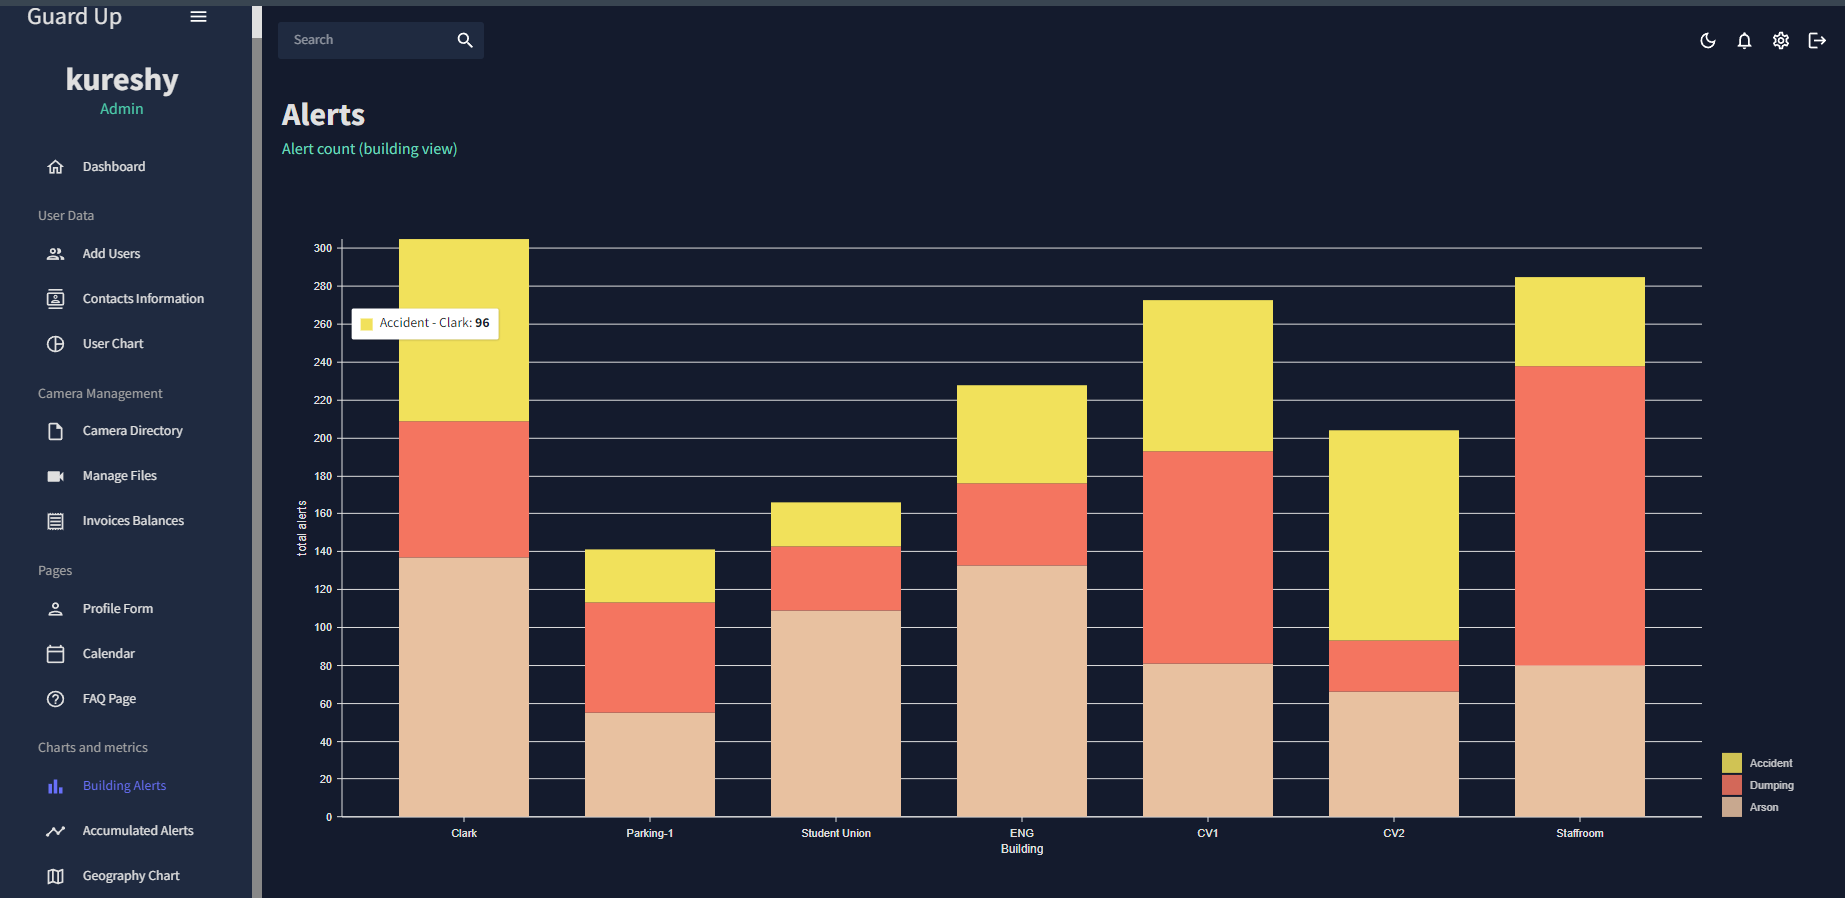
Fig 10. Alerts (count represented by buildings)
- Create User component: The create user component is used for creating users, it can be accessed through the side bar. The application is set as such that only “Admin” users can create new users. The user can only be created from inside the application, and anyone cannot signup to use the service. For signing up the following are required:
- User name
- User email
- User password
- Clearance level i.e. if the user is a admin or not. If the user is not an admin it will automatically be assigned staff level clearance. Once the user has been created, the created user will receive a secret code that they can use to access the application. An image of the component is shown below.
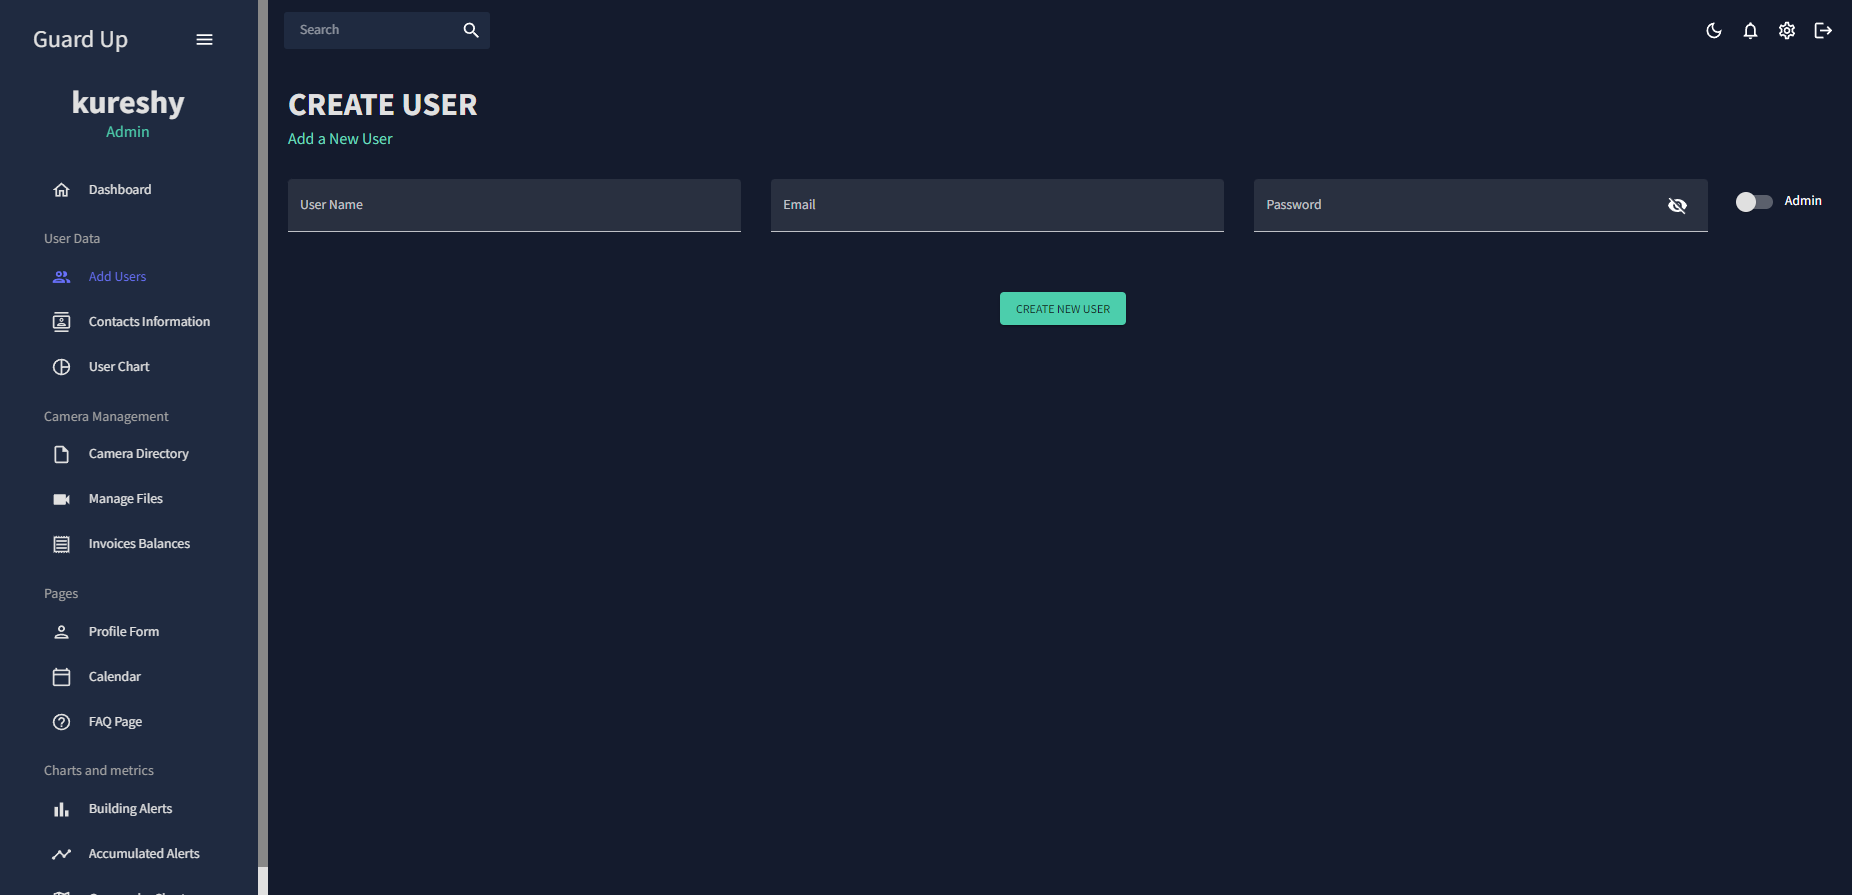
Fig. 11 Create user component
- Users component: This component displays the active application users in the form of a table, the users name, email address, status and clearance level is shown in this component. Only admin level users can delete other users. The staff level user does not have delete privileges. A confirm delete prompt is shown when a user is to be deleted. An image of the user’s component is shown below.
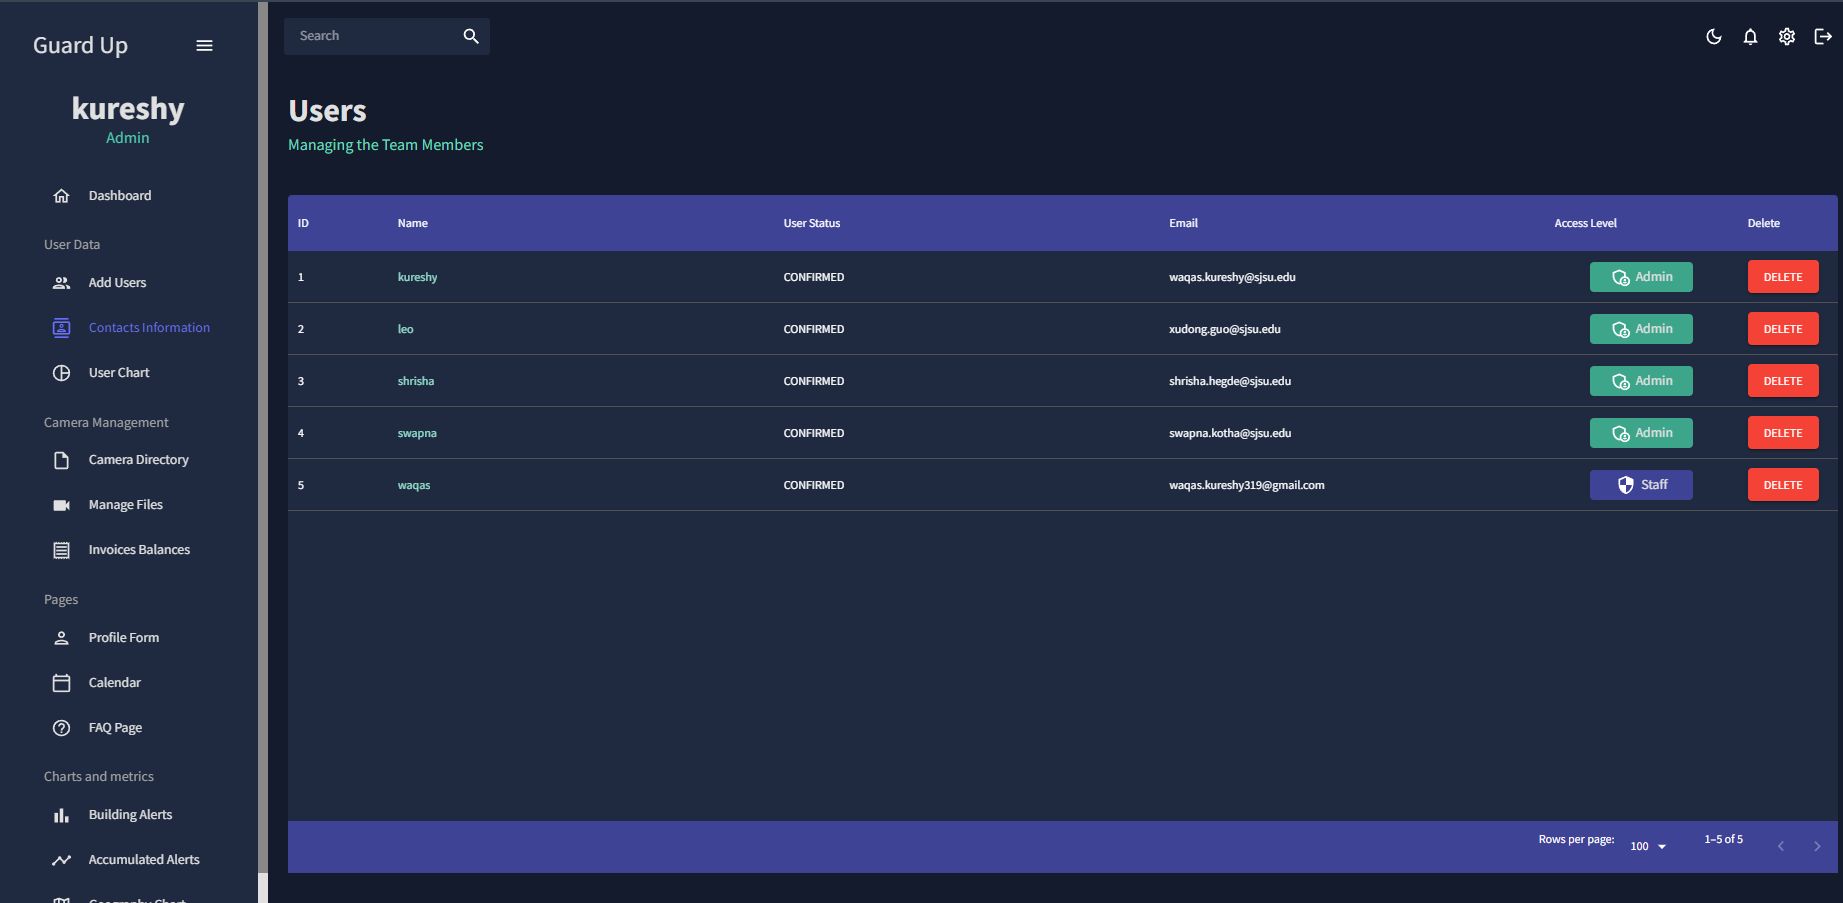
Fig 12. User table
- Calendar: the calendar component is added to show the alerts generated by the date; the alert was encountered. This component is not yet complete as the backend still need a little working. The calendar component is shown below.
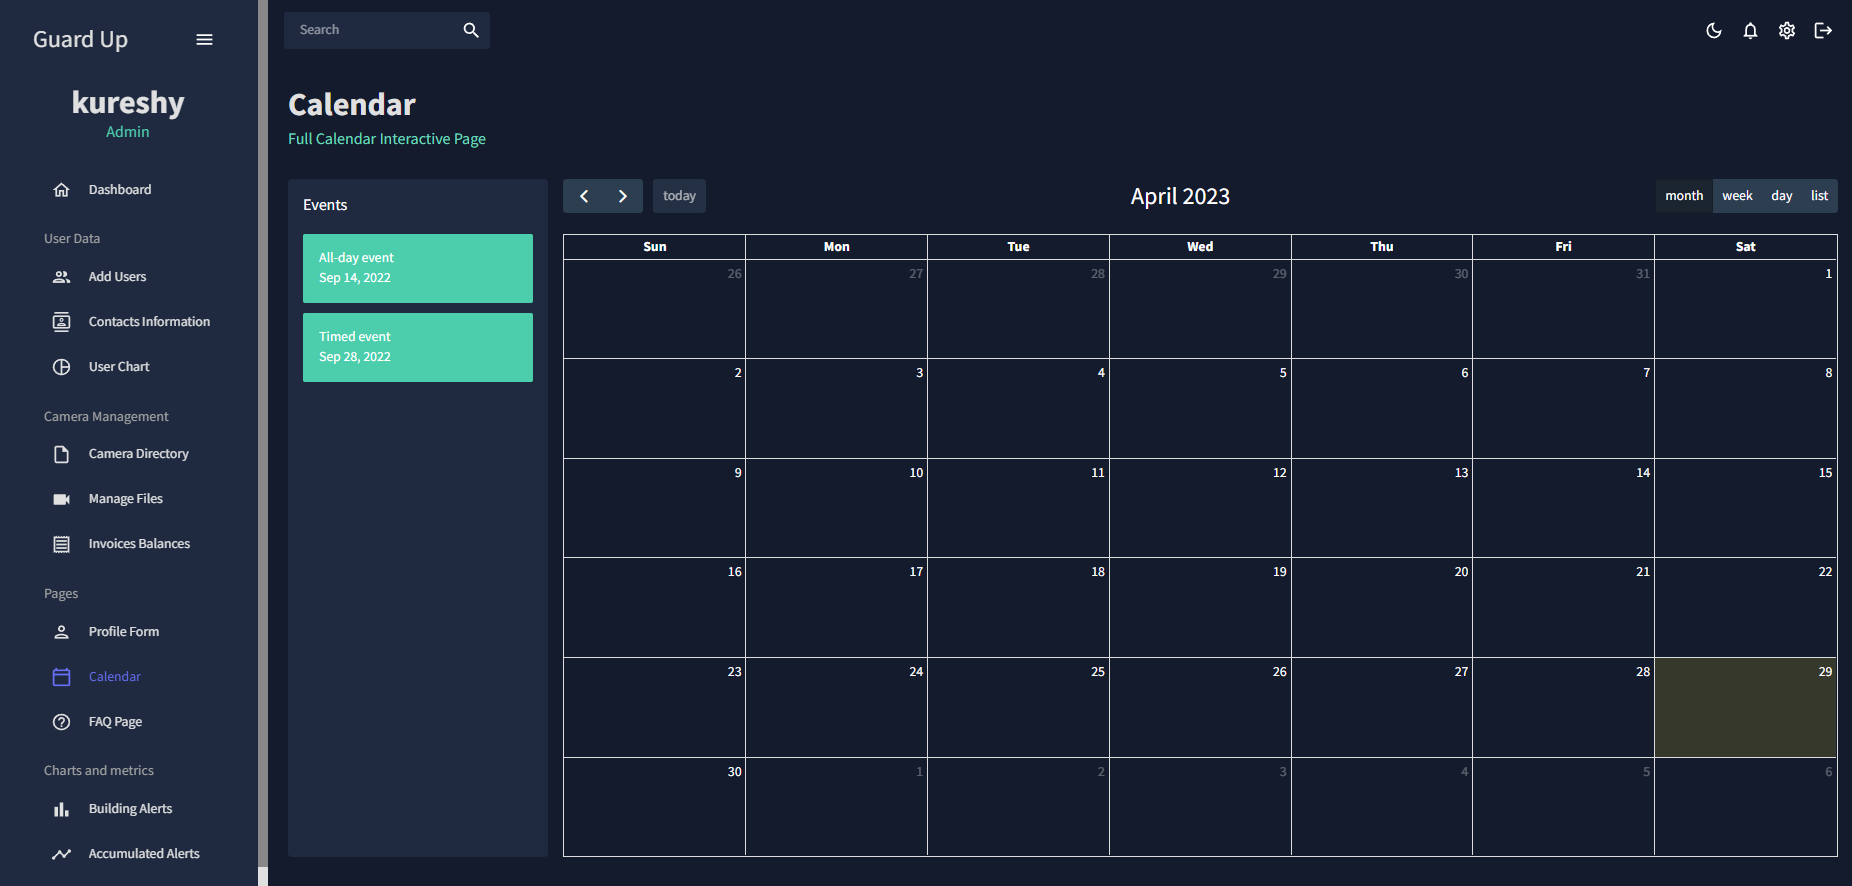
Fig 13. Calendar component
- Charts and graphs: All charts and graphs in full form with all the detailed axis and legends, that are displayed on the dashboard can be viewed independently and they can be accessed through the side bar menu.


