Git Product home page Git Product logo

readgssi's Introduction

readgssi

Copyleft πŸ„― 2017-2022

Example Radargram

PyPI version DOI License Build Status Documentation Status Downloads per month conda version

This program was written to read and process ground-penetrating radar files from instruments made by Geophysical Survey Systems Incorporated (GSSI), although I have no affiliation with nor endorsement for the afforementioned organization.

The demands of ice- and ground-penetrating radar (GPR) surveying, as in many types of scientific fieldwork, require that both quality control and time savings are critical to a successful field campaign. This software provides a way to quickly read, process, and display radar data produced by GSSI radar antennas and control units. readgssi was designed to be used in the field to quality-check entire folders of data files by converting radar profiles to portable network graphics (PNG) images, saving users valuable time versus performing the equivalent actions by hand in RADAN, especially in the case of projects with large file counts.

readgssi has the capability to read DZT and DZG files with the same pre-extension name and plot the data contained in those files. readgssi is also currently able to translate most DZT files to CSV and numpy binary (see future). The file read parameters are based on GSSI's DZT file description, similar to the ones available on pages 55-57 of the SIR-3000 manual. File structure is, unfortunately, prone to change at any time, and although I've been able to test with files from several systems, I have not encountered every iteration of file header yet. If you run into trouble, please create a github issue.

Full documentation, including a tutorial, is available at https://readgssi.readthedocs.io.

Questions, feature requests, and bugs: please open a github issue. Kindly provide the error output, describe what you are attempting to do, and attach the DZT/DZG file(s) causing you trouble.

requirements

Strongly recommended to install via anaconda:

Install via pip:

installation

Once you have anaconda running, installing is pretty easy.

You can install via the anaconda cloud:

conda create -n readgssi -c iannesbitt readgssi
# and then activate by doing:
conda activate readgssi

or via pip/PyPI:

conda config --add channels conda-forge
conda create -n readgssi python==3.7 pandas h5py pytz obspy
conda activate readgssi
pip install readgssi

That should allow you to run the commands below.

installing from source:

If you choose to install a specific commit rather than the latest working release of this software, you may download this package, unzip to your home folder, open a command line, then install in the following way:

pip install ~/readgssi

usage

To display the help text:

$ readgssi -h

usage:
readgssi -i input.DZT [OPTIONS]

required flags:
     OPTION     |      ARGUMENT       |       FUNCTIONALITY
-i, --input     | file:  /dir/f.DZT   |  input DZT file

optional flags:
     OPTION     |      ARGUMENT       |       FUNCTIONALITY
-o, --output    | file:  /dir/f.ext   |  output file. if not set, will be named similar to input
-f, --format    | string, eg. "csv"   |  output format (CSV and DZT are the only working formats currently available from the command line)
-p, --plot      | +integer or "auto"  |  plot size. will be x inches high or "auto". default: 10. see also -D to set DPI
-D, --dpi       | positive integer    |  set the plot DPI for figure making. defaults to 150
-T, --titleoff  |                     |  turn the plot title off (useful for figure making)
-x, --xscale    | string, eg. "dist"  |  x units. will attempt to convert the x-axis to distance, time, or trace units based on header values
-z, --zscale    | string, eg. "time"  |  z units. attempt to convert the x-axis to depth, time, or sample units based on header values
-e, --zoom      | list of +int [LRUD] |  set a zoom to automatically jump to. list order is [left,right,up,down] and units are the same as axis
-n, --noshow    |                     |  suppress matplotlib popup window and simply save a figure (useful for multi-file processing)
-c, --colormap  | string, eg. "Greys" |  specify the colormap (https://matplotlib.org/users/colormaps.html#grayscale-conversion)
-g, --gain      | positive float      |  gain constant (higher=greater contrast, default: 1)
-A, --absval    |                     |  Displays the absolute value of the vertical gradient of the array when plotting. Good for displaying faint array features.
-r, --bgr       | +integer or zero    |  horizontal background removal (useful to remove ringing). zero=full width; positive=window size (after stacking)
-R, --reverse   |                     |  reverse (flip array horizontally)
-w, --dewow     |                     |  trinomial dewow algorithm
-t, --bandpass  | +int-+int (MHz)     |  triangular FIR bandpass filter applied vertically (positive integer range in megahertz; ex. 70-130)
-b, --colorbar  |                     |  add a colorbar to the radar figure
-a, --antfreq   | positive integer    |  set antenna frequency. overrides header value
-s, --stack     | +integer or "auto"  |  set trace stacking value or "auto" to autostack to ~2.5:1 x:y axis ratio
-N, --normalize |                     |  distance normalize; reads .DZG NMEA data file if it exists; otherwise tries to read CSV with lat, lon, and time fields
-P, --pausecorr |                     |  pause correction; fixes decoupling of DZG and DZT trace numbers during survey pauses using low velocity GPS marks
-d, --spm       | positive float      |  specify the samples per meter (spm). overrides header value
-m, --histogram |                     |  produce a histogram of data values
-E, --epsr      | float > 1.0         |  user-defined epsilon sub r (sometimes referred to as "dielectric") if set, ignores value in DZT header
-Z, --zero      | +int or list of int |  timezero: skip samples before direct wave. samples are removed from the top of the trace. use list for multi-channel

naming scheme for exports:
  CHARACTERS    |      MEANING
    Ch0         |  Profile from channel 0 (can range from 0 - 3)
    Dn          |  Distance normalization
    Tz233       |  Time zero at 233 samples
    S8          |  Stacked 8 times
    Rv          |  Profile read in reverse (flipped horizontally)
    Bgr75       |  Background removal filter with window size of 75
    Dw          |  Dewow filter
    Bp70-130    |  triangular FIR filter applied from 70 to 130 MHz
    G30         |  30x contrast gain
    Abs         |  Color scale represents absolute value of vertical gradient
    Z10.20.7.5  |  zoom from 10-20 axis units on the x-axis and 5-7 on the z-axis

From a unix command line:

readgssi -i DZT__001.DZT

Simply specifying an input DZT file like in the above command (-i file) will display a host of data about the file including:

  • name of GSSI control unit
  • antenna model
  • antenna frequency
  • samples per trace
  • bits per sample
  • traces per second
  • L1 dielectric as entered during survey
  • sampling depth
  • speed of wave at given dielectric
  • number of traces
  • number of seconds

basic functionality

CSV output

readgssi -i DZT__001.DZT -o test.csv -f CSV

Translates radar data array to CSV format, if that's your cup of tea. One might use this to export to Matlab. One CSV will be written per channel. The script will rename the output to 'test_100MHz.csv' automatically. No header information is included in the CSV.

readgssi -i DZT__001.DZT -s 8 -r 0 -o test.csv -f CSV

Applies 8x stacking, and background removal filters before exporting to CSV (see explanations below).

DZT output (experimental)

readgssi -i DZT__001.DZT -R -Z 0 -o test.DZT -f DZT

This exports the array as a second DZT file after reversing the direction of the survey line.

The following operations will stick when writing files:

  • stacking
  • filtering
  • distance normalization
  • reversing direction
  • zero (top of array will be shaved off; to avoid this, set -Z 0. this will be fixed in the future.)
  • manually setting header values, ror example samples per meter (-d 10), epsilon_r (-E 3.1), and antenna frequency (-a 100)

The following operations will not stick:

  • absolute value of gradient
  • gain
  • zoom
  • plot features like axis units (obviously)

Please note the following about DZT output:

  • While DZTs will be written, there will be no accompanying DZX written. This functionality may be implemented in the future but for now is a bit too complex of an operation for readgssi. This could have consequences if you're planning to re-import to RADAN after this operation.
  • Single channel files only are supported at this time. Multi-channel files will be written but the values on the second channel will not be correct. If you wish to use readgssi to re-write multiple channels, you will have to separate the channels using RADAN or another software first.

numpy object output

readgssi -i DZT__001.DZT -o test.npy -f numpy

This command will save the array in numpy binary format. Header information will not be saved, however.

GPRPy-compatible output

readgssi -i DZT__001.DZT -o test -f gprpy

This command saves the array in numpy binary format, and preserves the header as a JSON file as well. GPRPy will soon support importing this type of file.

plotting

example 1A: without gain

readgssi -i DZT__001.DZT -o 1a.png -p 5 -s auto

The above command will cause readgssi to save and show a plot named "DZT__001c0Tz233S6G1.png" with a y-size of 5 inches at 150 dpi (-p 5) and the autostacking algorithm will stack the x-axis to some multiple of times shorter than the original data array for optimal viewing on a monitor, approximately 2.5*y (-s auto). The plot will be rendered in the gray color scheme. Example 1a

example 1B: with gain

readgssi -i DZT__001.DZT -o 1b.png -p 5 -s auto -g 60 -r 75

This will cause readgssi to create a plot from the same file, but matplotlib will save the plot as "1b.png" (-o 1b.png). The script will plot the y-axis size (-p 5) and automatically stack the x-axis to (-s auto). The script will plot the data with a gain value of 50 (-g 50), which will increase the plot contrast by a factor of 50. Next readgssi will run the background removal (-r 75) filter. (To apply this horizontal background removal filter across the entire line horizontally, use -r 0. More about this in examples 2b and 2c.) Example 1b

example 1C: display the vertical axis in meters and manually set the Epsilon_r

readgssi -i DZT__001.DZT -o 1c.png -p 5 -s auto -g 60 -r 75 -z m -E 80

This will set the Epsilon_rβ€”that is, the relative permittivity of the first layer mediumβ€”to 80 (-E 80) and the Z axis to meters (-z m). The resulting plot will have a depth scale in meters. Epsilon_r should be set in the header, but if it is set incorrectly, this is the way to adjust it on the fly. Example 1c

example 1D: make a high-quality figure

readgssi -i DZT__001.DZT -o 1d.png -p 5 -s auto -g 60 -r 75 -z m -E 80 -T -D 300

Okay, now our figure looks great and we want to put it in a publication! Time to turn off the title (-T) and pump up the DPI to printer quality (-D 300). For AGU poster-quality images, you may even need -D 600. One tricky thing to keep in mind is that the smaller the plot size (-p) the larger the relative size of the text in the figure. Example 1d

example 1E: changing colormaps and gain settings

readgssi -i DZT__001.DZT -o 1e.png -p 5 -s auto -g 20 -r 75 -z m -E 80 -c seismic

Here, a horizontal background removal is applied, but gain is turned down (-g 20). The script uses matplotlib's "seismic" colormap (-c seismic) which is specifically designed for this type of waterfall array plotting. Even without gain, you will often be able to easily see very slight signal perturbations. Given its use of red, however, it is not terribly colorblind-friendly for either of the two most common types of human colorblindness, which is why it is not used as the default colormap. Example 1e

example 1F: absolute value of vertical gradient

readgssi -i DZT__001.DZT -o 1f.png -p 5 -s auto -g 100 -r 75 -z m -E 80 -c gray_r -A -t 80-120

While we're on the topic of colormaps, it's worth pointing out that you can tell readgssi to calculate the vertical derivative (the "gradient") of the profile and display its absolute value using the -A flag. This gradient display is a good way to highlight areas of polarity change regardless of positive or negative values. It is particularly useful for highlighting glacial bed material through ice, for example. Here (in a lake profile) we set both -A to plot the absolute value of vertical gradient and also a FIR filter (-t 80-120) explained below. We also set the colormap to the reverse of the usual one (-c gray_r) so that black indicates high values. Example 1f

filtering

Each of the plots in this section is displayed with a histogram to illustrate changing array values.

example 2A: no background removal

readgssi -i DZT__002.DZT -o 2a.png -p 5 -s auto -g 30 -m

Sometimes, files will look "washed out" due to a skew relative to the mean of the data. This is easily correctable. Here readgssi will create a plot of size 5 and stack 5x (-p 5 -s 5). Matplotlib will use the default "gray" colormap and save a PNG of the figure, but the script will suppress the matplotlib window (using the -n flag, useful for processing an entire directory full of DZTs at once). Finally, the -m flag will draw a histogram for each data channel. Note how the histogram changes when filters are applied. Example 2a Example 2a histogram

example 2B: horizontal mean BGR algorithm applied

The flag to get rid of the skew (or any horizontally uniform noise) is -r, also known as background removal or BGR for short. -r has two modes, one set by -r 0 and one set when the option after the -r flag is greater than zero. When this BGR option is zero, the program simply subtracts the average of each profile row from the array. When it's greater than 0, readgssi will implement a moving window mean, the size of which is set in post-stack traces (see example 2C).

The command below does the same thing as example 2A, except -r 0 applies full width horizontal mean background removal to the profile. Note the difference in ringing artifacts and skew between examples 2a and 2b.

readgssi -i DZT__002.DZT -o 2b.png -p 5 -s auto -g 30 -m -r 0

Example 2b Example 2b histogram

example 2C: moving window horizontal mean

readgssi -i DZT__002.DZT -o 2c.png -p 5 -s auto -g 30 -m -r 75

Same as above but with a 75-trace wide moving window mean (-r 75). This width represents post-stack traces. This is, for all intents and purposes, the same as RADAN's "BOXCAR" method of horizontal noise removal, but much, much faster because it's implemented with scipy. Areas beyond the left and right edges are treated as zeros. Notice that the noise in the water column is nearly entirely wiped out, but real data is extended with lateral wisps the size of half of the window, which is a side-effect of this method. Note that the histogram (-m) has a fairly even distribution around the mean, which generally indicates that the image should be fairly readable.

Example 2c Example 2c histogram

example 2D: vertical triangular FIR filter

readgssi -i DZT__002.DZT -o 2d.png -p 5 -s auto -g 30 -m -t 80-120

This function is functionally the same as RADAN's vertical triangular FIR filter, but again implemented with scipy. It is used to filter out unwanted frequencies on a per-shot basis, which makes it very effective as a profile cleaning tool. The most effective results are achieved by filtering a tight window of frequencies around the center frequency of the antenna you are using. In this case, we are using a 100 MHz antenna and filtering from 80-120 MHz.

Example 2d Example 2d histogram

example 2E: combining filters for a cleaner profile

readgssi -i DZT__002.DZT -o 2e.png -p 5 -s auto -g 30 -m -r 75 -t 80-120

In this example, we use two concurrent filters (the horizontal windowed BGR and the vertical triangular FIR) to try and clean the image up as much as possible without overcooking it.

Example 2e Example 2e histogram

array manipulation

example 3A: (without) distance normalization

The default behavior of readgssi is to plot the X-axis in survey time units (seconds). This can be changed using the -x flag. To display in distance units, you must either have GPS information in DZG format, or specify the number of radar traces per meter using the -d flag. -d 24 -x meters will change the traces per meter value in the header to 24.0 and display the profile with distance in meters along the X-axis.

Files with GPS information are handled in a slightly different way. First, readgssi will read a DZG file to create an array of distance information associated with marks in the DZT. (NOTE: If your project was recorded without DZG files but you have per-line GPS mark information in GPX format, please look at gpx2dzg for a method of creating a DZG file for each survey line) After reading the DZG, the program will expand or contract the GPR array based on the speed over ground between GPS points. It will then modify the traces per meter value from the header and display the profile with distance on the X-axis.

Here a file is processed and displayed without distance normalization:

readgssi -i DZT__003.DZT -o 3a.png -p 5 -s auto -r 0 -g 60

Example 3a

example 3B: distance normalization using a DZG file

To use DZG GPS information to distance normalize the profile and display in meters traveled, use the -N and -x meters flags. readgssi will normalize the file in chunks to reduce memory usage. Here is the same file with distance normalization applied:

readgssi -i DZT__003.DZT -o 3b.png -p 5 -s auto -r 0 -g 60 -N -x meters

Example 3b

example 3c: reverse line direction

A simple but sometimes necessary operation is flipping a survey line back to front in order to display it congruently with others in a set. This can be done easily using -R.

Example 3b

advanced usage

UNIX users have a distinct advantage of being able to easily process entire folders full of DZTs with a simple command. Users who wish to do this should read up on how to construct for loops in Bash or simply follow and modify these examples below.

processing all files in a folder

This command makes use of the ls function in Bash, which lists all files that match a specific pattern. In this case, we want the pattern to be "any DZT file," which ends up being simply ls *.DZT (the * symbol is a wildcard, meaning it matches any set of characters, so in this case it would match both FILE____005.DZT and test.DZT but not Test01.dzt because the .DZT is case sensitive.).

for f in `ls *.DZT`; do readgssi -p 8 -n -r 0 -g 40 -Z 233 -z ns -N -x m -s auto -i $f; done

The structure of this command is easy to understand if you know a little bit about for loops. This command loops over every file with the extension .DZT (ls *.DZT where * indicates a wildcard) and assigns the filename to the f variable on each loop. Then, after the semicolon, bash runs readgssi for every pass of the loop. In this case, the parameters are:

-p 8    # plot with size 8
-n      # suppress the matplotlib window; useful if you do not want the operation interrupted by plot windows
-r 0    # full-width background removal
-g 40   # gain of 40
-Z 233  # time zero at 233 samples
-z ns   # display the depth axis in nanoseconds
-N      # distance-normalize the profile
-x m    # display the x-axis in meters
-s auto # apply automatic stacking
-i $f   # recall the `f` variable containing this loop's filename and feed it to the input flag of readgssi

Finally, end the loop by closing the command with a linebreak ;, and the done marker.

processing specific sets of files

You can make the command even more specific by further modifying the set of files returned by the ls command. For example:

for f in `ls FILE__{010..025}.DZT`; do readgssi -p 8 -n -r 0 -g 40 -Z 233 -z ns -N -x m -s auto -i $f; done

This command will process only the 16 files in the numeric sequence between and including 010 and 025 in the set (FILE__010.DZT, FILE__011.DZT, ..., FILE__025.DZT). bash handles the zero padding for you as well. Pretty cool.

contributors

citation suggestion:

Ian M. Nesbitt, François-Xavier Simon, Thomas Paulin, 2018. readgssi - an open-source tool to read and plot GSSI ground-penetrating radar data. doi:10.5281/zenodo.1439119

known bugs:

  • scipy 1.2.x causes errors when filtering. use scipy 1.3.0 to avoid.

future

  • automatic script testing for smoother dev
  • create a class for surveyline objects, similar to obspy.core.trace.Trace
  • GPS transcription from CSV with fields like mark name, lon, lat, elev, time
  • ability to use GPS altitude to adjust z position across profile
  • ability to ground truth depths as horizontal lines
  • GUI-based geologic/dielectric layer picking
    • layer velocity calculation (using minimum of clustered hyperbola tail angle measurements, or manual input)
    • velocity-based depth adjustments
    • ability to incorporate ground truth measurements
  • velocity gradient/angle of incidence-based array migration
  • translation to common geophysical formats (HDF5, SEGY, etc.)
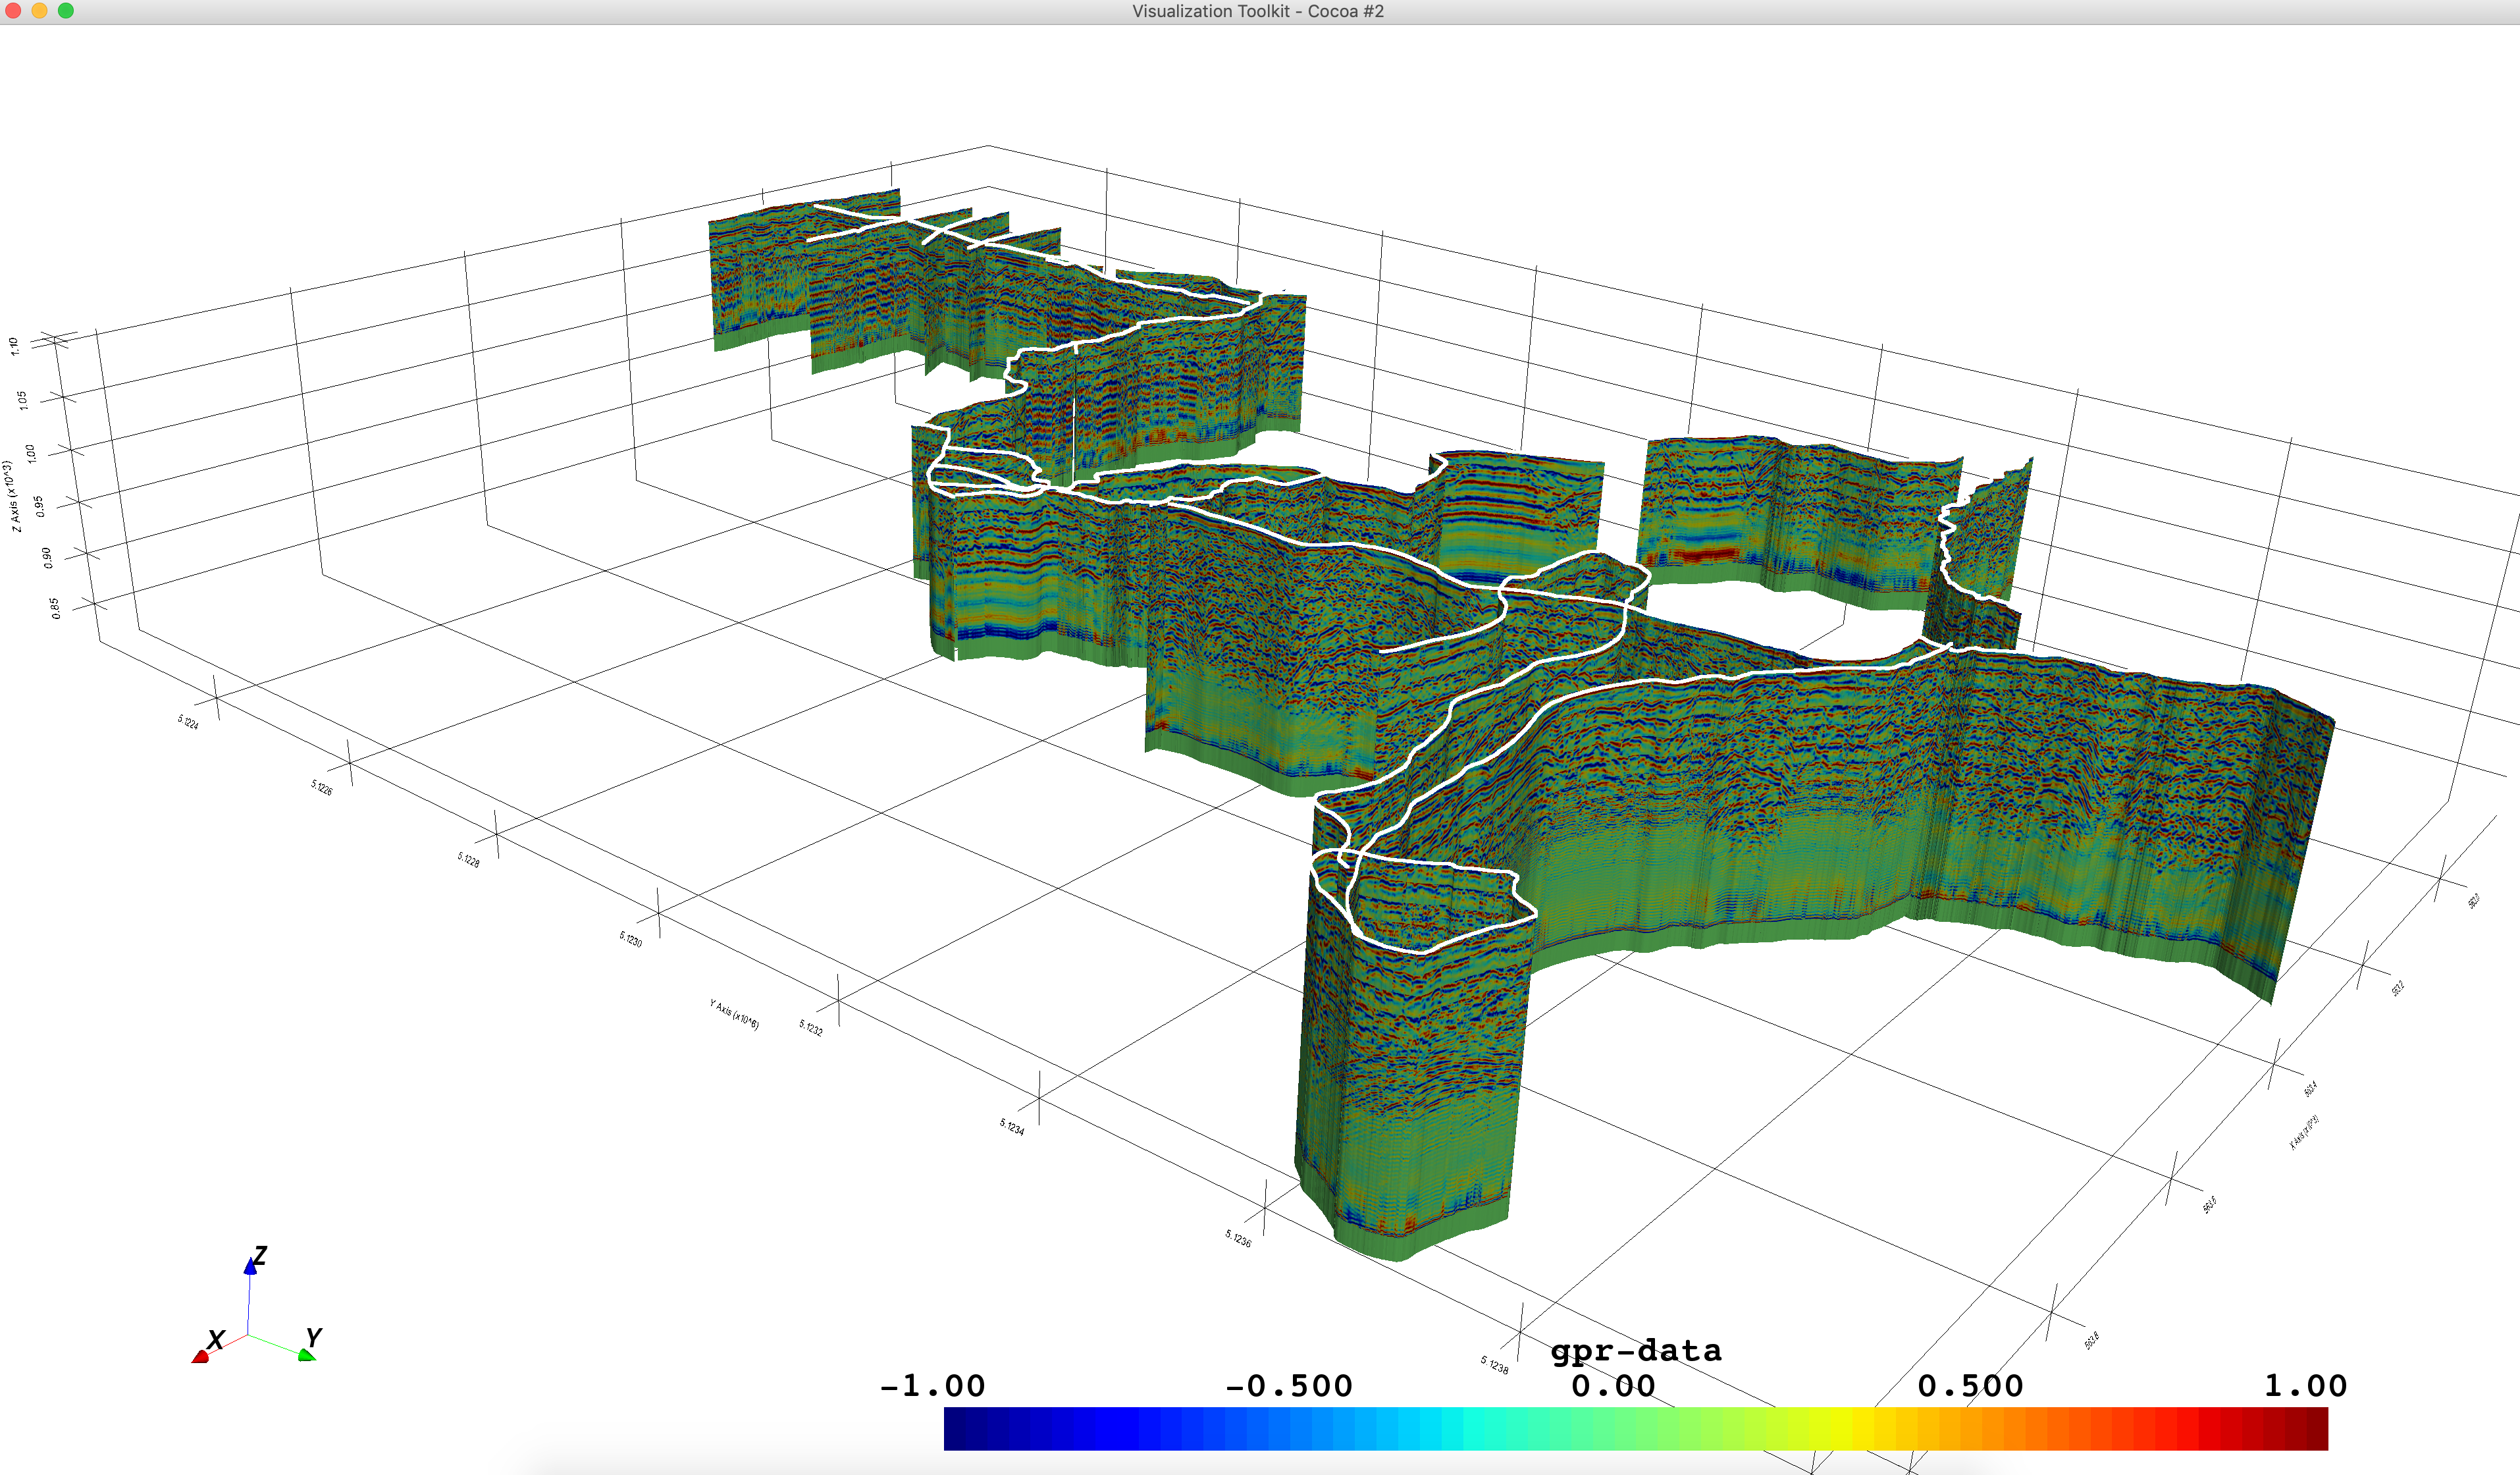
  • integration with vista for 3D visualization of location-aware arrays

readgssi's People

Contributors

felippehsk avatar fxsimon avatar iannesbitt avatar teshaw avatar thomaspaulin avatar

Stargazers

 avatar  avatar  avatar  avatar  avatar  avatar  avatar  avatar  avatar  avatar  avatar  avatar  avatar  avatar  avatar  avatar  avatar  avatar  avatar  avatar  avatar  avatar  avatar  avatar  avatar  avatar  avatar  avatar  avatar  avatar  avatar  avatar  avatar  avatar  avatar  avatar  avatar  avatar  avatar  avatar  avatar  avatar  avatar  avatar  avatar  avatar  avatar  avatar  avatar  avatar  avatar  avatar  avatar  avatar  avatar  avatar  avatar  avatar  avatar  avatar  avatar  avatar  avatar  avatar  avatar  avatar  avatar  avatar  avatar

Watchers

 avatar  avatar  avatar  avatar  avatar  avatar  avatar  avatar  avatar  avatar

readgssi's Issues

Crash report - probable antenna frequency issue

Error below:

2020-04-01 21:59:05 - readgssi 0.0.16
2020-04-01 21:59:05 - reading...
2020-04-01 21:59:05 - input file:         RADARDATA/PROJECT1.PRJ/FILE__001.DZT
Traceback (most recent call last):
  File "/home/gssi/anaconda3/envs/readgssi/lib/python3.7/site-packages/readgssi/dzt.py", line 133, in readdzt
    header['antfreq'][chan] = ANT[header['rh_antname'][chan]]
KeyError: 'none'

During handling of the above exception, another exception occurred:

Traceback (most recent call last):
  File "/home/gssi/anaconda3/envs/readgssi/bin/readgssi", line 8, in <module>
    sys.exit(main())
  File "/home/gssi/anaconda3/envs/readgssi/lib/python3.7/site-packages/readgssi/readgssi.py", line 462, in main
    spm=spm, epsr=epsr, title=title, zoom=zoom)
  File "/home/gssi/anaconda3/envs/readgssi/lib/python3.7/site-packages/readgssi/readgssi.py", line 79, in readgssi
    r = readdzt(infile, gps=normalize, spm=spm, epsr=epsr, verbose=verbose)
  File "/home/gssi/anaconda3/envs/readgssi/lib/python3.7/site-packages/readgssi/dzt.py", line 137, in readdzt
    header['antfreq'][chan] = int("".join(takewhile(str.isdigit, header['rh_ant'][chan].replace('D5','').replace('D6','')))) # hoping this works
ValueError: invalid literal for int() with base 10: ''

DZT_DZX 1-3.zip

rh_system and rh_version are not properly read

the versioning and system byte (byte offset 113 in header) is not read properly.

readgssi/readgssi/dzt.py

Lines 154 to 155 in 72b5e78

header['rh_version'] = ord(vsbyte) >> 5 # whether or not the system is GPS-capable, 1=no 2=yes (does not mean GPS is in file)
header['rh_system'] = ord(vsbyte) >> 3 # the system type (values in UNIT={...} dictionary above)

must be changed to:

    header['rh_version'] = int('{0:08b}'.format(ord(vsbyte))[::-1][:3], 2) # whether or not the system is GPS-capable, 1=no 2=yes (does not mean GPS is in file)
    header['rh_system'] = int('{0:08b}'.format(ord(vsbyte))[::-1][3:], 2) # the system type (values in UNIT={...} dictionary in constants.py)

"Greys" colormap flips polarity

BWB is rendered as WBW! How could I not have noticed this before...

Switching to "gray" colormap, which renders polarity properly, provides extra contrast, and shifts the mid-level brightness down...all probably good things.

.DZT Example and help

Hello Ian. I'm working with some vintage seismic data which was scanned very poorly and save as tiff images. I was advised to look into treating them as gpr data to analyze the depths but have not been able to convert them into .dzt format. My plan was to work through your examples but I see the .dzt file are not available. Is it possible that you give me access to them? I would also like to know if I can use one of the files to alter the header and use my numpy data to get it to display.

Your help in this will be greatly appreciated.

My email address is [email protected]

readgssi thinks samples per meter is negative in this command?

For some reason, this command yields a "must be positive" error like below, but ends up processing the file just fine.

$ readgssi -p 4 -x cm -z cm -g 3 -d 161 -i ./File____009.DZT 
2019-06-20 22:32:51 - ERROR: samples per meter must be positive
2019-06-20 22:32:51 - readgssi 0.0.12
2019-06-20 22:32:51 - reading...
2019-06-20 22:32:51 - input file:         ./File____009.DZT
2019-06-20 22:32:51 - success. header values:
2019-06-20 22:32:51 - system:             StructureScan Mini (system code 7)
2019-06-20 22:32:51 - antennas:           ['SS MINI', None, None, None]
2019-06-20 22:32:51 - ant 0 frequency:    1600 MHz
2019-06-20 22:32:51 - date created:       2017-04-08 08:40:22+00:00
2019-06-20 22:32:51 - date modified:      (never modified)
2019-06-20 22:32:51 - gps-enabled file:   no
2019-06-20 22:32:51 - number of channels: 1
2019-06-20 22:32:51 - samples per trace:  256
2019-06-20 22:32:51 - bits per sample:    32 signed
2019-06-20 22:32:51 - traces per second:  300.0
2019-06-20 22:32:51 - traces per meter:   161.00 (manually set - value from DZT: 393.70)
2019-06-20 22:32:51 - epsr:               8.0
2019-06-20 22:32:51 - speed of light:     1.06E+08 m/sec (35.35% of vacuum)
2019-06-20 22:32:51 - sampling depth:     0.4 m
2019-06-20 22:32:51 - "rhf_top":          0.0 m
2019-06-20 22:32:51 - offset to data:     1024 bytes
2019-06-20 22:32:51 - traces:             1131
2019-06-20 22:32:51 - seconds:            3.77000000
2019-06-20 22:32:51 - array dimensions:   256 x 1131
2019-06-20 22:32:51 - image stats
2019-06-20 22:32:51 - mean:               -422770.8228959438
2019-06-20 22:32:51 - stdev:              2769389.6223992216
2019-06-20 22:32:51 - lower color limit:  -8730939.690093609 [mean - (3 * stdev)]
2019-06-20 22:32:51 - upper color limit:  7885398.04430172 [mean + (3 * stdev)]
2019-06-20 22:32:51 - xmax: 702.4844720496894 Distance (cm), zmax: 40.63999950885773 Depth at $\epsilon_r$=8.0 (cm)
2019-06-20 22:32:51 - attempting to plot with colormap Greys
2019-06-20 22:32:52 - saving figure as ./File____009c0G3.png
2019-06-20 22:32:52 - showing matplotlib figure...

File____009c0G3

Handling of line pause during collection with GPS input on SIR-4000

Currently (in both RADAN and readgssi) pauses are handled incorrectly. The issue seems to stem primarily from the fact that GPS data collection continues while trace collection is paused. This results in improperly aligned trace numbers between GSSI proprietary NMEA sentences and radar array scan columns, and thus incorrect post-pause pick export locations (in RADAN) and an area of extreme horizontal shortening due to improper distance normalization (in readgssi).

Possible solutions include:

  1. (for readgssi only) auto identification of pauses, based on one or more of the following:
    • system mark location(s) in radar array
    • large misalignment of scan numbers at line end
    • large change in survey speed, followed by resume
  • this would be followed by a scan number shift in readgssi's GPS array
  1. (for both readgssi and RADAN) NMEA scan reassignment
    • a utility that identifies pauses and reassigns scan numbers to NMEA sentences in .DZG files
  • this would require knowing/verifying the end scan number of the radar array

edit: option 2 was implemented

Reduce memory usage in distance normalization

During distance normalization, radar array is expanded all at once, which is untenable for medium (0.1 GB) to large files because the expanded array can exceed the RAM size (speaking from experience). Lines 96 and 99 of arrayops.py (below) are the culprits and should be modified.

ar = np.repeat(ar, norm_vel['normalized'].astype(int, casting='unsafe').values, axis=1)
nvm = int(round(norm_vel['normalized'].mean()))
del norm_vel
ar = reducex(ar, by=nvm, verbose=verbose)

Solution: chunk-ify distance normalization by breaking the original array into int(norm_vel['normalized'].mean()) + 1 parts and tacking each normalized chunk on to a processed array to return. That way, max memory usage should only be ~3x filesize, instead of norm_vel['normalized'].mean() *filesize (which is far too often something extreme like 75x).

This will require a slicing for loop around the np.repeat() and readgssi.arrayops.reducex() functions to build the new array block by block.

How to load gprMax simulation files?

I used a gprMax GSSI simulated output file and gprMax's MATLAB .out to .dzt converter to create a dzt file based on my simulation.

However, when I try to read this file with readgssi -i PATH_TO_FILE.dzt I run into this error:

image

I cannot find similar issues, so I'm posting this one. How can I resolve this?

GSSI 4105NR frequency 2GHz and others

Hello Ian,

I have tried your code to independently convert dzt to CSV files and I was very impressed. Thank you for putting this together and sharing it.

One issue: I am using a GSSI 4105NR air-coupled antenna with a central frequency of 2000MHz. This particular antenna is not included in your dictionary.

Second question: I was able to normalize the distance based on the GPX file. How would you that if you want to normalize based on the DMI file?

Third question: Is it possible to split files in smaller ones based on distance? (Not discussed in the manual)

Thank you in advance for your response.

Eyoab

documentation?

Is documentation for this project in the works? I see there is a Python package - could you all at lease autodoc the API on ReadtheDocs?

Main Function Documentation

Not sure if it says this anywhere in the documentation but the output of the main readgssi.readgssi() function claims to be a numpy array but it is actually a dictonary of numpy arrays with the keys being the channel numbers.

How to get time_range for selected DZT File

Hello,
I'm trying to understand this package, so if you want to read a DZT file you need to type this commande :
hdr, arrs, gps = readgssi.readgssi(infile='COMMON__030.DZT', verbose=True)
after that you get a couple of informations like :

2021-04-23 10:45:41 - traces per second:  110.0
2021-04-23 10:45:41 - traces per meter:   300.0
2021-04-23 10:45:41 - epsr:               1.0
2021-04-23 10:45:41 - speed of wave:      3.00E+08 m/sec (99.99% of vacuum)
2021-04-23 10:45:41 - time range (TWTT):  10.0 ns
2021-04-23 10:45:41 - sampling depth:     1.7 m
2021-04-23 10:45:41 - "rhf_top":          -0.2 m
2021-04-23 10:45:41 - "rhf_depth":        1.5 m
2021-04-23 10:45:41 - offset to data:     1024 bytes
2021-04-23 10:45:41 - traces:             3608
2021-04-23 10:45:41 - seconds:            32.80000000
2021-04-23 10:45:41 - array dimensions:   256 x 3608

my question is how i can acces to this informations, for exemple i want to get time range as a variable and use it in same plotting

Thank you

Unable to read DZG files

When trying to open any GPR transect (DZT file) that has associated GPS info (DZG file), I am unable to read the DZG file info:

$ readgssi -i MI_MANISTEE__021.DZT -p 5
Traceback (most recent call last):
  File "c:\programdata\anaconda3\envs\readgssi\lib\runpy.py", line 193, in _run_module_as_main
    "__main__", mod_spec)
  File "c:\programdata\anaconda3\envs\readgssi\lib\runpy.py", line 85, in _run_code
    exec(code, run_globals)
  File "C:\ProgramData\Anaconda3\envs\readgssi\Scripts\readgssi.exe\__main__.py", line 7, in <module>
  File "c:\programdata\anaconda3\envs\readgssi\lib\site-packages\readgssi\readgssi.py", line 489, in main
    showmarks=showmarks)
  File "c:\programdata\anaconda3\envs\readgssi\lib\site-packages\readgssi\readgssi.py", line 89, in readgssi
    r = readdzt(infile, gps=normalize, spm=spm, start_scan=start_scan, num_scans=num_scans, epsr=epsr, antfreq=antfreq, verbose=verbose)
  File "c:\programdata\anaconda3\envs\readgssi\lib\site-packages\readgssi\dzt.py", line 223, in readdzt
    gps = readdzg(infile_gps, 'dzg', header, verbose=verbose)
  File "c:\programdata\anaconda3\envs\readgssi\lib\site-packages\readgssi\gps.py", line 147, in readdzg
    z0 = array['altitude'].iat[rowgga]
  File "c:\programdata\anaconda3\envs\readgssi\lib\site-packages\pandas\core\indexing.py", line 2025, in __getitem__
    return self.obj._get_value(*key, takeable=self._takeable)
  File "c:\programdata\anaconda3\envs\readgssi\lib\site-packages\pandas\core\series.py", line 986, in _get_value
    return self._values[label]
IndexError: index 11 is out of bounds for axis 0 with size 10

If I copy the DZT file to a new directory and open that then I don't get the out of bounds error. Assuming this is an issue with the reading the DZG file strings.

GPS reading, datetime error

Hey there. I am trying to use certain modules within python to read GPS data.

I'm getting the following error :

dzt.readdzt("TUK_MESSUNGEN_KATALOG_002.DZT")
2023-05-15 16:18:12 - WARNING: no time zero specified for channel 0, defaulting to rh_zero value (1)
2023-05-15 16:18:12 - WARNING: no time zero specified for channel 1, defaulting to rh_zero value (1)
Traceback (most recent call last):
  File "<stdin>", line 1, in <module>
  File "C:\Users\Riedel\.conda\envs\readgssi\lib\site-packages\readgssi\dzt.py", line 306, in readdzt
    gps = readdzg(infile_gps, 'dzg', header, verbose=verbose)
  File "C:\Users\Riedel\.conda\envs\readgssi\lib\site-packages\readgssi\gps.py", line 97, in readdzg
    ts0 = TZ.localize(datetime.combine(msg.datestamp, msg.timestamp)) # row 0's timestamp (not ideal)
  File "C:\Users\Riedel\.conda\envs\readgssi\lib\site-packages\pytz\__init__.py", line 245, in localize
    raise ValueError('Not naive datetime (tzinfo is already set)')
ValueError: Not naive datetime (tzinfo is already set)

According to this:

celery/celery#983

It seems to be a bug?

'1.5/1.6GHz' antenna

from Rahul T:

I'm trying to use your library and I am facing difficulty with a simple thing. The DZT file I have was scanned using frequency 1.5 GHz and I am wondering if there's a way to use the frequency while reading the DZT file.

2021-08-04 12:37:57 - WARNING: could not read frequency for antenna name "'1.5/1.6GHz'"
2021-08-04 12:37:57 - WARNING: trying to use frequencies of 1 MHz (estimated)...
2021-08-04 12:37:57 - more info: rh_ant=['1.5/1.6GHz', None, None, None]
2021-08-04 12:37:57 -            known_ant=[False, None, None, None]

Problem with date and time when reading .DZG file

Hello
I ran into this error for the first time when reading .DZG files:
ValueError: Not naive datetime (tzinfo is already set)

As soon as I move the .DZG files into another directory, the code runs and outputs the .csv files for the GPR data, I'm wondering how to fix this. I've emailed the files to [email protected].
Thank you!

Problem reading a DZT file

Hi,

I try to read a .dzt file from a Structure Scan Mini device from GSSI but I get the following error:

>>> readgssi.readgssi( infile='File001.DZT', outfile='0a.png', frmt=None, zero=0, plotting=True )
Traceback (most recent call last):
  File "/home/wilhem/anaconda3/envs/readgssi/lib/python3.7/site-packages/readgssi/dzt.py", line 133, in readdzt
    header['antfreq'][chan] = ANT[header['rh_antname'][chan]]
KeyError: 'SS MINI #338\n'

During handling of the above exception, another exception occurred:

Traceback (most recent call last):
  File "<stdin>", line 1, in <module>
  File "/home/wilhem/anaconda3/envs/readgssi/lib/python3.7/site-packages/readgssi/readgssi.py", line 79, in readgssi
    r = readdzt(infile, gps=normalize, spm=spm, epsr=epsr, verbose=verbose)
  File "/home/wilhem/anaconda3/envs/readgssi/lib/python3.7/site-packages/readgssi/dzt.py", line 137, in readdzt
    header['antfreq'][chan] = int("".join(takewhile(str.isdigit, header['rh_ant'][chan].replace('D5','').replace('D6','')))) # hoping this works
ValueError: invalid literal for int() with base 10: ''

It seems to me that the program didn't recognize the device

    header['antfreq'][chan] = ANT[header['rh_antname'][chan]]
KeyError: 'SS MINI #338\n'

but I can be wrong.

I cannot upload the file here but I can send it directly to you, if I have your email address

Plots of short lines are tall and thin, and have extra white space

Users may notice that when plotting short lines (a few meters' length) the automatic sizing gets thrown off, and plots are rendered tall and thin, with lots of white space on the top and bottom. See example below. This is a known bug and will be fixed in the next few months. Until then, plots can be resized in the Matplotlib GUI. Sorry for the inconvenience and thanks for your patience.

Affected plots look like this:
image

They should look like this:
image

CSV Export

I used the write to csv function and I had a couple of questions.

I was curious what the raw values in the exported csv in fact are. Are they 32 bit signed integers? From the header that gets created, it appears that they are.

I was also curious if zero represents zero volts with GSSI, would the conversion be a linear one? Or are these power values? It seems to be nowhere in the GSSI documentation about what format these values actually get stored in.

Thank you!

Interoperability with PyVista

This project looks really promising! Next time I'm working on a project with GPR data, I'm going to have to use this!

I saw that this project reads data from the DZT format - correct me if I'm wrong, but those files have XYZ trace locations in the header, right? If this project can read all that data, perhaps we could collaborate on making an interface between this softaware and vista: https://docs.pyvista.org for 3D rendering of many GPR lines.

I've done this before and I am envisioning a way to make figures like these with ease:

Screen Shot 2019-05-06 at 2 38 27 PM 1

Not installing

Hi I get the message that it is not installed becouse there is no geopy, but I have installed geopy.
Any idea how to sove this?

C:\Users\armh>conda install -c iannesbitt readgssi
Channels:
 - iannesbitt
 - defaults
Platform: win-64
Collecting package metadata (repodata.json): done
Solving environment: failed

LibMambaUnsatisfiableError: Encountered problems while solving:
  - nothing provides geopy needed by readgssi-0.0.17-py37hd844fa7_0

Could not solve for environment specs
The following package could not be installed
└─ readgssi is not installable because it requires
   └─ geopy, which does not exist (perhaps a missing channel).

Issue plotting the file

Hi Ian,

many thanks for sharing this tool. It is very useful for many of us using gprRadars.

I have one issue and to be honest, I wonder that I'm the first one to point that.
I followed the documentation step by step but when I want to plot the data I get the following error:

>>> from readgssi import readgssi
>>> readgssi.readgssi( infile='metal_pipe_merged.dzt', outfile='09.png', frmt=None, zero=0, plot=6 )
Traceback (most recent call last):
  File "<stdin>", line 1, in <module>
TypeError: readgssi() got an unexpected keyword argument 'plot'

I installed readgssi today. The version is:
readgssi 0.0.16

If I remove the plot argument it works.
Using the BASH command line it plots the radargramm as expected.

Can you solve this issue?

readgssi not reading binary csv radargram file

I converted a dzt file into a csv and ran a PCA on the file, but I wasn't able to reread the edited csv into readgssi.

2024-01-16 23:38:04 - reading...
2024-01-16 23:38:04 - input file:         /content/drive/MyDrive/Link portal/rgssi/09_13_2023_perroot/1600MHz/Processed_Outputs/dzt2csv/5cm_spacing/001.csv
---------------------------------------------------------------------------
IndexError                                Traceback (most recent call last)
<ipython-input-5-3dd721c2cf13> in <cell line: 1>()
----> 1 readgssi.readgssi(infile=r'/content/drive/MyDrive/Link portal/rgssi/09_13_2023_perroot/1600MHz/Processed_Outputs/dzt2csv/5cm_spacing/001.csv', frmt=None, verbose=True, histogram=False,)

1 frames
/usr/local/lib/python3.10/dist-packages/readgssi/dzt.py in readdzt(infile, gps, spm, start_scan, num_scans, epsr, antfreq, verbose, zero)
    204         else:
    205             infile.seek(98 + (MINHEADSIZE*(chan))) # start of antenna bytes for channel n
--> 206         header['dzt_ant'][chan] = infile.read(14)
    207         header['rh_ant'][chan] = header['dzt_ant'][chan].decode('utf-8').split('\x00')[0]
    208         header['rh_antname'][chan] = header['rh_ant'][chan].rsplit('x')[0]

IndexError: list assignment index out of range

pandas frame.append method has been removed

Hi, firstly - thanks for making such a great program!

I was getting the error AttributeError: 'DataFrame' object has no attribute 'append' when running the line
readgssi.readgssi(infile='PROJECT_001.DZT', frmt=None, verbose=True)

and when searching for what might be the problem came across this stackoverflow answer saying that since Pandas 2.0, the frame.append method has been removed.

I've fixed my situation temporarily by downgrading to Pandas 1.5.3 and just wanted to let you know. If I get any time I'll make a pull request with the append method changed to the recommended concat method.

fix for #15 causes mishandling of distance normalization

These lines, put in place to address #15, cause GPS information to be incorrectly applied across the array.

c = np.repeat(c, norm_vel['normalized'].astype(int, casting='unsafe').values[on:on+c.shape[1]], axis=1)
c = reducex(c, by=nvm, chnum=i, number=nvm, verbose=verbose)
proc = np.concatenate((proc, c), axis=1)
on += c.shape[1]

Additionally, the proc array never gets incorporated into the returned array.

return header, ar, gps

KeyError for GSSI files

As with #7, I'm running into a KeyError when loading a true GSSI .DZT file thus one not simulated by gprMax:

image

Would it be possible to include this header as well?

Thank you :)

Exporting GPR Data of SIR-30 Multi-Channel System to A CSV/TXT File

Dear Mr. Ian Nesbitt and Your Team,

I currently use the GSSI SIR-30 multi-channel GPR system. Is it possible to export GPR data arrays for all channels (for example, in a CSV or TXT format)? If not, how can I read the GPR data for each single channel? It seems that, by default, the readgssi program only read/plot GPR data on the first channel.

I would appreciate your response.

Thank you very much!

Errors opening files or help (from GitBash)

When trying to run the help or open a DZT file I keep getting the following error:

$ readgssi -h
Traceback (most recent call last):
  File "c:\programdata\anaconda3\envs\readgssi\lib\runpy.py", line 193, in _run_module_as_main
    "__main__", mod_spec)
  File "c:\programdata\anaconda3\envs\readgssi\lib\runpy.py", line 85, in _run_code
    exec(code, run_globals)
  File "C:\ProgramData\Anaconda3\envs\readgssi\Scripts\readgssi.exe\__main__.py", line 7, in <module>
  File "c:\programdata\anaconda3\envs\readgssi\lib\site-packages\readgssi\readgssi.py", line 275, in main
    fx.printmsg(config.help_text)
  File "c:\programdata\anaconda3\envs\readgssi\lib\site-packages\readgssi\functions.py", line 12, in printmsg
    print('%s - %s' % (datetime.now().strftime('%Y-%m-%d %H:%M:%S'), msg))
  File "c:\programdata\anaconda3\envs\readgssi\lib\encodings\cp1252.py", line 19, in encode
    return codecs.charmap_encode(input,self.errors,encoding_table)[0]
UnicodeEncodeError: 'charmap' codec can't encode character '\U0001f12f' in position 134: character maps to <undefined>

Multi-frequency antenna, header problem

Hello, there seems to be a problem when reading multi channel *.DZT files from a GSSI SIR4000 console, with a multi frequency antenna 300MHz/800MHz. It looks like in their header file they do not separate properly the info related to the different channels. It is already somehow buggy in the way it looks on RADAN.

From the command line, I use:

readgssi -N -f gprpy -i CAV_2Z2-01__001.DZT

(input file attached as a ZIP file
CAV_2Z2-01__001.zip
)

Hereinafter the WARNING messages and the error:

...
--------------------WARNING - PLEASE READ---------------------
2021-02-08 08:10:30 - WARNING: could not read frequency for antenna name "'300/800D'"
2021-02-08 08:10:30 - WARNING: trying to use frequencies of None MHz (estimated)...
2021-02-08 08:10:30 - more info: rh_ant=['300/800D', 'none', None, None]
2021-02-08 08:10:30 -            known_ant=[False, False, None, None]
2021-02-08 08:10:30 - please submit a bug report with this warning, the antenna name and frequency
2021-02-08 08:10:30 - at https://github.com/iannesbitt/readgssi/issues/new
2021-02-08 08:10:30 - or send via email to ian (dot) nesbitt (at) gmail (dot) com.
2021-02-08 08:10:30 - if possible, please attach a ZIP file with the offending DZT inside.
--------------------------------------------------------------
--------------------WARNING - PLEASE READ---------------------
2021-02-08 08:10:30 - WARNING: could not read frequency for antenna name "'none'"
2021-02-08 08:10:30 - WARNING: trying to use frequencies of None MHz (estimated)...
2021-02-08 08:10:30 - more info: rh_ant=['300/800D', 'none', None, None]
2021-02-08 08:10:30 -            known_ant=[False, False, None, None]
2021-02-08 08:10:30 - please submit a bug report with this warning, the antenna name and frequency
2021-02-08 08:10:30 - at https://github.com/iannesbitt/readgssi/issues/new
2021-02-08 08:10:30 - or send via email to ian (dot) nesbitt (at) gmail (dot) com.
2021-02-08 08:10:30 - if possible, please attach a ZIP file with the offending DZT inside.
--------------------------------------------------------------
2021-02-08 08:10:30 - beginning processing for channel 0 (antenna 300/800D)
2021-02-08 08:10:30 - no gps information for distance normalization
Traceback (most recent call last):
  File "/home/alex/.virtualenvs/gpr/bin/readgssi", line 8, in <module>
    sys.exit(main())
  File "/home/alex/.virtualenvs/gpr/lib/python3.8/site-packages/readgssi/readgssi.py", line 480, in main
    readgssi(infile=infile, outfile=outfile, antfreq=antfreq, frmt=frmt, plotting=plotting, dpi=dpi,
  File "/home/alex/.virtualenvs/gpr/lib/python3.8/site-packages/readgssi/readgssi.py", line 146, in readgssi
    header, data[ar], gps = arrayops.distance_normalize(header=header, ar=data[ar], gps=gps,
  File "/home/alex/.virtualenvs/gpr/lib/python3.8/site-packages/readgssi/arrayops.py", line 162, in distance_normalize
    return header, proc, gps
UnboundLocalError: local variable 'proc' referenced before assignment


Sorry for bothering you with an issue which is probably related to a GSSI bug, and thank you again for your efforts!
Best,
Alessandro

GeoPy throws error when processing when GPS Altitude changes

@iannesbitt , first of all, thank you for the effort on putting this library together. It is a very handy tool!

However, I encountered an issue trying to use it. I am currently trying to use the main function readgssi.readgssi to open a dataset that contains DZT and DZG files. The DZG files contain the information from the GPS including altitude. Therefore, when the main function calls the function readdzg, GeoPy throws the following error: "ValueError: Calculating distance between points with different altitudes is not supported". This seems to be documented under GeoPy - Calculate Distance
When I open the data without the GPS the function works perfectly.

HERE a sample of the data I am using. Please, let me know if you need more info or a extra hand as contributor.

Recommend Projects

  • React photo React

    A declarative, efficient, and flexible JavaScript library for building user interfaces.

  • Vue.js photo Vue.js

    πŸ–– Vue.js is a progressive, incrementally-adoptable JavaScript framework for building UI on the web.

  • Typescript photo Typescript

    TypeScript is a superset of JavaScript that compiles to clean JavaScript output.

  • TensorFlow photo TensorFlow

    An Open Source Machine Learning Framework for Everyone

  • Django photo Django

    The Web framework for perfectionists with deadlines.

  • D3 photo D3

    Bring data to life with SVG, Canvas and HTML. πŸ“ŠπŸ“ˆπŸŽ‰

Recommend Topics

  • javascript

    JavaScript (JS) is a lightweight interpreted programming language with first-class functions.

  • web

    Some thing interesting about web. New door for the world.

  • server

    A server is a program made to process requests and deliver data to clients.

  • Machine learning

    Machine learning is a way of modeling and interpreting data that allows a piece of software to respond intelligently.

  • Game

    Some thing interesting about game, make everyone happy.

Recommend Org

  • Facebook photo Facebook

    We are working to build community through open source technology. NB: members must have two-factor auth.

  • Microsoft photo Microsoft

    Open source projects and samples from Microsoft.

  • Google photo Google

    Google ❀️ Open Source for everyone.

  • D3 photo D3

    Data-Driven Documents codes.