Git Product home page Git Product logo

pyg2plot's Introduction

PyG2Plot

🎨 Python3 binding for @AntV/G2Plot which an interactive and responsive charting library. Based on the grammar of graphics, you can easily make superior statistical charts through a few lines of code. PyG2Plot is inspired by pyecharts.

Latest Stable Version build Status Pypi Download

Document中文说明文档 · Drawing statistical plots · In Jupyter Notebook · Principles

Installation

$ pip install pyg2plot

Usage

render HTML

from pyg2plot import Plot

line = Plot("Line")

line.set_options({
  "data": [
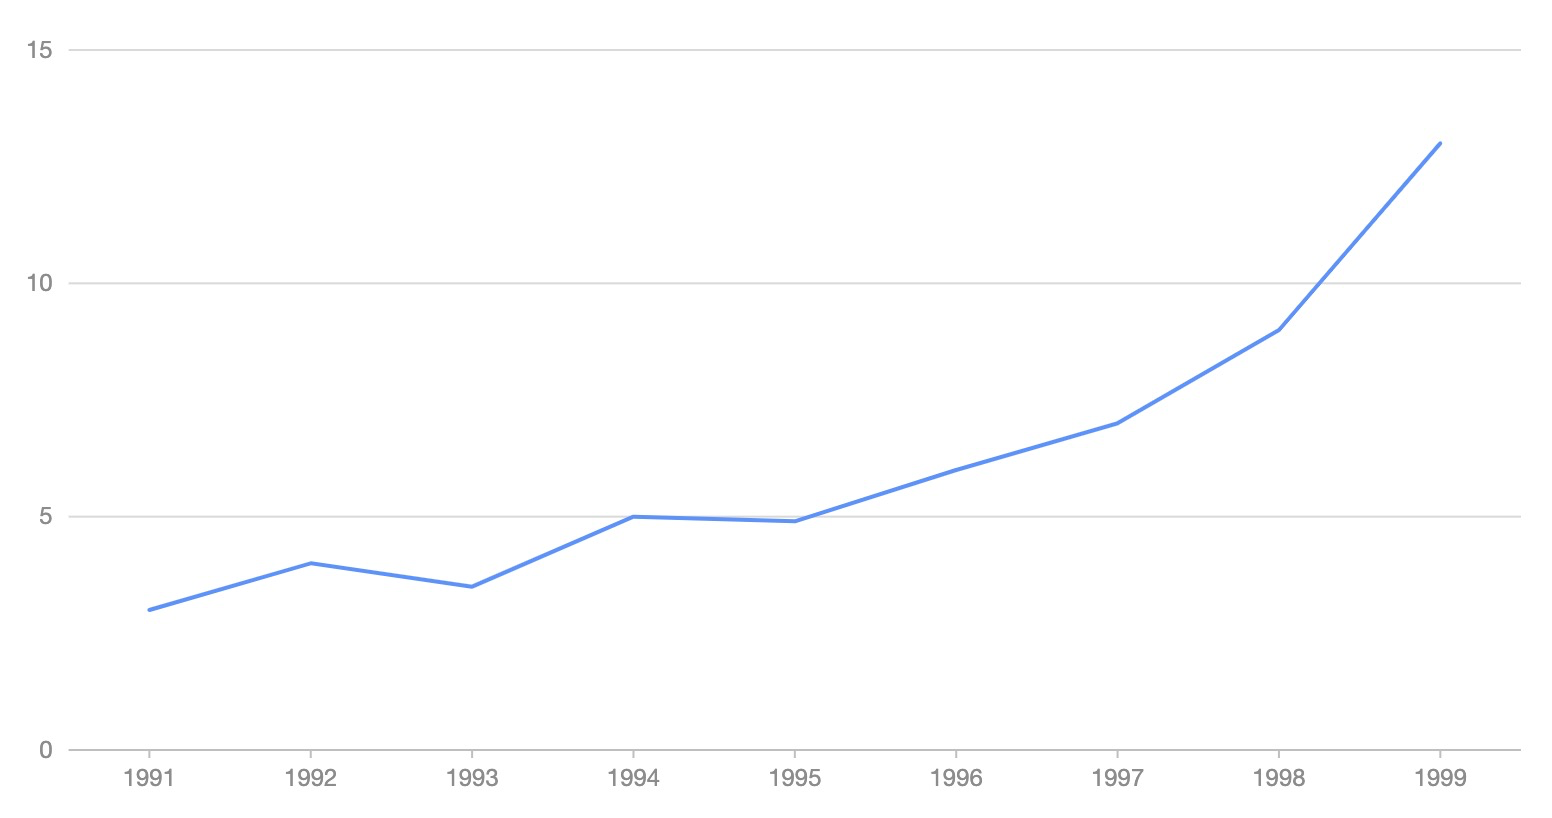
    { "year": "1991", "value": 3 },
    { "year": "1992", "value": 4 },
    { "year": "1993", "value": 3.5 },
    { "year": "1994", "value": 5 },
    { "year": "1995", "value": 4.9 },
    { "year": "1996", "value": 6 },
    { "year": "1997", "value": 7 },
    { "year": "1998", "value": 9 },
    { "year": "1999", "value": 13 },
  ],
  "xField": "year",
  "yField": "value",
})

# 1. render html file
line.render("plot.html")
# 2. render html string
line.render_html()

image

render Jupyter

from pyg2plot import Plot

line = Plot("Line")

line.set_options({
  "height": 400, # set a default height in jupyter preview
  "data": [
    { "year": "1991", "value": 3 },
    { "year": "1992", "value": 4 },
    { "year": "1993", "value": 3.5 },
    { "year": "1994", "value": 5 },
    { "year": "1995", "value": 4.9 },
    { "year": "1996", "value": 6 },
    { "year": "1997", "value": 7 },
    { "year": "1998", "value": 9 },
    { "year": "1999", "value": 13 },
  ],
  "xField": "year",
  "yField": "value",
})

# 1. render in notebook
line.render_notebook()

# 2. render in jupyter lab
line.render_jupyter_lab()

use JavaScript callback

from pyg2plot import Plot, JS

line = Plot("Line")

line.set_options({
  "height": 400, # set a default height in jupyter preview
  "data": [
    { "year": "1991", "value": 3 },
    { "year": "1992", "value": 4 },
    { "year": "1993", "value": 3.5 },
    { "year": "1994", "value": 5 },
    { "year": "1995", "value": 4.9 },
    { "year": "1996", "value": 6 },
    { "year": "1997", "value": 7 },
    { "year": "1998", "value": 9 },
    { "year": "1999", "value": 13 },
  ],
  "xField": "year",
  "yField": "value",
  "lineStye": JS('''function() {
    return { stroke: 'red' }; 
  }''')
})

Use JS API, you can use JavaScript syntax for callback.

API

Now, only has one API of pyg2plot.

  • Plot
  1. Plot(plot_type: str): get an instance of Plot class.

  2. plot.set_options(options: object): set the options of G2Plot into instance.

  3. plot.render(path, env, **kwargs): render out html file by setting the path, jinja2 env and kwargs.

  4. plot.render_notebook(env, **kwargs): render plot on jupyter preview.

  5. plot.render_jupyter_lab(env, **kwargs): render plot on jupyter lab preview.

  6. plot.render_html(env, **kwargs): render out html string by setting jinja2 env and kwargs.

  7. plot.dump_js_options(env, **kwargs): dump js options by setting jinja2 env and kwargs, use it for HTTP request.

More apis is on the way.

License

MIT@hustcc.

pyg2plot's People

Contributors

hustcc avatar

Stargazers

 avatar  avatar  avatar  avatar  avatar  avatar  avatar  avatar  avatar  avatar  avatar  avatar  avatar  avatar  avatar  avatar  avatar  avatar  avatar  avatar  avatar  avatar  avatar  avatar  avatar  avatar  avatar  avatar  avatar  avatar  avatar  avatar  avatar  avatar  avatar  avatar  avatar  avatar  avatar  avatar  avatar  avatar  avatar  avatar  avatar  avatar  avatar  avatar  avatar  avatar  avatar  avatar  avatar  avatar  avatar  avatar  avatar  avatar  avatar  avatar  avatar  avatar  avatar  avatar  avatar  avatar  avatar  avatar  avatar  avatar  avatar  avatar  avatar  avatar  avatar  avatar  avatar  avatar  avatar  avatar  avatar  avatar  avatar  avatar  avatar  avatar  avatar  avatar  avatar  avatar  avatar  avatar  avatar  avatar  avatar  avatar  avatar  avatar  avatar  avatar

Watchers

 avatar  avatar  avatar  avatar  avatar  avatar  avatar  avatar  avatar  avatar  avatar  avatar

pyg2plot's Issues

selenium.common.exceptions.JavascriptException: Message: javascript error: echarts is not defined

使用from snapshot_selenium import snapshot将得到的html转为图片,报错,
使用方法为pyecharts.render.make_snapshot(snapshot_selenium.snapshot, 'xxx.html', 'xxx.png')

Traceback (most recent call last):
  File "/home/tests/test_1.py", line 20, in <module>
    make_snapshot(snapshot, '/home/plot.html', "bar0.png")
  File "/usr/local/lib/python3.8/dist-packages/pyecharts/render/snapshot.py", line 32, in make_snapshot
    content = engine.make_snapshot(
  File "/usr/local/lib/python3.8/dist-packages/snapshot_selenium/snapshot.py", line 52, in make_snapshot
    return driver.execute_script(snapshot_js)
  File "/usr/local/lib/python3.8/dist-packages/selenium/webdriver/remote/webdriver.py", line 491, in execute_script
    return self.execute(command, {
  File "/usr/local/lib/python3.8/dist-packages/selenium/webdriver/remote/webdriver.py", line 428, in execute
    self.error_handler.check_response(response)
  File "/usr/local/lib/python3.8/dist-packages/selenium/webdriver/remote/errorhandler.py", line 243, in check_response
    raise exception_class(message, screen, stacktrace)
selenium.common.exceptions.JavascriptException: Message: javascript error: echarts is not defined
  (Session info: headless chrome=104.0.5112.101)
Stacktrace:
#0 0x557451a50403 <unknown>
#1 0x557451856778 <unknown>
#2 0x557451859617 <unknown>
#3 0x5574518594c4 <unknown>
#4 0x55745185a07d <unknown>
#5 0x5574518bf853 <unknown>
#6 0x5574518aba02 <unknown>
#7 0x5574518bec74 <unknown>
#8 0x5574518ab8f3 <unknown>
#9 0x5574518810d8 <unknown>
#10 0x557451882205 <unknown>
#11 0x557451a97e3d <unknown>
#12 0x557451a9adb6 <unknown>
#13 0x557451a8113e <unknown>
#14 0x557451a9b9b5 <unknown>
#15 0x557451a75970 <unknown>
#16 0x557451ab8228 <unknown>
#17 0x557451ab83bf <unknown>
#18 0x557451ad2abe <unknown>
#19 0x7f7f5964f609 <unknown>

【BUG】无法从“markupsafe”导入名称“soft_unicode”

Python 3.10.5 (tags/v3.10.5:f377153, Jun 6 2022, 16:14:13) [MSC v.1929 64 bit (AMD64)] on win32
Type "help", "copyright", "credits" or "license" for more information.

from pyg2plot import Plot
Traceback (most recent call last):
File "", line 1, in
File "C:\Users\梦云之家\AppData\Roaming\Python\Python310\site-packages\pyg2plot_init_.py", line 9, in
from pyg2plot.plot import Plot # noqa
File "C:\Users\梦云之家\AppData\Roaming\Python\Python310\site-packages\pyg2plot\plot.py", line 9, in
from jinja2 import Environment
File "C:\Users\梦云之家\AppData\Roaming\Python\Python310\site-packages\jinja2_init_.py", line 12, in
from .environment import Environment
File "C:\Users\梦云之家\AppData\Roaming\Python\Python310\site-packages\jinja2\environment.py", line 25, in
from .defaults import BLOCK_END_STRING
File "C:\Users\梦云之家\AppData\Roaming\Python\Python310\site-packages\jinja2\defaults.py", line 3, in
from .filters import FILTERS as DEFAULT_FILTERS # noqa: F401
File "C:\Users\梦云之家\AppData\Roaming\Python\Python310\site-packages\jinja2\filters.py", line 13, in
from markupsafe import soft_unicode
ImportError: cannot import name 'soft_unicode' from 'markupsafe' (C:\Users\梦云之家\AppData\Roaming\Python\Python310\site-packages\markupsafe_init_.py)

import pyg2plot
Traceback (most recent call last):
File "", line 1, in
File "C:\Users\梦云之家\AppData\Roaming\Python\Python310\site-packages\pyg2plot_init_.py", line 9, in
from pyg2plot.plot import Plot # noqa
File "C:\Users\梦云之家\AppData\Roaming\Python\Python310\site-packages\pyg2plot\plot.py", line 9, in
from jinja2 import Environment
File "C:\Users\梦云之家\AppData\Roaming\Python\Python310\site-packages\jinja2_init_.py", line 12, in
from .environment import Environment
File "C:\Users\梦云之家\AppData\Roaming\Python\Python310\site-packages\jinja2\environment.py", line 25, in
from .defaults import BLOCK_END_STRING
File "C:\Users\梦云之家\AppData\Roaming\Python\Python310\site-packages\jinja2\defaults.py", line 3, in
from .filters import FILTERS as DEFAULT_FILTERS # noqa: F401
File "C:\Users\梦云之家\AppData\Roaming\Python\Python310\site-packages\jinja2\filters.py", line 13, in
from markupsafe import soft_unicode
ImportError: cannot import name 'soft_unicode' from 'markupsafe' (C:\Users\梦云之家\AppData\Roaming\Python\Python310\site-packages\markupsafe_init_.py)

python如何实现JS回调方法

from pyg2plot import Plot, JS

line = Plot("Line")

line.set_options({
"height": 400, # set a default height in jupyter preview
"data": [
{ "year": "1991", "value": 3 },
{ "year": "1992", "value": 4 },
{ "year": "1993", "value": 3.5 },
{ "year": "1994", "value": 5 },
{ "year": "1995", "value": 4.9 },
{ "year": "1996", "value": 6 },
{ "year": "1997", "value": 7 },
{ "year": "1998", "value": 9 },
{ "year": "1999", "value": 13 },
],
"xField": "year",
"yField": "value",
"lineStye": JS('''function() {
return { stroke: 'red' };
}''')
这里面的JS方法该怎么写呢,有没有一个示例。

坐标轴title

是否可以设置图表坐标轴的title?没有找到设置方法,求助。

Jupyter导出HTML有bug

hello,感谢分享

我是用Jupyter Notebook调用PyG2Plot画图后,将.ipynb通过jupyter nbconvert转为.html后,.html有无法上下滚动浏览的问题~

我搞错了,忽略……

代码如下:

from pyg2plot import Plot, JS

line = Plot("Line")

line.set_options({
"height": 400, # set a default height in jupyter preview
"data": [
{ "year": "1991", "value": 3 },
{ "year": "1992", "value": 4 },
{ "year": "1993", "value": 3.5 },
{ "year": "1994", "value": 5 },
{ "year": "1995", "value": 4.9 },
{ "year": "1996", "value": 6 },
{ "year": "1997", "value": 7 },
{ "year": "1998", "value": 9 },
{ "year": "1999", "value": 13 },
],
"xField": "year",
"yField": "value",
"lineStye": JS('''function() {
return { stroke: 'red' };
}''')
})

1. 渲染到 notebook

line.render_notebook()

图表标题

怎么增加图表的标题呢?(不是坐标轴的title)

Recommend Projects

  • React photo React

    A declarative, efficient, and flexible JavaScript library for building user interfaces.

  • Vue.js photo Vue.js

    🖖 Vue.js is a progressive, incrementally-adoptable JavaScript framework for building UI on the web.

  • Typescript photo Typescript

    TypeScript is a superset of JavaScript that compiles to clean JavaScript output.

  • TensorFlow photo TensorFlow

    An Open Source Machine Learning Framework for Everyone

  • Django photo Django

    The Web framework for perfectionists with deadlines.

  • D3 photo D3

    Bring data to life with SVG, Canvas and HTML. 📊📈🎉

Recommend Topics

  • javascript

    JavaScript (JS) is a lightweight interpreted programming language with first-class functions.

  • web

    Some thing interesting about web. New door for the world.

  • server

    A server is a program made to process requests and deliver data to clients.

  • Machine learning

    Machine learning is a way of modeling and interpreting data that allows a piece of software to respond intelligently.

  • Game

    Some thing interesting about game, make everyone happy.

Recommend Org

  • Facebook photo Facebook

    We are working to build community through open source technology. NB: members must have two-factor auth.

  • Microsoft photo Microsoft

    Open source projects and samples from Microsoft.

  • Google photo Google

    Google ❤️ Open Source for everyone.

  • D3 photo D3

    Data-Driven Documents codes.