


Feature-Complete Chart Web Component with more than 30 different Data Visualization options. The Chart Types supported are listed: Chart Types.

Our Chart Web Component is written in JavaScript and CSS. It does not depend on any other third-party scripts. The rendering is achieved with SVG and HTML5 canvas. The Chart works well on mobile browsers and is the most feature-complete chart available in the web components world.
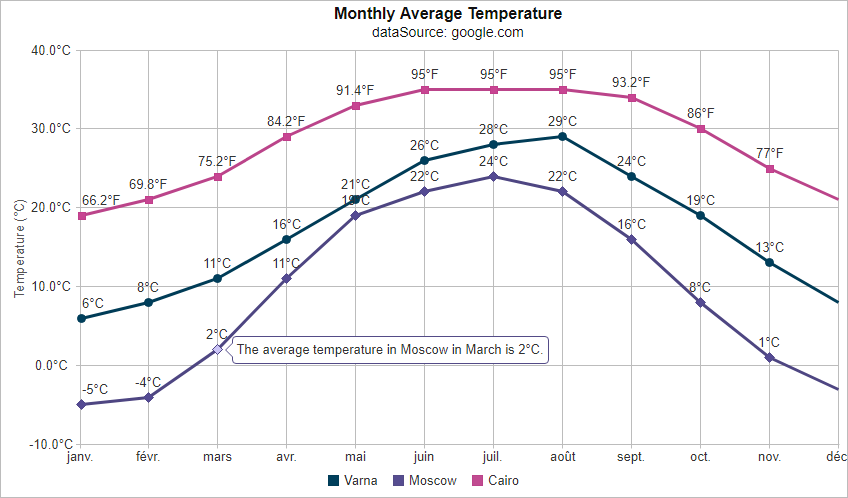
Data displayed on the Chart can be formatted in multiple different ways. For example, the charting element has a property called 'formatSettings' with the following data formatting options.
- decimalSeparator - character used as a decimal separator. If not specified, the default separator is '.'
- thousandsSeparator - character used as thousands separator. Default value is ','
- decimalPlaces - number of digits after the decimal separator. Default value is 2 for floating point numbers.
- negativeWithBrackets - boolean which specifies whether to display negative numbers in brackets. Default value is false.
- prefix - any string which will be added as a prefix. Default value is empty.
- sufix - any string which will be added as a sufix. Default value is empty.
- dateFormat - optional date format string. This property is applicable only when displaying Date objects.
The image below illustrates the Axes supported by the web component. Smart.Chart has two main types of axes - valueAxis and xAxis. Typically the valueAxis represents the vertical axis in the chart although you may choose to rotate the axes and in this case the valueAxis will be displayed horizontally.

Smart.Chart also ships with 32 built-in color schemes which are used to automatically set colors for different series. You can change the color scheme by setting the colorScheme property of the chart. The available value are from 'scheme01' to 'scheme32'. By setting its 'theme' property, users can Data Visualize their graphics in 'Light' and 'Dark' mode. Smart.Chart is based on: jqxChart.
We invite you to look at Chart Web Component demos: Chart overview
Commercial


