highcharts-for-python / highcharts-core Goto Github PK
View Code? Open in Web Editor NEWPython wrapper for the Highcharts Core JavaScript library
Home Page: https://www.highcharts.com/integrations/python
License: Other
Python wrapper for the Highcharts Core JavaScript library
Home Page: https://www.highcharts.com/integrations/python
License: Other


Describe the bug
When trying to attach custom properties to data points, the custom properties are lost when creating a HighchartsOptions object when calling HighchartsOptions.from_dict().
To Reproduce
Steps to reproduce the behavior:
HighchartsOptions.from_dict using that series data.Expected behavior
I expect that the properties would be available on this.point when using the formatter function in tooltip. This is behavior I currently do in the JS library.
Your Environment:
Additional context
This is being tested in a Jupyter notebook, but when printing the options object directly. The custom attributes are already removed, so I believe this is occurring during the from_dict method call.
data = [
    {
        'y': 0.845,
        'CUSTOM_VALUE': 0.193
    },
    {
        'y': 0.267,
        'CUSTOM_VALUE': 0.0932
    }
]

categories = [
    'category1',
    'category2'
]

options_dict = {
    'chart': {'type': 'bar'},
    'xAxis': {
    'categories': categories,
    'title': {'text': 'Categories'}
    },
    'yAxis': {'title': {'text': 'Some Number'}},
    'series': [{'type': 'bar', 'name': 'My Series', 'data': data}],
    'title': {'text': 'Categories and Numbers'},
    'tooltip': {
        'formatter': """function () {
            return `
                <p><b>Category: </b>${this.point.category}</p><br>
                <p><b>Custom Val: </b>${this.point.CUSTOM_VALUE}</p><br>
            `
        }""",
        'useHTML': 'true'
    }
}

options = HighchartsOptions.from_dict(options_dict)
# At this point, options does not contain the CUSTOM_VALUE property in the series data
my_chart = highcharts.Chart.from_options(options)
my_chart.display()
# Tooltips show undefined in place of the expected valueWith Highcharts Core v.11 due to be released soon, Highcharts Core for Python will need to be updated to support the new functionality and revised APIs.
Steps to encounter the bug:
chart.display().jupyter nbconvert terminal command.However! When you remove the <script src="https://cdnjs.cloudflare.com/ajax/libs/require.js/2.1.10/require.min.js"/> from the HTML file produced by jupyter nbconvert, the chart renders correctly.
You can see this behavior in this JS Fiddle. When require.min.js is loaded from the CDN, the chart does not render. When it is removed from the CDN (in the Fiddle), the chart renders fine.
navigation.menuItemStyle doesn't seem to work. When trying to apply:
navigation: {
    menuItemStyle: {
        color: "#5f5e5e",
        fontFamily: "Roboto",
        fontSize: "12px",
        fontWeight: "400"
    }
}
via a shared options JS literal, the JS output doesn't include the navigation object key.
Hi there,
Is it possible to provide an example of using this framework with plotLines for the case where x is a time series of datetime
from highcharts_core.chart import Chart
from highcharts_core.options.series.area import LineSeries
from highcharts_core.global_options.shared_options import SharedOptions
import pandas as pd
import datetime as dt

df = pd.DataFrame({'date':[dt.datetime(2023,1,1), dt.datetime(2023,1,2)], 'sales': [10,20]})

my_chart = Chart.from_pandas(df,
                            property_map = {
                                'x': 'date',
                                'y': 'sales',
                            },
                            series_type = 'line')
my_chart.options.title = {
        'text': 'Ticker'
    }
my_chart.options.subtitle = {
        'text': 'Ticker'
    }
my_chart.options.plot_options: {
        'series': {
            'marker': {
                'enabled': False,
                'radius': 5.5
            }
        }
    }
my_chart.options.x_axis = {
        'type': 'datetime',
        'dateTimeLabelFormats': {
            'month': '%e. %b',
            'year': '%b'
        },
        'title': {
            'text': 'Date'
        },
         'plotLines': [{
            'color': '#FF0000',
            'width': 2,
            #'value': dt.datetime(2023,1,1)  this fails with: CannotCoerceError: value (2023-01-01 00:00:00) is not a numeric type, was <class 'datetime.datetime'>
        }]
    }

my_chart.options.y_axis = {
        'title': {
            'text': 'Growth'
        },
    },

my_chart.display()
With the above, if I uncomment 'value': dt.datetime(2023,1,1)
I get CannotCoerceError: value (2023-01-01 00:00:00)
Your Environment:
highcharts-core 1.1.1 pypi_0 pypi
In v.1.0.0 of Highcharts Core for Python supports the enabling/disabling of styled mode using the appropriate options. However, any configuration of the CSS has to occur outside of the library itself.
In v.1.x (possibly v.2.0 due to the complexity of this enhancement) it would be helpful if the library also provided for the configuration of the CSS styles that are applicable if using Styled Mode.
Describe the bug
Several issues:
checkers.is_file_on_filesystem(as_string_or_file) in base.py I believe should be:checkers.is_on_filesystem(as_string_or_file)After fixing the above issue:
It appears at least the wrapper_character parameter is ignored, possibly others
When passing in a well formatted CSV string, (digestible via pythons CSV when matching the highcharts dialect specified in utility_functions.py) , the utility_functions.parse_csv fails to parse it.
To Reproduce
Steps to reproduce the behavior:
Run:
from highcharts_core.options.series.area import LineSeries

series1 = LineSeries.from_csv("'Date','HeadCount'\r\n'01/01/2023','2'\r\n'01/02/2023','4'\r\n'01/03/2023','8'", property_column_map={'x': 'Date', 'y': 'HeadCount', 'id': 'Date'})
Which yields:
columns: ['Date']
csv_records: [{'Date': '', None: ['']}, {'Date': 'HeadCount'}, {'Date': '01/01/2023'}, {'Date': '', None: ['']}, {'Date': '2'}, {'Date': '01/02/2023'}, {'Date': '', None: ['']}, {'Date': '4'}, {'Date': '01/03/2023'}, {'Date': '', None: ['']}, {'Date': '8'}]
Which was printed via putting
print(f'columns: {columns}\ncsv_records: {csv_records}')
In base.py immediately after:
   columns, csv_records = utility_functions.parse_csv(
            as_str,
            has_header_row = has_header_row,
            delimiter = delimiter,
            null_text = null_text,
            wrapper_character = wrapper_character,
            line_terminator = line_terminator,
            wrap_all_strings = False,
            double_wrapper_character_when_nested = False,
            escape_character = "\\"
        )
I've attempted many variations of the CSV string, all seem to yield similar results.
Expected behavior
I would expect it to parse this CSV string into a series, where each record in the series has an 'x' value populated from the 'Date' column of the CSV and a 'y' value populated from the 'HeadCount' column.
Your Environment:
Additional context
legend.itemStyle doesn't seem to be accepting a Highcharts.CSSObject. When trying to apply:
legend: {
  itemStyle: {
    color: "#5f5e5e",
    fontFamily: "Roboto",
    fontSize: "12px"
  }
},
I get this error:
value ({'color': '#5f5e5e', 'fontFamily': 'Roboto', 'fontSize': '12px'}) was not coerced to a string
In v.1.0.0, Highcharts Core for Python will generate the full set of <script/> tags that download all of the Highcharts JS modules - whether the visualization uses that module or not.
In v.1.x, it would be good for Highcharts Core for Python to:
<script/> tags that are strictly necessary for the visualization - if a module is not needed, then it should not be included<script/> tags for inclusion in a <head/> location<script/> tags and appending them to the <head/> location based on Javascript Promises (as is used for the Jupyter Labs rendering in v.1.0.0).While a chart can be created using a single method call, in general it would make things easier to add keyword properties to Chart.__init__(...) and related factory methods that allow for "one-shot" chart creation. For example:
Chart(series = ..., data = ..., series_type = ...)
It should be trivially easy for a developer/data scientist to create and render a single-series chart. There are existing single-shot series creation methods, but they rely on the series then being added to an existing Chart instance. This is inefficient and overly verbose. Instead, the semantics should be simpler (pseudo-code follows):
my_series = Series(...)
chart = my_series.to_chart()

# OR

my_series = Series(...)
my_series.display()
To complete this task:
.to_chart() (instance) method that creates a chart instance populated with the single series. Default chart settings should be intelligently set or populated via keyword arguments..display() (instance) method that a) creates a chart instance by calling self.to_chart(), and then b) renders the chart in a Jupyter context by calling .display() on that chart.Describe the bug
When trying to render a bar chart using a 2D data series with strings for the x axis, the chart won't render properly.
Expected behavior
>>> chart = Chart('container')
>>> chart.add_series(BarSeries(data=[['A', 1], ['B', 2], ['C', 3]]))
>>> chart.to_js_literal()
document.addEventListener('DOMContentLoaded', function() {
  Highcharts.chart('container', {
    xAxis: {type: 'category'},
    series: [{
      data: [
        ['A', 1],
        ['B', 2],
        ['C', 3],
      ],
      type: 'bar'
    }]
  });
});
https://jsfiddle.net/m6q7koLx/1/
Actual behavior
>>> chart = Chart('container')
>>> chart.add_series(BarSeries(data=[['A', 1], ['B', 2], ['C', 3]]))
>>> chart.to_js_literal()
document.addEventListener('DOMContentLoaded', function() {
  Highcharts.chart('container', {
    xAxis: {type: 'category'},
    series: [{
      data: [
        {x: 'A', y: 1},
        {x: 'B', y: 2},
        {x: 'C', y: 3},
      ],
      type: 'bar'
    }]
  });
});
Describe the bug
There seems to be an issue when attempting to display a boxplot chart in jupyterlab. Having had a look at the codebase, it seems like highcharts-more should be included but for some reason doesn't seem like it is. This hasn't been an issue with any other charts tested so far (line, bar, scatter).


To Reproduce
Attempt to render a boxplot chart in jupyterlab using the .display() method.
Your Environment:
As identified in #57 , and in alignment with the Highcharts (JS) API, the options.axes.plot_bands.PlotLine.value property expects a numeric value. Currently, if a Python datetime is supplied, it fails on type validation. However, if the datetime is converted to a POSIX timestamp it works correctly.
Therefore, it would be good for the PlotLine.value property to auto-convert datetime.datetime values to POSIX timestamps using the .timestamp() method.
Describe the bug
Highcharts for python does not render in jupyter and throws an error:
Something went wrong with the Highcharts.js script. It should have been automatically loaded, but it did not load for over 3 seconds. Check your internet connection, and then if the problem persists please reach out for support.
To Reproduce
Create a venv with the following deps:
jupyterlab
highcharts-core
Expected behavior
Highcharts should render
Your Environment:
Additional context
The bug is in this line. We are using js literal new Highcharts.chart but Highcharts.chart is not a constructor. A simple reproducer is in this fiddle: https://jsfiddle.net/tfy50bwg/. Removing the new works just fine.
Hi there,
Is there an example of adding multiple LineSeries from a single dataframe?
Hello Team,
I am analyzing Highcharts Python in depth as a candidate for charting and visualization requirements for my team and stakeholders. I've few questions:
from highcharts_core.chart import Chart in code, then entire Highcharts (JS) assets are loaded. Is my understanding correct?legend on the chart?Can you please clarify the above queries? As I analyze and share my summary of Highcharts Python with my managers, I might ask more questions in this particular thread.
Thank You,
rdp1414
Problem
When creating a Highcharts Series object from a pandas Dataframe(), any column with pandas Timestamp() object does not get serialized as milliseconds from the Unix epoch when using the to_dict() and to_json() methods. to_js_literal() does the serialization correctly but it's not ideal when I want to send data through an API. The string returned by the to_js_literal() cannot be parsed with Javascript's JSON.parse() method.
Example
# Sample DataFrame saved in df
timestamp     value
2023-04-01    13669.0
2023-04-02    21534.0
2023-04-03    23207.0
After creating Highcharts series using series = LineSeries.from_pandas(df,property_map={"x": "timestamp", "y": "value"})
# series.to_js_literal() ouputs
"{
  data: [{
  x: 1680307200000.0,
  y: 13669.0
},
{
  x: 1680393600000.0,
  y: 21534.0
},
{
  x: 1680480000000.0,
  y: 23207.0
}],
  type: 'line'
}"

# series.to_dict() ouputs
{'data': [{'x': Timestamp('2023-04-01 00:00:00'), 'y': 13669.0}, {'x': Timestamp('2023-04-02 00:00:00'), 'y': 21534.0}, {'x': Timestamp('2023-04-03 00:00:00'), 'y': 23207.0}], 'type': 'line'}

# series.to_json() just breaks with the following error
TypeError: Object of type Timestamp is not JSON serializable
While the to_js_literal() method gives me what I want, it's difficult to work with when sending data over an API.
Expected behavior
I expected to_json() to have the same output as to_js_literal(), but in JSON format and to_dict() to have serialized the Timestamp() object to milliseconds from Unix epoch.
Environment:
Describe the bug
Looks like charty.py to_js_literal() adds an extra ; after appending the options. (I think there is also an extra comma, but I don't think it hurts anything)
To Reproduce
Steps to reproduce the behavior:
from highcharts_core.chart import Chart
from highcharts_core.global_options.shared_options import SharedOptions
from highcharts_core.options.series.area import LineSeries


shared_options = SharedOptions.from_js_literal('''{
  chart: {
        backgroundColor: {
            linearGradient: {
              x1: 0,
              x2: 0,
              y1: 1,
              y2: 1
            },
            stops: [
                [0, 'rgb(255, 255, 255)'],
                [1, 'rgb(240, 240, 255)']
            ]
        },
        type: 'line',
        borderWidth: 2,
        plotBackgroundColor: 'rgba(255, 255, 255, .9)',
        plotBorderWidth: 1
  },
  caption: {
      align: 'center',
      floating: true,
      margin: 20,
      verticalAlign: 'top'
  },
  credits: {
      enabled: true,
      href: 'https://www.somewhere.com',
      style: {
          color: '#cccccc',
          fontSize: '8px'
      },
      text: 'Highcharts for Python'
  }
}''')

chart = Chart(container='container', options=shared_options)
series1 = LineSeries(data=[['01/01/2023', 1], ['01/02/2023', 2], ['01/03/2023', 3], ['01/04/2023', 4]])
chart.add_series(series1)

html = '''<html><head><script src="https://code.highcharts.com/highcharts.js"></script><script type='javascript'>%s</script></head><body>Test<br/><div id="container"></div></body></html>''' % chart.to_js_literal()
print(html)
which outputs (condensed):
<html><head><script src="https://code.highcharts.com/highcharts.js"></script><script type='javascript'>document.addEventListener('DOMContentLoaded', function() {
new Highcharts.chart('container',
Highcharts.setOptions({
  caption: {...},
  chart: {
  backgroundColor: {...},
  borderWidth: 2,
  plotBackgroundColor: 'rgba(255, 255, 255, .9)',
  plotBorderWidth: 1,
  type: 'line'
},
  credits: {...},
  series: [{
  data: [{
  x: '01/01/2023',
  y: 1
},
{
  x: '01/02/2023',
  y: 2
},
{
  x: '01/03/2023',
  y: 3
},
{
  x: '01/04/2023',
  y: 4
}],
  type: 'line'
}]
});,
);
});</script></head><body>Test<br/><div id="container"></div></body></html>
Expected behavior
Render a line chart w/ the dates on the X axis and the corresponding numbers on the Y axis
Your Environment:
Additional context
I'm pretty new to hcharts so might be doing something wrong, sorry!
I am setting xAxis.labels.style like so in my JS literal options file:
xAxis: {
  labels: {
    style: {
      color: "red",
    }
  }
}
The outputted JavaScript is:
xAxis: {
  labels: {
    style: "{\\'color\\': \\'red\\'}"
  }
}
This doesn't happen when setting something else, like title.style.
Describe the bug
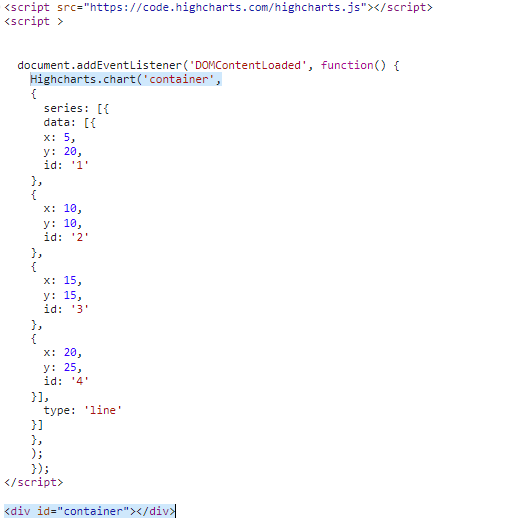
My first attempt at dispay chart in jupyter notebook, but Chart.display() seems not working.
And encounter another issue when I turn to Chart.to_js_literal().
To Reproduce
Steps to reproduce the behavior:
Create a python 3.10 environment with conda.
Create a .ipynb file import all requirements needed (pandas, highcharts_core ...).
Create a sample dataframe with 3 columns(x: int,y: int, id: str).
Use Chart.from_pandas() to create my_chart variable.
Screen snapshot of output of my_chart.display().

Chart.to_js_literal('app.js') export raw output to app.js, and import the app.js in index.html.

And I tried to remove "new" and specify the container fixed the issue.
Expected behavior
I expected to reproduce the basic-line demo, and display chart in jupyter notebook.
Your Environment:
When a Python datetime.datetime instance (or Pandas Ttimestamp() is being serialized to a JS literal, it currently gets serialized as seconds from the Unix epoch. This leads to incorrect visualization, since it should be serialized as milliseconds from the Unix epoch. This bug needs to be fixed promptly.
See #60 for an example of this behavior.
A user on StackOverflow reported a bug when attempting to generate the basic line tutorial from the demo when running Jupyter Notebooks on Ubuntu, in VSCode, with the following VSCode extensions enabled: Jupyter, Jupyter Cell Tags, Jupyter Notebook Renderers, Jupyter Slide Show, Jupyter Keymap. After upgrading to v.1.1.1 and disabling/re-enabling the extensions, the problem was resolved.
The question to investigate is whether there is a reproducible conflict with one or more of those extensions, and to determine the specific combination of extensions and environment that can lead to errors, and to see if there's a solution to the problem.
From my testing, i'm only able to install it using python 3.10+. It would be nice if that is mentioned in the docs/ readme.
In v.1.0.0, Highcharts Core for Python outputs the JavaScript literal object where any unspecified property is serialized to a dict as None and subsequently stripped from the serialized JS object literal version. Logically, this will then apply the Highcharts default value for that property.
In v.1.x, it would be nice (to aid in debugging / diagnostics) to have an show_default_values argument in the .to_js_literal() method which if True will output the JS literal with those default values explicitly displayed, rather than stripped. By default, this argument should be False.
At a high-level, the data point and series .from_array() methods should support NumPy ndarray objects as inputs. The fundamental priority is to use NumPy's vectorization to provide a performance boost to Highcharts for Python's handling of data points.
To do:
.from_ndarray() class method to DataBase..from_array() class methods to call .from_ndarray() when the value passed is (or can easily be represented as) a NumPy ndarray.DataPointCollection class, representing a vectorized array of data point values.DataPointCollection..data properties to support DataPointCollection instances.Describe the bug
When I attempt to download a chart using highcharts_core.chart.Chart.download_chart() but specify format = 'svg', I receive a PNG image instead of an SVG.
Expected behavior
I expect to receive an SVG image.
Hi,
I am trying to change the export icon (and add others) to a font icon.
To do this I need to set allowHTML in the 'navigation' part, however, it doesn't seem to get converted:
Eg:
hc_options = {
    'navigation': {
        'buttonOptions': {
            'useHTML': True
        }
    },
    'exporting': {
        'buttons': {
            'contextButton': {
                'enabled': False
            },
            'exportButton': {
                'text': '<i class="fa fa-download"></i>',
                'onclick': 'function () { this.exportChart(); }'
            }
        }
    }
}
chart = Chart(options=hc_options)
chart.to_dict()
Yields (notice the missing 'navigation'):
{'userOptions': {'exporting': {'buttons': {'contextButton': {'enabled': False}, 'exportButton': {'text': '<i class="fa fa-download"></i>'}}}}}
As described in the related roadmap item, it is necessary to simplify the use of the .from_pandas() standard method. The particular goal is to reduce the verbosity that is needed to assemble a chart from a single dataframe.
In the implemented solution:
.from_pandas() should support the creation of multiple series from a single dataframe using one method call.from_pandas() should support the setting of series, data point, data collection, or chart properties via keyword properties..from_pandas() should integrate with the new DataPointCollection and NumPy ndarray support.from_pandas() should support low-verbosity, intelligent defaults - i.e. without having the developer specify any configuration, it should "automatically" assemble a chart/series/data point collection/set of data points from a dataframe.Similar to #103 , the .from_csv() method needs to support the simplified creation of series and charts. The particular goal is to reduce the verbosity that is needed to assemble a chart from a single CSV file.
In the implemented solution:
.from_csv() should support the creation of multiple series from a single file using one method call.from_csv() should support the setting of series, data point, data collection, or chart properties via keyword properties..from_csv() should integrate with the new DataPointCollection and NumPy ndarray support.from_csv() should support low-verbosity, intelligent defaults - i.e. without having the developer specify any configuration, it should "automatically" assemble a chart/series/data point collection/set of data points from a CSV file.This is a feature request for supporting Highcharts Python in Panel.
Your Environment:
3.10.4Highcharts Python using pip install highcharts-core command.Describe the bug
When working in Jupyter Labs, and:
Chart.display() with the default container name (highcharts_target_div).Chart.display() with the default container name (highcharts_target_div).highcharts_target_div that has been output in JL Tab 1, replacing the chart originally rendered in Notebook A.Expected behavior
Your Environment:
The CallbackFunction.from_python() method is intended to be a method which can convert an arbitrary Python callable (e.g. a function, typically) into a properly structured JavaScript function.
Because available Python transpiler libraries have proven to be ineffective (too limited, too slow, or both) the adopted strategy is to rely on generative AI to do the transpiling.
To that end, the .from_python() method should:
getsource() function.CallbackFunction instance.CallbackFunction.Hey,
Not sure if I am doing this right, but when I set the 'exporting' option they seem to get dropped in the resulting export:
Eg:
hc_options = {
    'exporting': {
        'buttons': {
            'contextButton': {
                'enabled': False
            },
            'exportButton': {
                'text': 'Download',
                'menuItems': ['downloadPNG']
            }
        }
    }
}
chart = Chart(options=hc_options)
chart.to_json()
Results in this (Notice the menuItems are missing):
{"userOptions": {"exporting": {"buttons": {"contextButton": {"enabled": false}, "exportButton": {"text": "Download"}}}}}
Am I doing it wrong, or is there a problem..?
(Also happens when I try to set the 'onclick' event..
I'm trying to plot a LineSeries with 4000+ points. When I try to render the chart, It fails on the front end and shows me this link in the console https://assets.highcharts.com/errors/12/.
It fails on the front end because the number of points exceeds the default turboThreshold value which is 1000. I can disable turbo mode by setting it to 0 and it works just fine, However, if the data returned could be in the format which could be supported by boost mode, it'd be great!
To explain this with an example, imagine this DataFrame saved in variable df (Using 3 points instead of 4000 for simplicity):
| timestamp | value |
|---|---|
| 2023-08-03 | 19517.0 |
| 2023-08-04 | 21262.0 |
| 2023-08-05 | 18535.0 |
If I create a LineSeries instance using the following code:
from highcharts_core.options.series.area import LineSeries

series = LineSeries.from_pandas(df, {"x": "timestamp", "y": "value"})
print(series.to_json())
This gives me the following ouput:
{"data": [{"x": 1691020800000.0, "y": 19517.0}, {"x": 1691107200000.0, "y": 21262.0}, {"x": 1691193600000.0, "y": 18535.0}], "type": "line"}However, for it to work in turbo mode, I need the data to be in the following format
{"data": [[1691020800000.0, 19517.0], [1691107200000.0, 21262.0], [1691193600000.0, 18535.0]], "type": "line"}Is it somehow possible to generate this output?
Regardless of the turbo mode, this format would be ideal to send large datasets through an API as the size generated would be less compared to the list of dict format.
In the attached documentation, the recommended approach for sending data to the client from the server is a JS literal, however I believe this has the potential for malicious arbitrary code injection https://core-docs.highchartspython.com/en/latest/quickstart.html.
Is there a recommended way around this ? If not, is there a feature that could be developed within the HighCharts front-end library to sanitise the received JS literal for consistency with the API?
Benefits of this feature could include:
Thanks heaps
PB
Describe the bug
The Chart.to_dict() method ignores keys which have a value of an empty string, but a value of empty string means something for the Annotations.draggable parameter (https://api.highcharts.com/highcharts/annotations.draggable) meaning that, in practice, you can't disable draggable annotations using that parameter.
To Reproduce
Steps to reproduce the behavior:
draggable parameter set to a value of ""chart_options = {
"title": {"text": "Chart title"},
"annotations": [
{
"labels": annotations, # List of annotations
"draggable": "",
"labelOptions": {
"backgroundColor": "rgba(252, 255, 255, 0.0)",
"borderColor": "rgba(252, 255, 255, 0.0)",
"allowOverlap": True,
"y": -2,
"overflow": "justify"
},
}
]
}
chart = Chart.from_options(chart_options)to_dict method and inspect the userOptions in the result. Note in the picture below that all parameters have been preserved except draggable:chart.to_dict()["userOptions"]
Expected behavior
The draggable parameter should be preserved, even when the value is an empty string.
Your Environment:
Additional context
Tracing the issue with the debugger, I isolated the following line as the problem. metaclasses.py -> lines 253, 254
elif value in [0, 0., False]:
    as_dict[key] = value
Locally, I was able to correct the issue by adding an empty string in the list of permitted values, though I don't know what other affects this might have.
I encounter this issue while integrating highcharts into my python application with https://github.com/highcharts-for-python/highcharts-core
Something went wrong with the Highcharts.js script. It should have been automatically loaded, but it did not load for over 3 seconds. Check your internet connection, and then if the problem persists please reach out for support.
This looks like an issue with loading the core scripts. Quick help or workaround would be highly appreciated.
Can't create zoomable charts.
I have a shared_options.js file with the following options defined
{
  chart: {
    zoomType: "x",
  },
  tooltip: {
    shared: true
  },
  xAxis: {
    type: "datetime",
  },
}
Creating any options instance seems to omit the zoomType option of chart. For example, if I do
from highcharts_core.highcharts import  SharedOptions
options = SharedOptions.from_js_literal("shared_options.js")
print(options.to_js_literal)
This generates the following options
Highcharts.setOptions({
  tooltip: {
  shared: true
},
  xAxis: {
  type: 'datetime'
}
});
From what I found the ChartOption class is missing the zoom_type property. I tried configuring the chart with zooming property but the charts still didn't zoom because from what I understand, the zooming property is ineffective if zoomType is not defined.
Environment:
copy() method raises an error
When creating an HighchartsOptions instance using from_js_literal(), Using the copy() method of the instance raises an Error
To Reproduce
Create a shared_options.js file with the following options defined
{
  chart: {
    zoomType: "x",
  },
  tooltip: {
    shared: true
  },
  xAxis: {
    type: "datetime",
  },
}
Running the following python code raises an error
from highcharts_core.highcharts import HighchartsOptions

shared_options = HighchartsOptions.from_js_literal("shared_options.js")
chart_A_options = shared_options.copy()
Environment:
The to_js_literal method is taking excessively long time.
import seaborn as sns

original_df = sns.load_dataset('iris')
df = sns.load_dataset('iris')
for i in range(26):
    df = df.append(original_df, ignore_index=True)
df
2. Now, create a Highcharts Python chart.
from highcharts_core.chart import Chart
from highcharts_core.options.series.scatter import ScatterSeries
from highcharts_core.options.plot_options import PlotOptions

ch = Chart.from_pandas(
    df,
    property_map={
        'x': 'petal_width',
        'y': 'sepal_length',
    },
    series_type='scatter',
)

# Disable boost.
ch.options.plot_options = PlotOptions(series=ScatterSeries(turbo_threshold=0))display(ch)
I observed that:
DataFrame decreases, so does the time taken by to_js_literal method.3.10.4Highcharts Python using pip install highcharts-core command.Describe the bug
pulling data from a pandas dataframe assigns a None value to my data. it renders 1000+ None Data objects on the frontend in
javascript (Accurate to the size of my dataset)
More details TBD, but suspicion is that it has to do with EnforcedNull handling.
Problem
When a highcharts series is created from a pandas DataFrame(), If the DataFrame contains any NaN or None values, The to_json() & to_dict() methods return a "null" string. The to_js_literal() however returns a correct null value.
Example
# Sample DataFrame saved in df
timestamp       value
1680307200000     NaN
1680393600000  5757.0
1680480000000  6521.0
After creating Highcharts series using series = LineSeries.from_pandas(df,property_map={"x": "timestamp", "y": "value"})
# series.to_js_literal() outputs
"{
  data: [{
  x: 1680307200000,
  y: null
},
{
  x: 1680393600000,
  y: 5757.0
},
{
  x: 1680480000000,
  y: 6521.0
}],
  type: 'column'
}"

# series.to_dict() outputs
{'data': [{'x': 1680307200000, 'y': 'null'}, {'x': 1680393600000, 'y': 5757.0}, {'x': 1680480000000, 'y': 6521.0}], 'type': 'column'}

# series.to_json() ouputs
"{"data": [{"x": 1680307200000, "y": "null"}, {"x": 1680393600000, "y": 5757.0}, {"x": 1680480000000, "y": 6521.0}], "type": "column"}"
Expected behavior
I'm not sure if this is by design but I was expecting to_dict() to return None & to_json to return null (Without quotes).
While the to_json() method can be parsed on the frontend using JSON.parse(), the series won't plot because the the value 'null' is treated as a string and adding series to the chart wouldn't plot anything.
Environment:
Hi there,
Using the below code, the Chart renders, but the date representations in the xAxis appear wrong.
It's displaying the date associated with 20 as Tues, 20 Jan, 08:36:57.600
from highcharts_core.chart import Chart
from highcharts_core.options.series.area import LineSeries
from highcharts_core.global_options.shared_options import SharedOptions
import pandas as pd
import datetime as dt
df2 = pd.DataFrame({'date':[dt.datetime(2023,1,1), dt.datetime(2023,1,2)], 'sales': [10,20]})

my_chart = Chart.from_pandas(df2,
                            property_map = {
                                'x': 'date',
                                'y': 'sales',
                            },
                            series_type = 'line')
my_chart.options.plot_options: {
        'series': {
            'marker': {
                'enabled': False,
                'radius': 5.5
            }
        }
    }
my_chart.options.x_axis = {
        'type': 'datetime',
        'dateTimeLabelFormats': {
            'month': '%e. %b',
            'year': '%b'
        },
        'title': {
            'text': 'Date'
        },
         'plotLines': [{
            'color': '#FF0000',
            'width': 2,
            'value': dt.datetime(2023,1,1).timestamp()
        }]
    }

my_chart.display()
my_chart.to_js_literal()
js_literal returns
"document.addEventListener('DOMContentLoaded', function() {\nHighcharts.chart(null,\n{\n series: [{\n data: [{\n x: 1672531200.0,\n y: 10\n},\n{\n x: 1672617600.0,\n y: 20\n}],\n type: 'line'\n}],\n xAxis: {\n plotLines: [{\n color: '#FF0000',\n value: 1672531200.0,\n width: 2\n}],\n title: {\n text: 'Date'\n},\n type: 'datetime'\n}\n},\n);\n});"
How do I get the correct dates to display on the above chart?
Your Environment:
highcharts-core 1.1.1 pypi_0 pypiProblem
Creating a Series object using the from_pandas method raises a HighchartsValueError if the column is of type datetime. The problem started appearing after upgrading highcharts_core to v1.4.0.
Imagine a DataFrame df with the following data:
    Timestamp  Value
0  2023-10-01     10
1  2023-10-02     20
2  2023-10-03     30
3  2023-10-04     40
4  2023-10-05     50
When creating a LineSeries object as shown
from highcharts_core.options.series.area import LineSeries
LineSeries.from_pandas(df, property_map={"x": "timestamp", "y": "value"})
The following error is raised
Traceback (most recent call last):
  File "/usr/local/lib/python3.10/site-packages/highcharts_core/options/series/data/collections.py", line 274, in __setattr__
    setattr(data_points[index], name, value[index])
  File "/usr/local/lib/python3.10/site-packages/highcharts_core/options/series/data/cartesian.py", line 134, in x
    value = validators.string(value)
  File "/usr/local/lib/python3.10/site-packages/validator_collection/_decorators.py", line 51, in func_wrapper
    return func(*args, **updated_kwargs)
  File "/usr/local/lib/python3.10/site-packages/validator_collection/validators.py", line 241, in string
    raise errors.CannotCoerceError('value (%s) was not coerced to a string' % value)
validator_collection.errors.CannotCoerceError: value (2023-10-01T00:00:00.000000000) was not coerced to a string

During handling of the above exception, another exception occurred:

Traceback (most recent call last):
  File "<stdin>", line 1, in <module>
  File "/usr/local/lib/python3.10/site-packages/highcharts_core/options/series/base.py", line 2108, in from_pandas
    series_list = cls._from_pandas_multi_map(df,
  File "/usr/local/lib/python3.10/site-packages/highcharts_core/options/series/base.py", line 1859, in _from_pandas_multi_map
    setattr(collection_instance, key, prop_array)
  File "/usr/local/lib/python3.10/site-packages/highcharts_core/options/series/data/collections.py", line 285, in __setattr__
    raise errors.HighchartsValueError(
highcharts_core.errors.HighchartsValueError: Unable to set x to 2023-10-01T00:00:00.000000000. If using a helper method, this is likely due to mismatched columns. Please review your input data.
To Repoduce run the following code
import pandas as pd
import datetime as dt
from highcharts_core.options.series.area import LineSeries

# Generate timestamps for the first 5 days of October 2023
start_date = dt.datetime(2023, 10, 1)
end_date = dt.datetime(2023, 10, 5)
date_range = [start_date + dt.timedelta(days=i) for i in range(5)]

# Create a list of values
values = [10, 20, 30, 40, 50]

# Create a DataFrame
df = pd.DataFrame({'Timestamp': date_range, 'Value': values})
LineSeries.from_pandas(df, property_map={"x": "Timestamp", "y": "Value"})
Environment:
It would be useful to add a .convert_to(series_type) method to the SeriesBase class. This method would convert from one series instance to a second series instance.
For the sake of simplicity, the strategy to adopt should be:
IMPORTANT: This will be a lossy-operation for certain conversions. The reason for that is because not all series have the same underlying data structures, and not all series have the same properties. It is unrealistic to validate / warn when there is a data loss occurring within the conversion - users should know what they are doing.
Furthermore, in certain circumstances an error may get thrown which will require the addition of a special error (HighchartsSeriesConversionError).
A declarative, efficient, and flexible JavaScript library for building user interfaces.
🖖 Vue.js is a progressive, incrementally-adoptable JavaScript framework for building UI on the web.
TypeScript is a superset of JavaScript that compiles to clean JavaScript output.
An Open Source Machine Learning Framework for Everyone
The Web framework for perfectionists with deadlines.
A PHP framework for web artisans
Bring data to life with SVG, Canvas and HTML. 📊📈🎉
JavaScript (JS) is a lightweight interpreted programming language with first-class functions.
Some thing interesting about web. New door for the world.
A server is a program made to process requests and deliver data to clients.
Machine learning is a way of modeling and interpreting data that allows a piece of software to respond intelligently.
Some thing interesting about visualization, use data art
Some thing interesting about game, make everyone happy.
We are working to build community through open source technology. NB: members must have two-factor auth.
Open source projects and samples from Microsoft.
Google ❤️ Open Source for everyone.
Alibaba Open Source for everyone
Data-Driven Documents codes.
China tencent open source team.