In this challenge, the goal is to use Python, particularly through the sklearn library, and Unsupervised Machine Learning to cluster cryptocurrencies based on their patterns of 24-hour or 7-day price changes. <br>
Substantively, the project just groups cryptocurrencies that have had similar price change behaviors, i.e., it is descriptive.
The datasets used for analysis was provided by edX Boot Camps LLC, and is intended for educational purposes only. To ensure the data quality and representativeness, I performed some basic preprocessing steps such as data cleaning, feature selection "price_change_percentage_24h" and "price_change_percentage_7d", normalization, and checking for missing values. I utilized the StandardScaler() module from scikit-learn to normalize
all dimensions of the data on a single scale.
<br>
I implemented the Elbow Method to find the best value for k using the original scaled dataframe. From the elbow curve above, 4 seems to be the best number of centroids to use in the kMeans clustering algorithm.
- Fig 1 | Elbow curve for brute force Kmeans on Original Scaled dataset:
- The best value for k = 4. After that point, the line becomes mostly horizontal, because more clusters only reduce the inertia by a small amount.

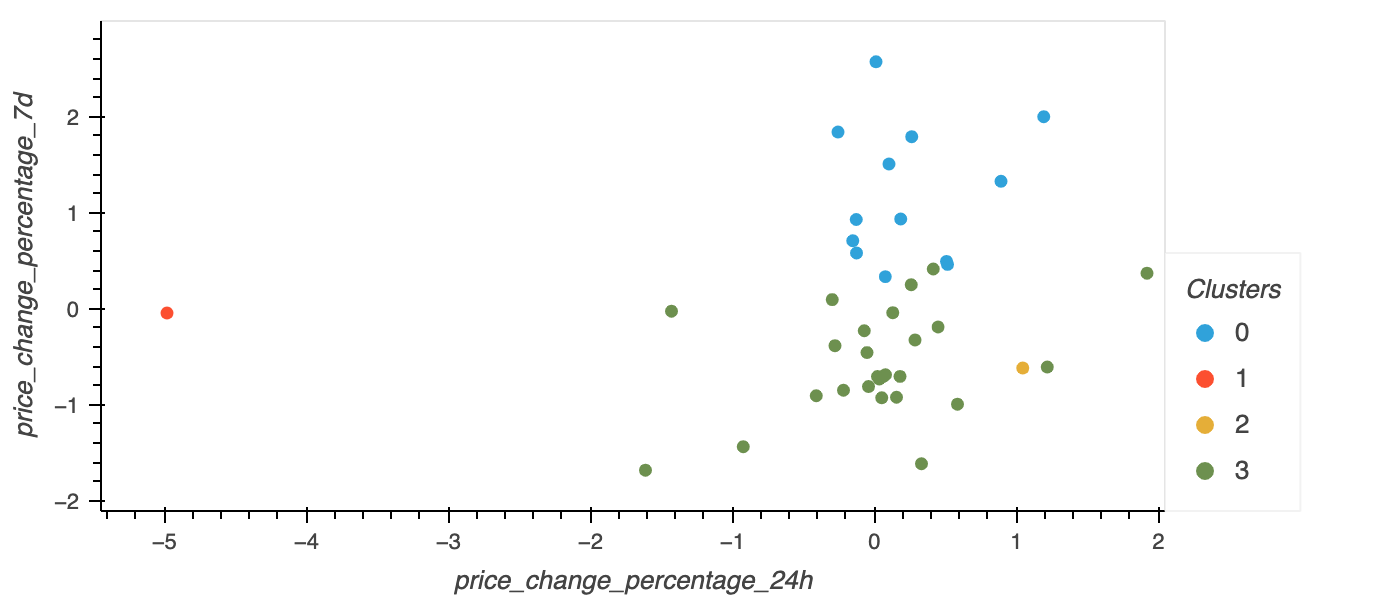
K-means identified above, was then used to train the data to produce 4 clusters of the relationship between 24-hour and 7-day cryptocurrency price changes. The value of clustering is that the machine can determine and display patterns it discovers by itself, without pre-established labels. <br>
I created a scatter plot using hvPlot with the seleted features "price_change_percentage_24h" and "price_change_percentage_7d". The color represents the labels found using K-means. The coin_id column was added in the hover_cols parameter to identify the cryptocurrency represented by each data point.
- Fig 2 | Predicted clusters from the original normalized data of the relationship between 24-hour and seven-day cryptocurrency price changes.
<br>
Principal component analysis (PCA) was used to fit the dimensions of the dataset to a predetermined three principal components.
In this phase, I implemented dimensionality reduction technique to reduce the features to three principal components. I also retrieve the explained variance to determine how much information can be attributed to each principal component. <br>
- The total explained variance of the three principal components is 89.5%.
<br>This means that although we reduced the dimension of the scaled data to 3 but only lost the ability to explain 10.5% of the variance in the dataset.

Using the elbow method once again, I obsereved the best value for k (Fig 3) using the PCA data. The elbow curve for the PCA dimension redution data again shows a best k-value = 4. This is perhaps more pronounced compared to the best predicted k-value in the original dataset.
- Fig 3 | The best value for k = 4.

<br>
K-Means model was used again, this time to train the PCA-output data, to produce four clusters of the relationship between the first two of three principal components (PC1 and PC2). These two are used in a two-dimensional plot because they each explain more variance in the original dataset than PC3.
- Fig 4 | Predicted clusters from the PCA-output data of the relationship between the first and second of three principal components, which explain the most variance of the original dataset.

<br>
Question: After visually analyzing the cluster analysis results, what is the impact of using fewer features to cluster the data using K-Means?
Answer: The impact of using PCA data results in tighter, more compact, less dispersed clusters. This is because the goal of PCA is to capture as much of the variance in the data with fewer features (i.e., principal components). This can help clarify patterns in the data, especially when visualizing it. With less "noise", clusters are more condensed.
