Note: For the screenshots, you can store all of your answer images in the answer-img directory.
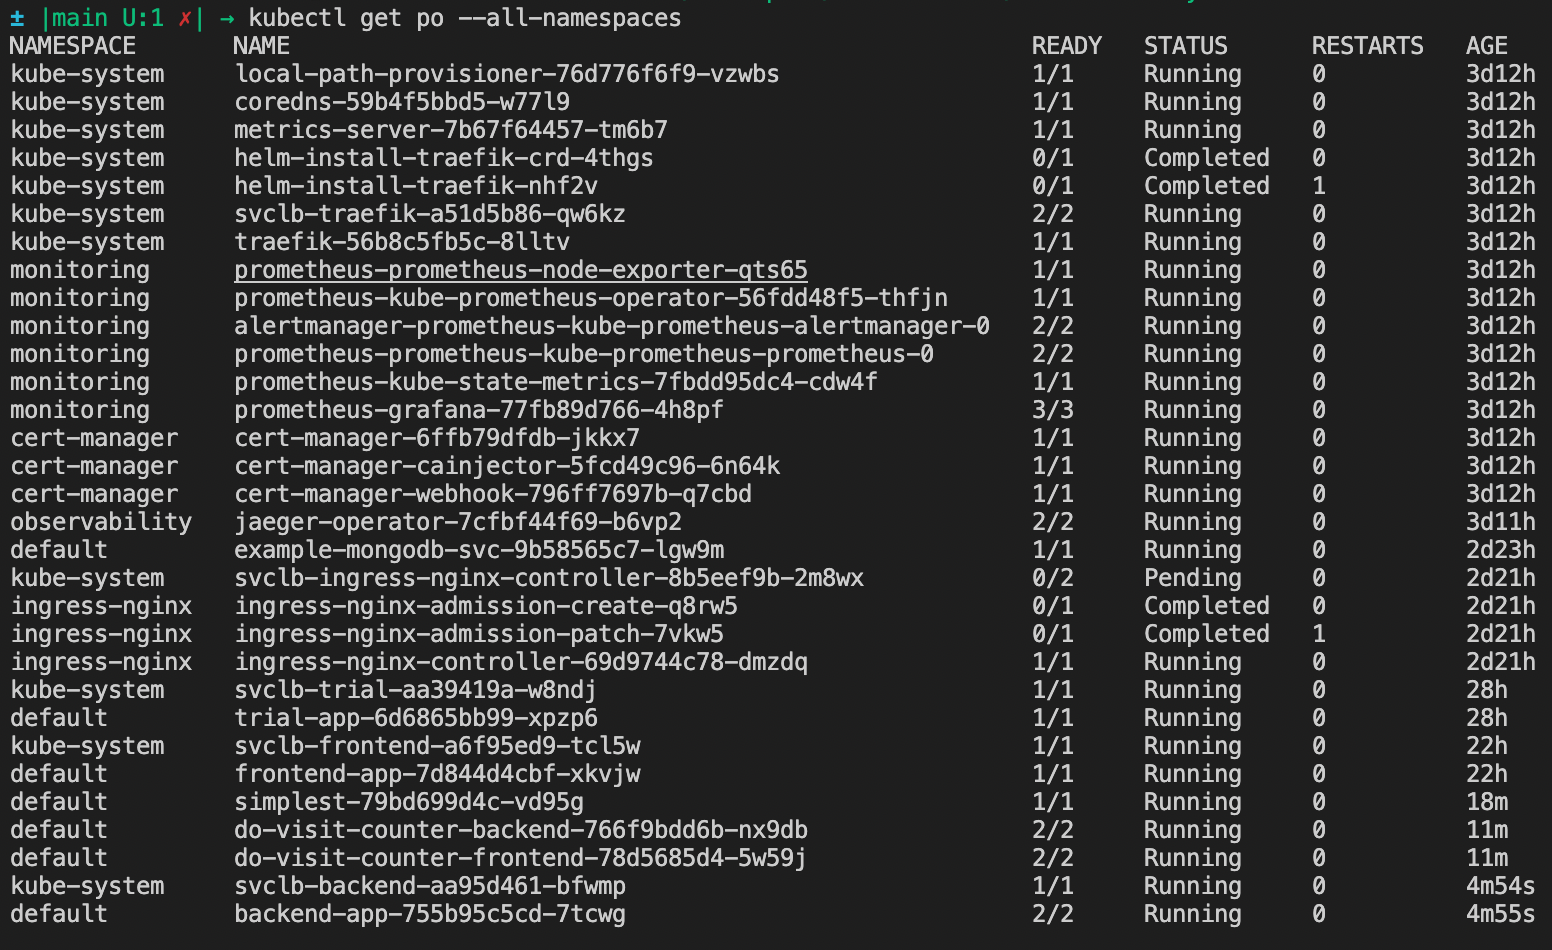
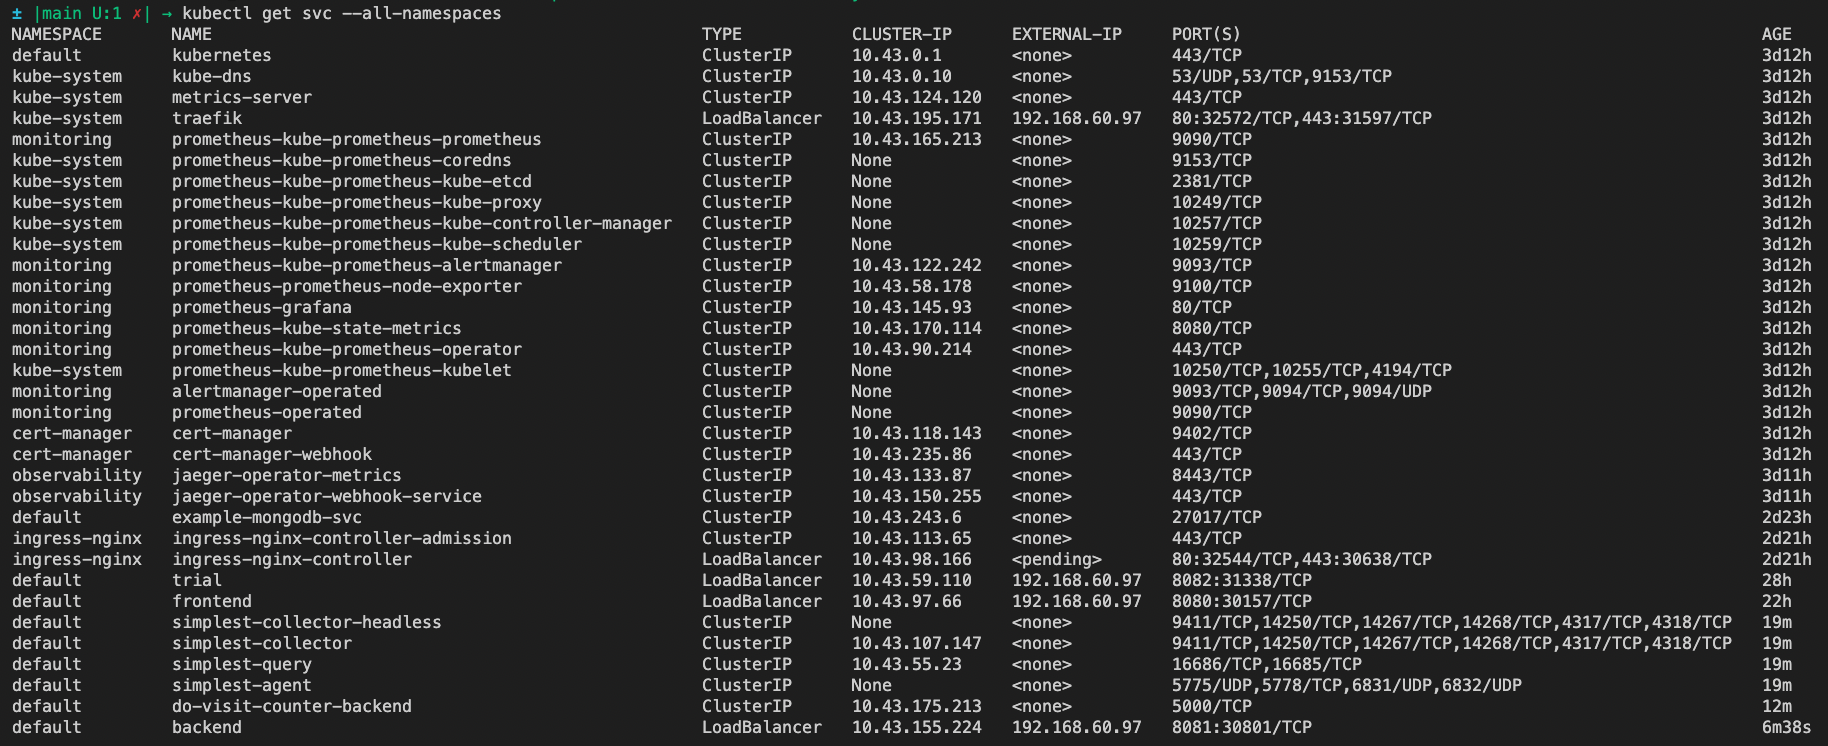
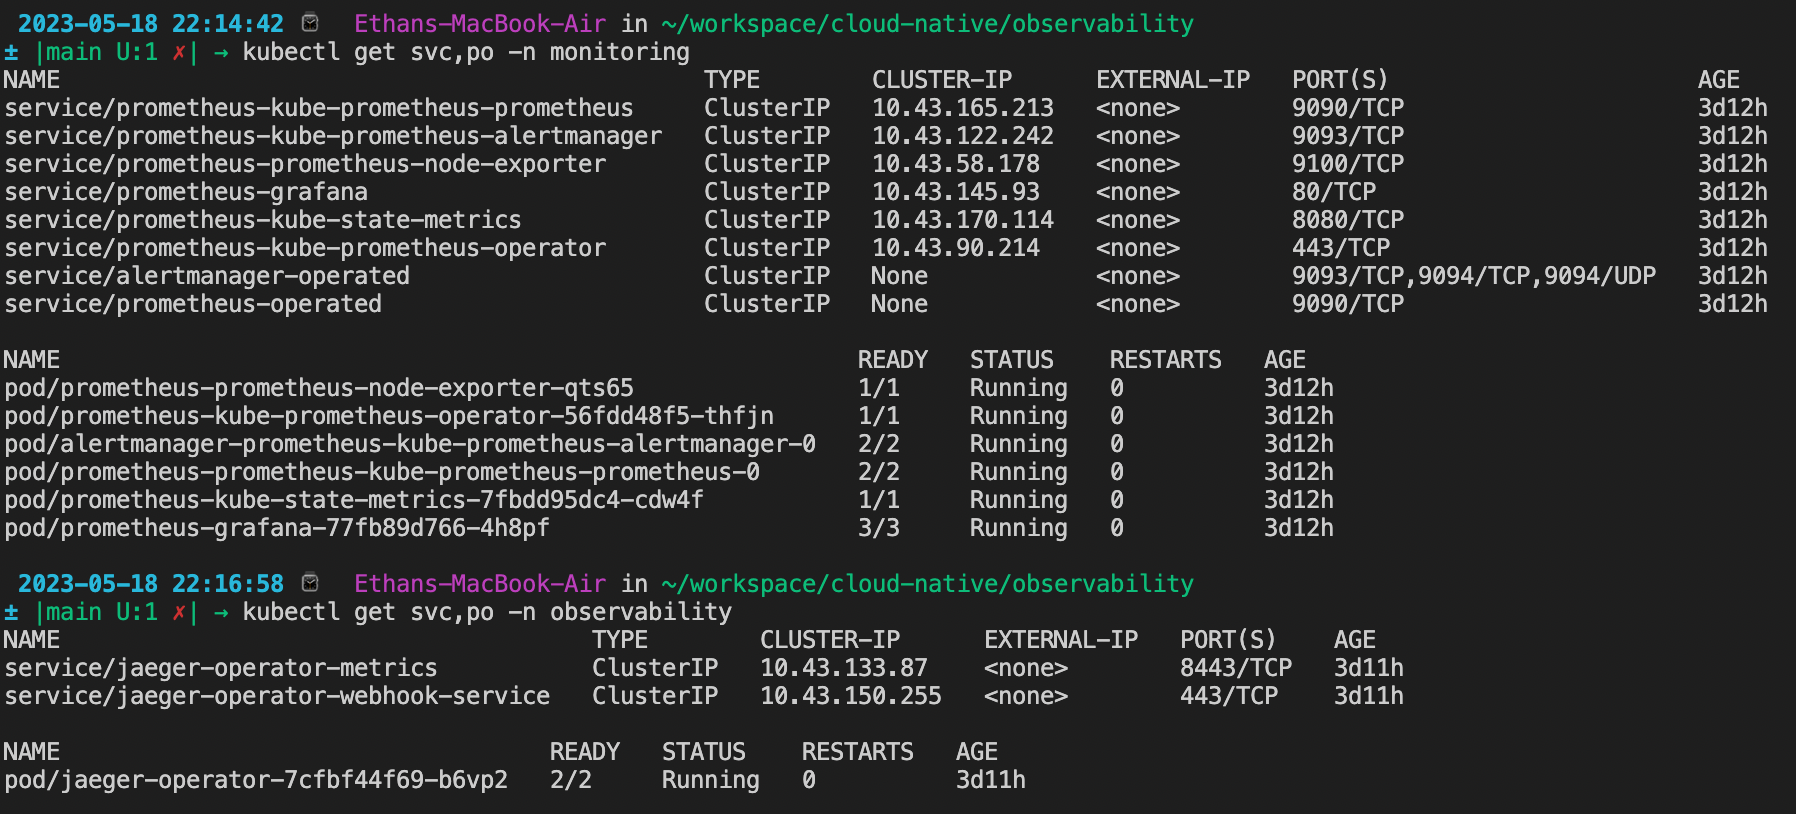
TODO: run kubectl command to show the running pods and services for all components. Take a screenshot of the output and include it here to verify the installation
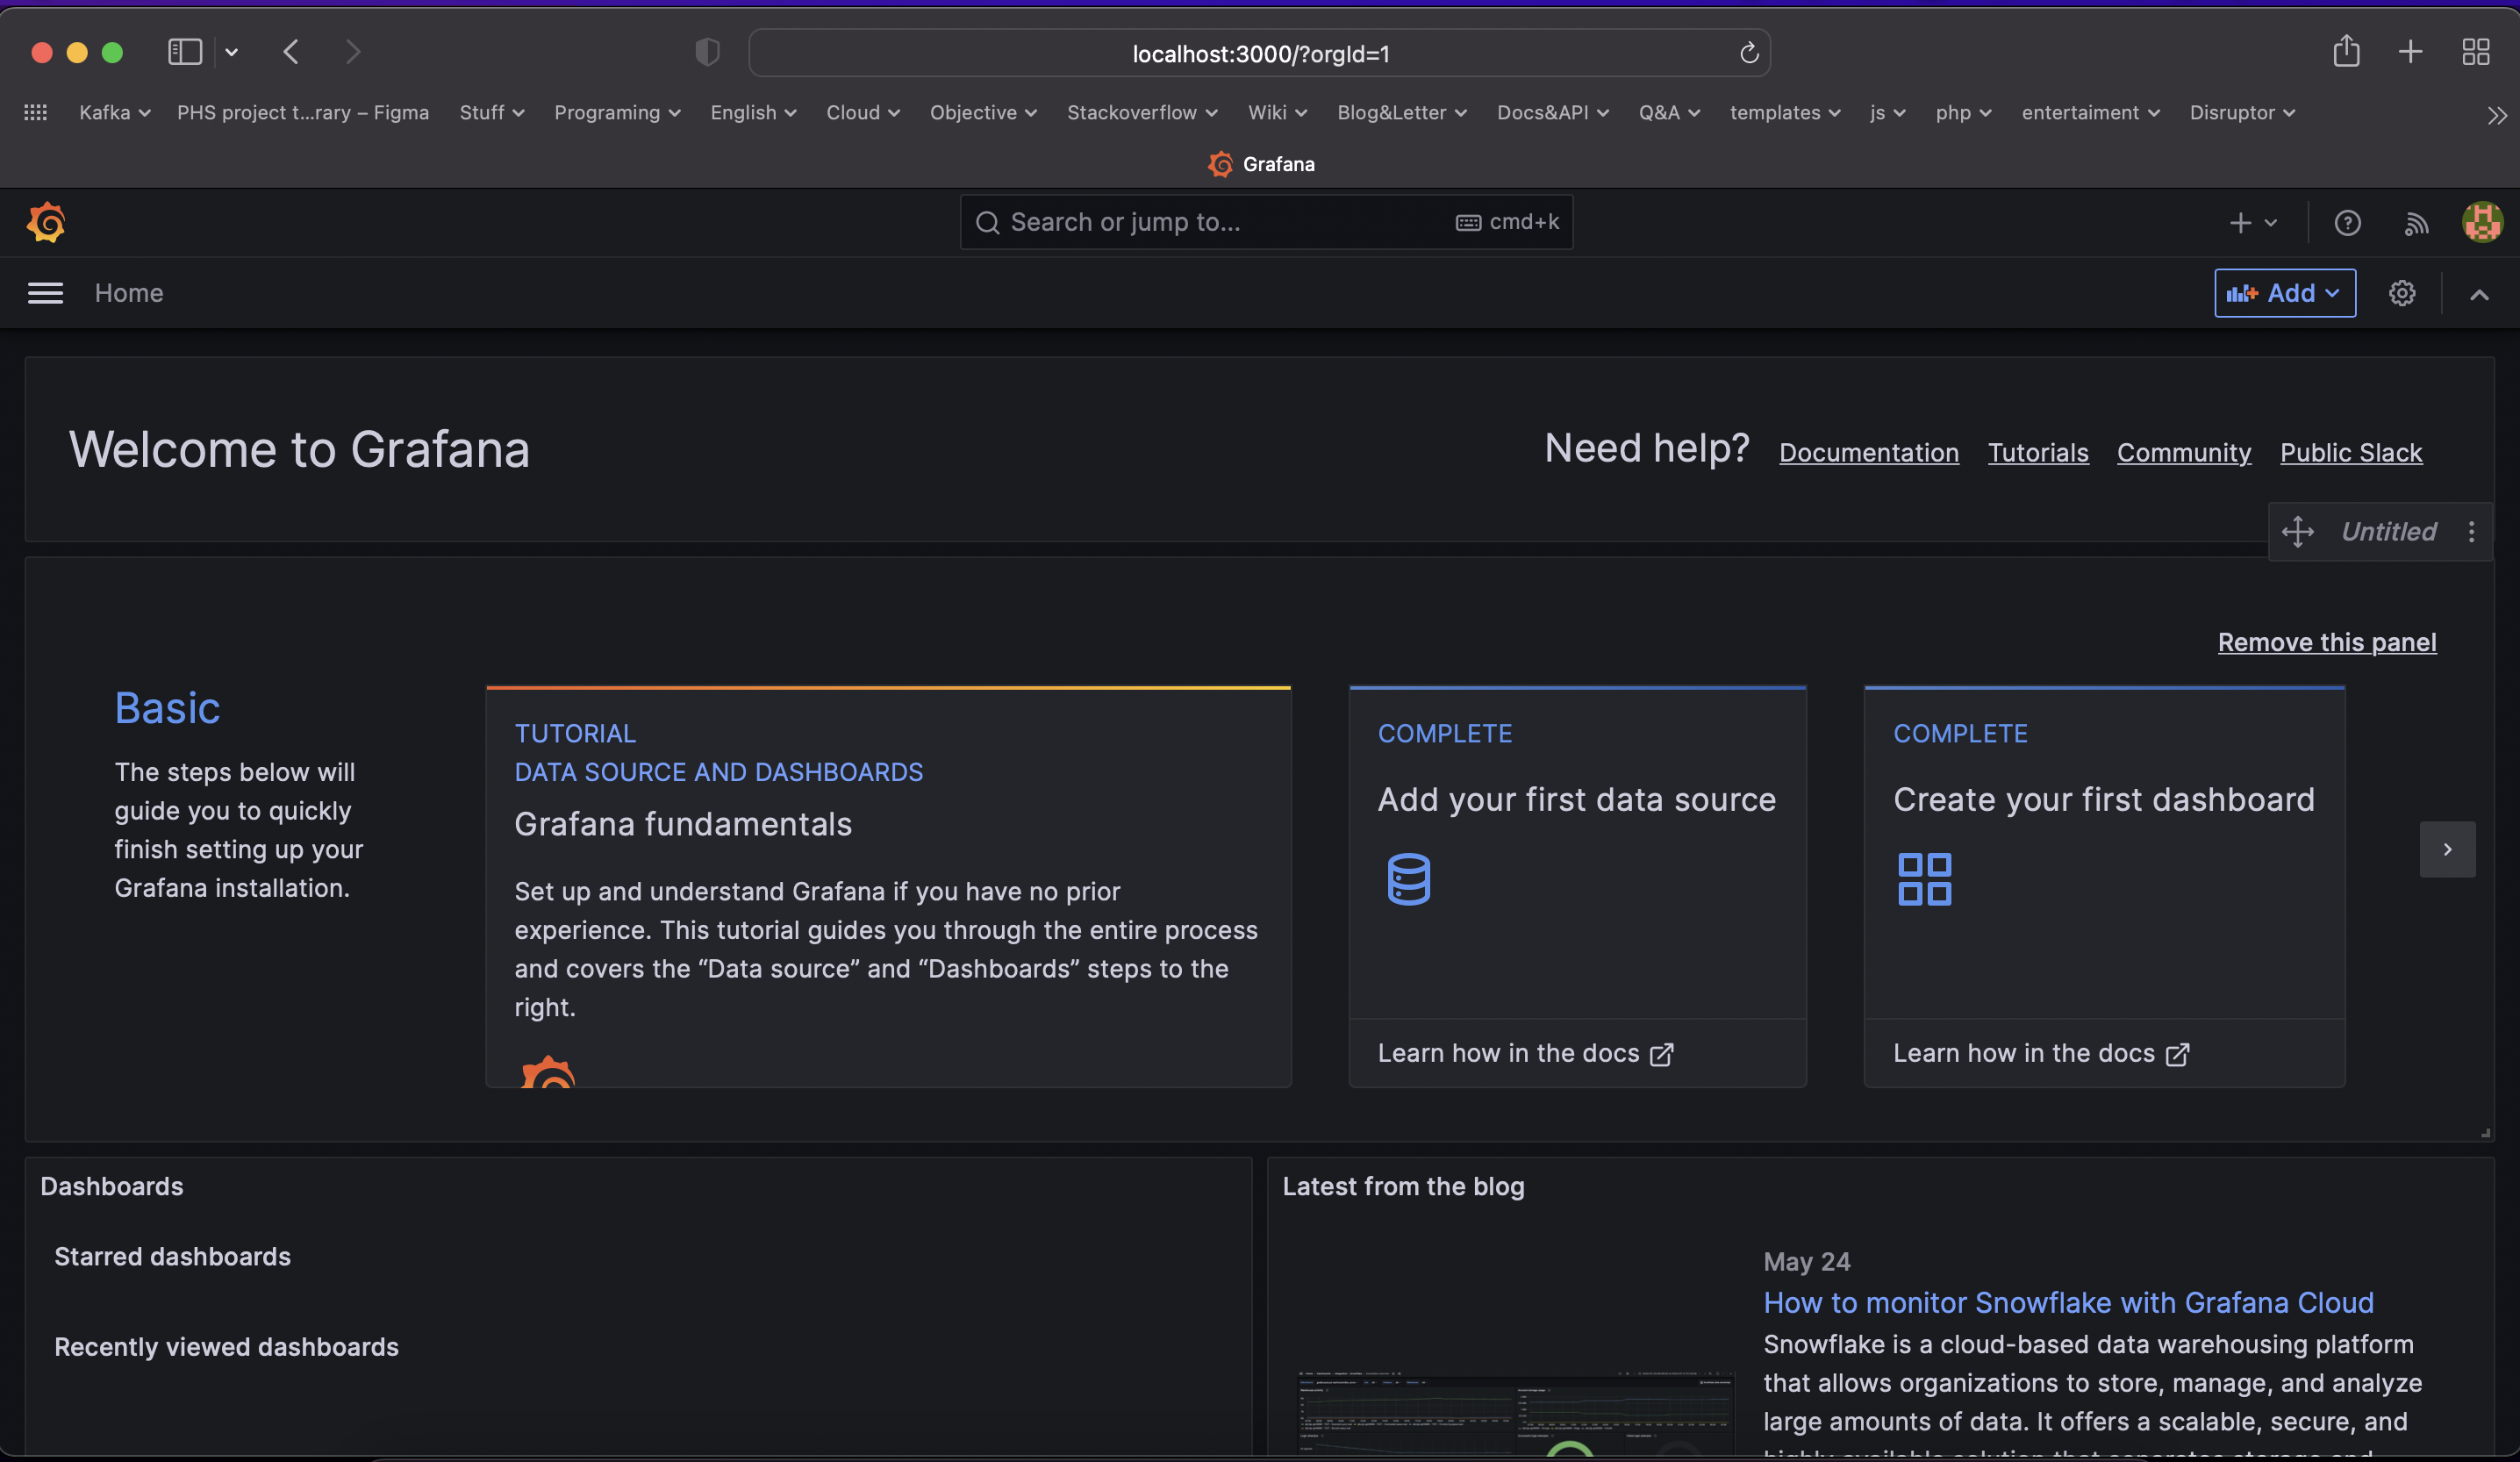
TODO: Expose Grafana to the internet and then setup Prometheus as a data source. Provide a screenshot of the home page after logging into Grafana.
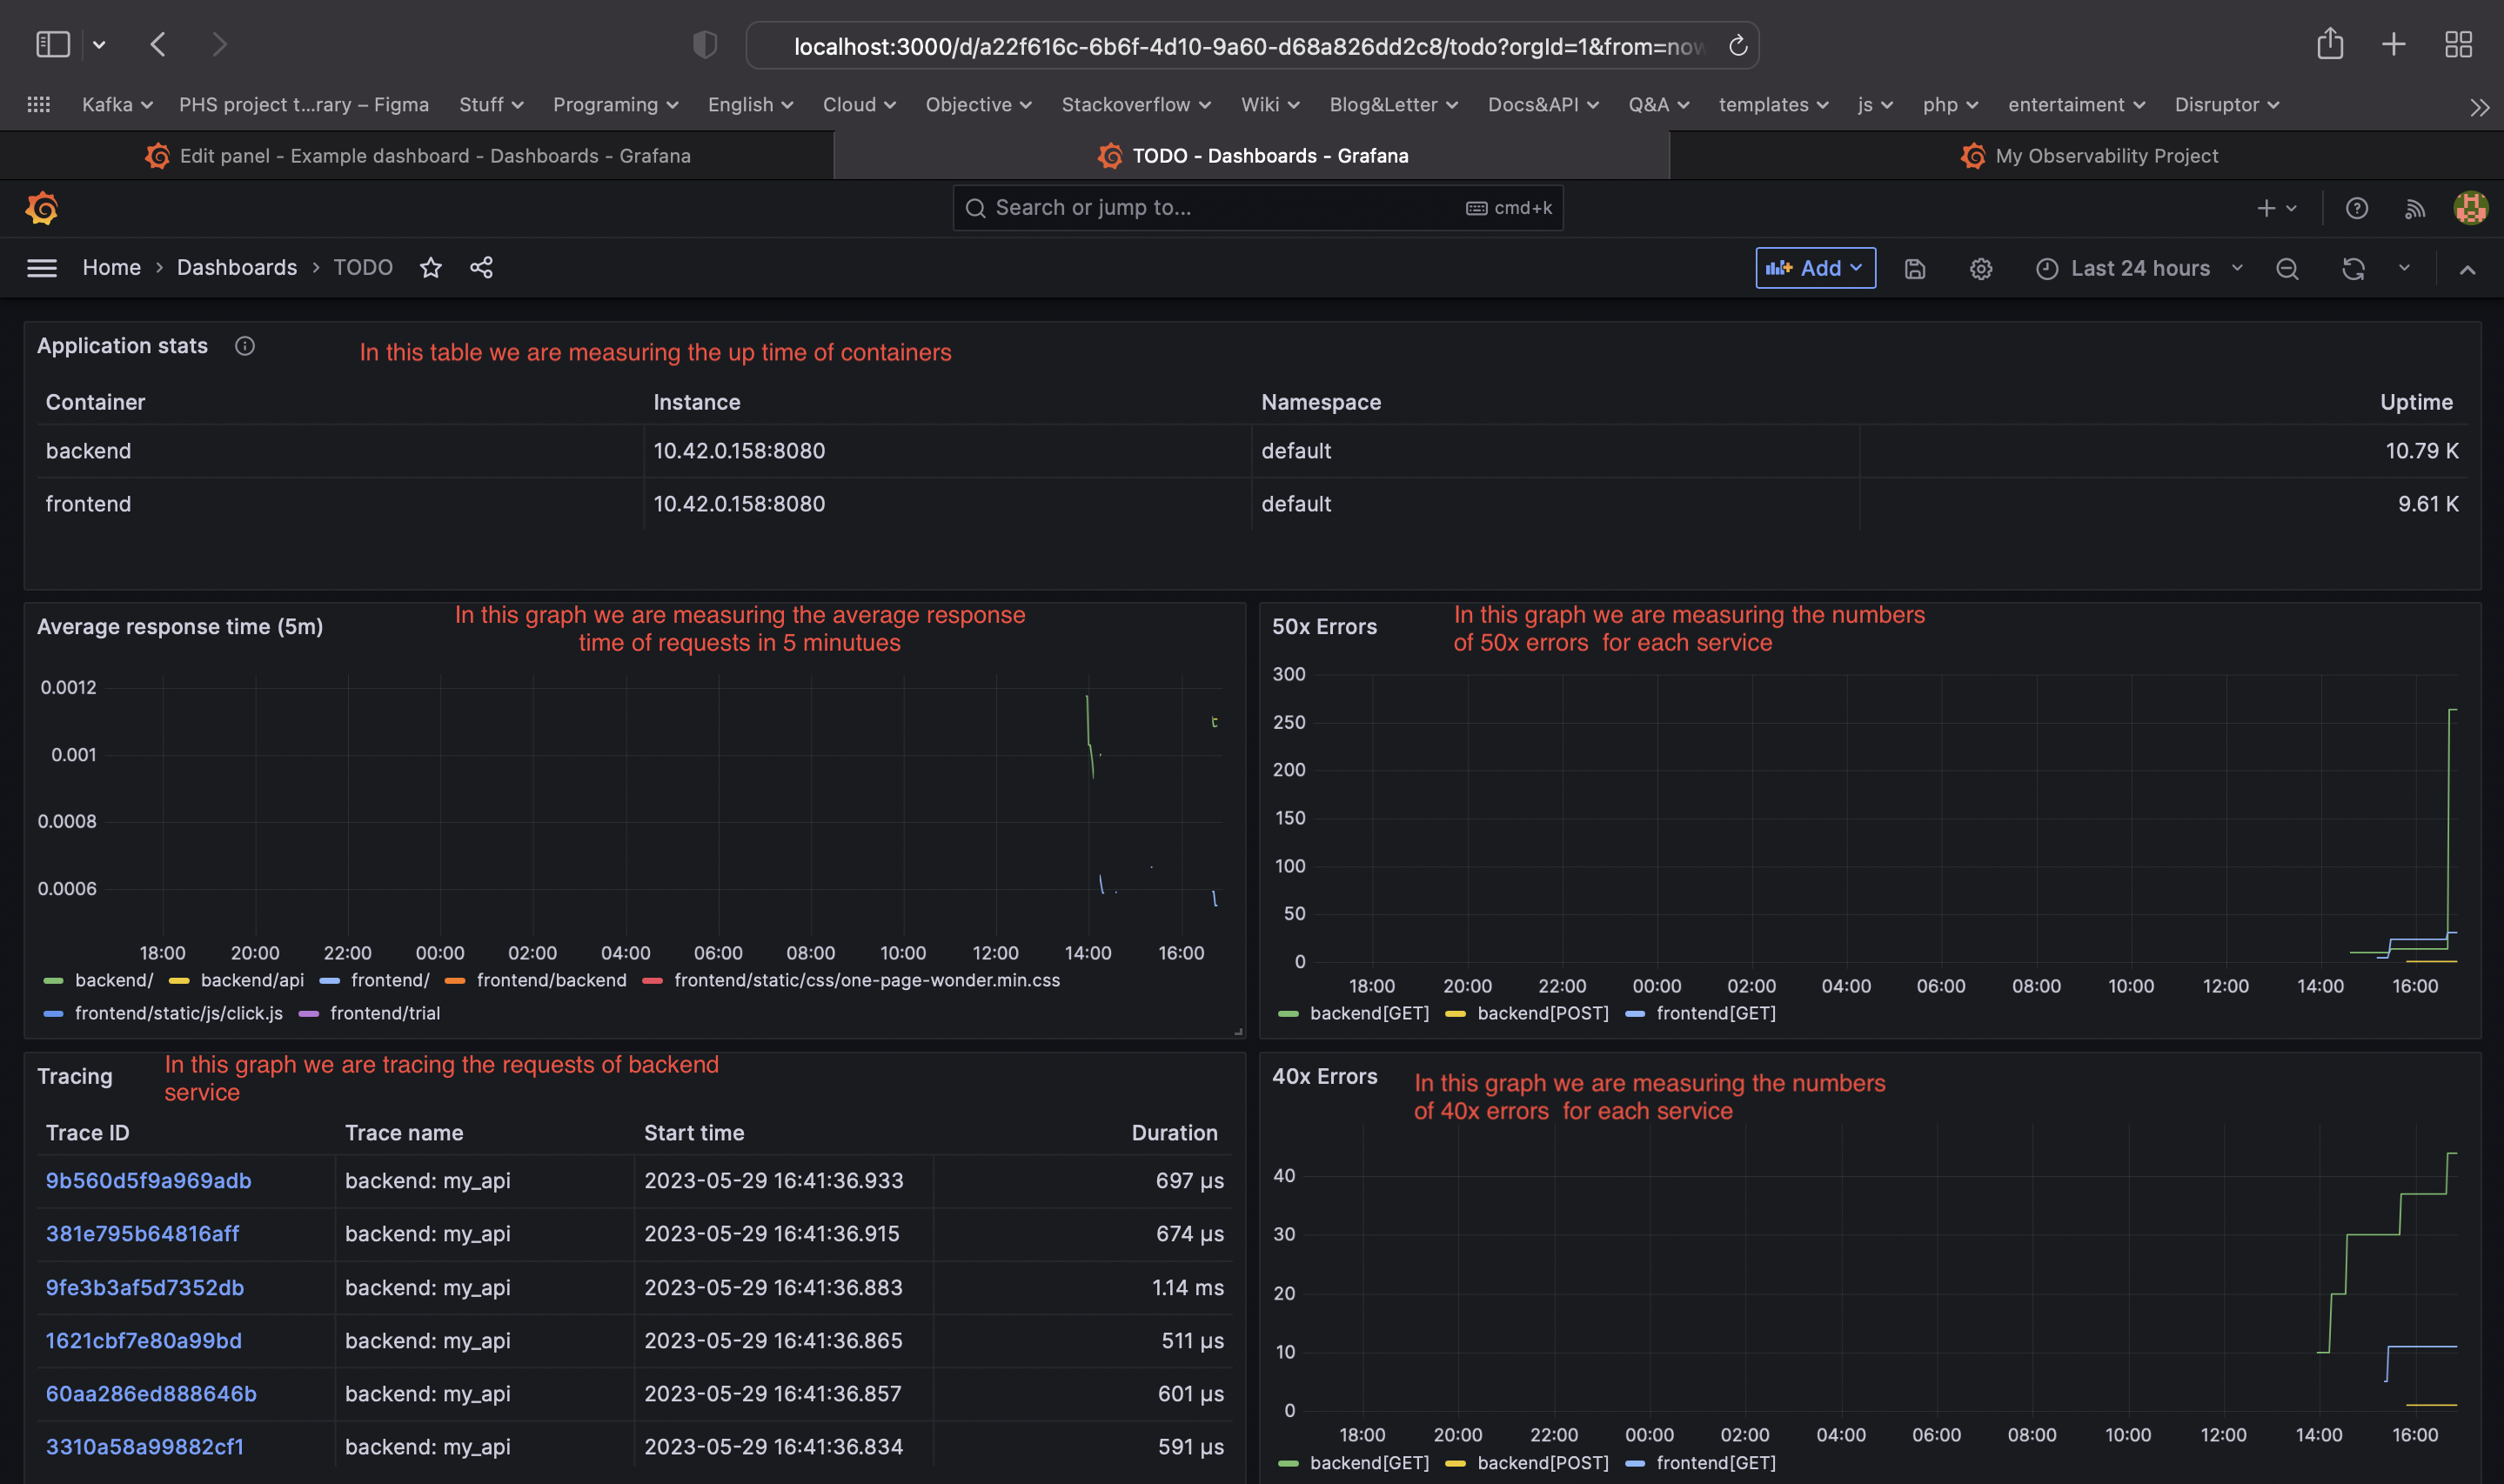
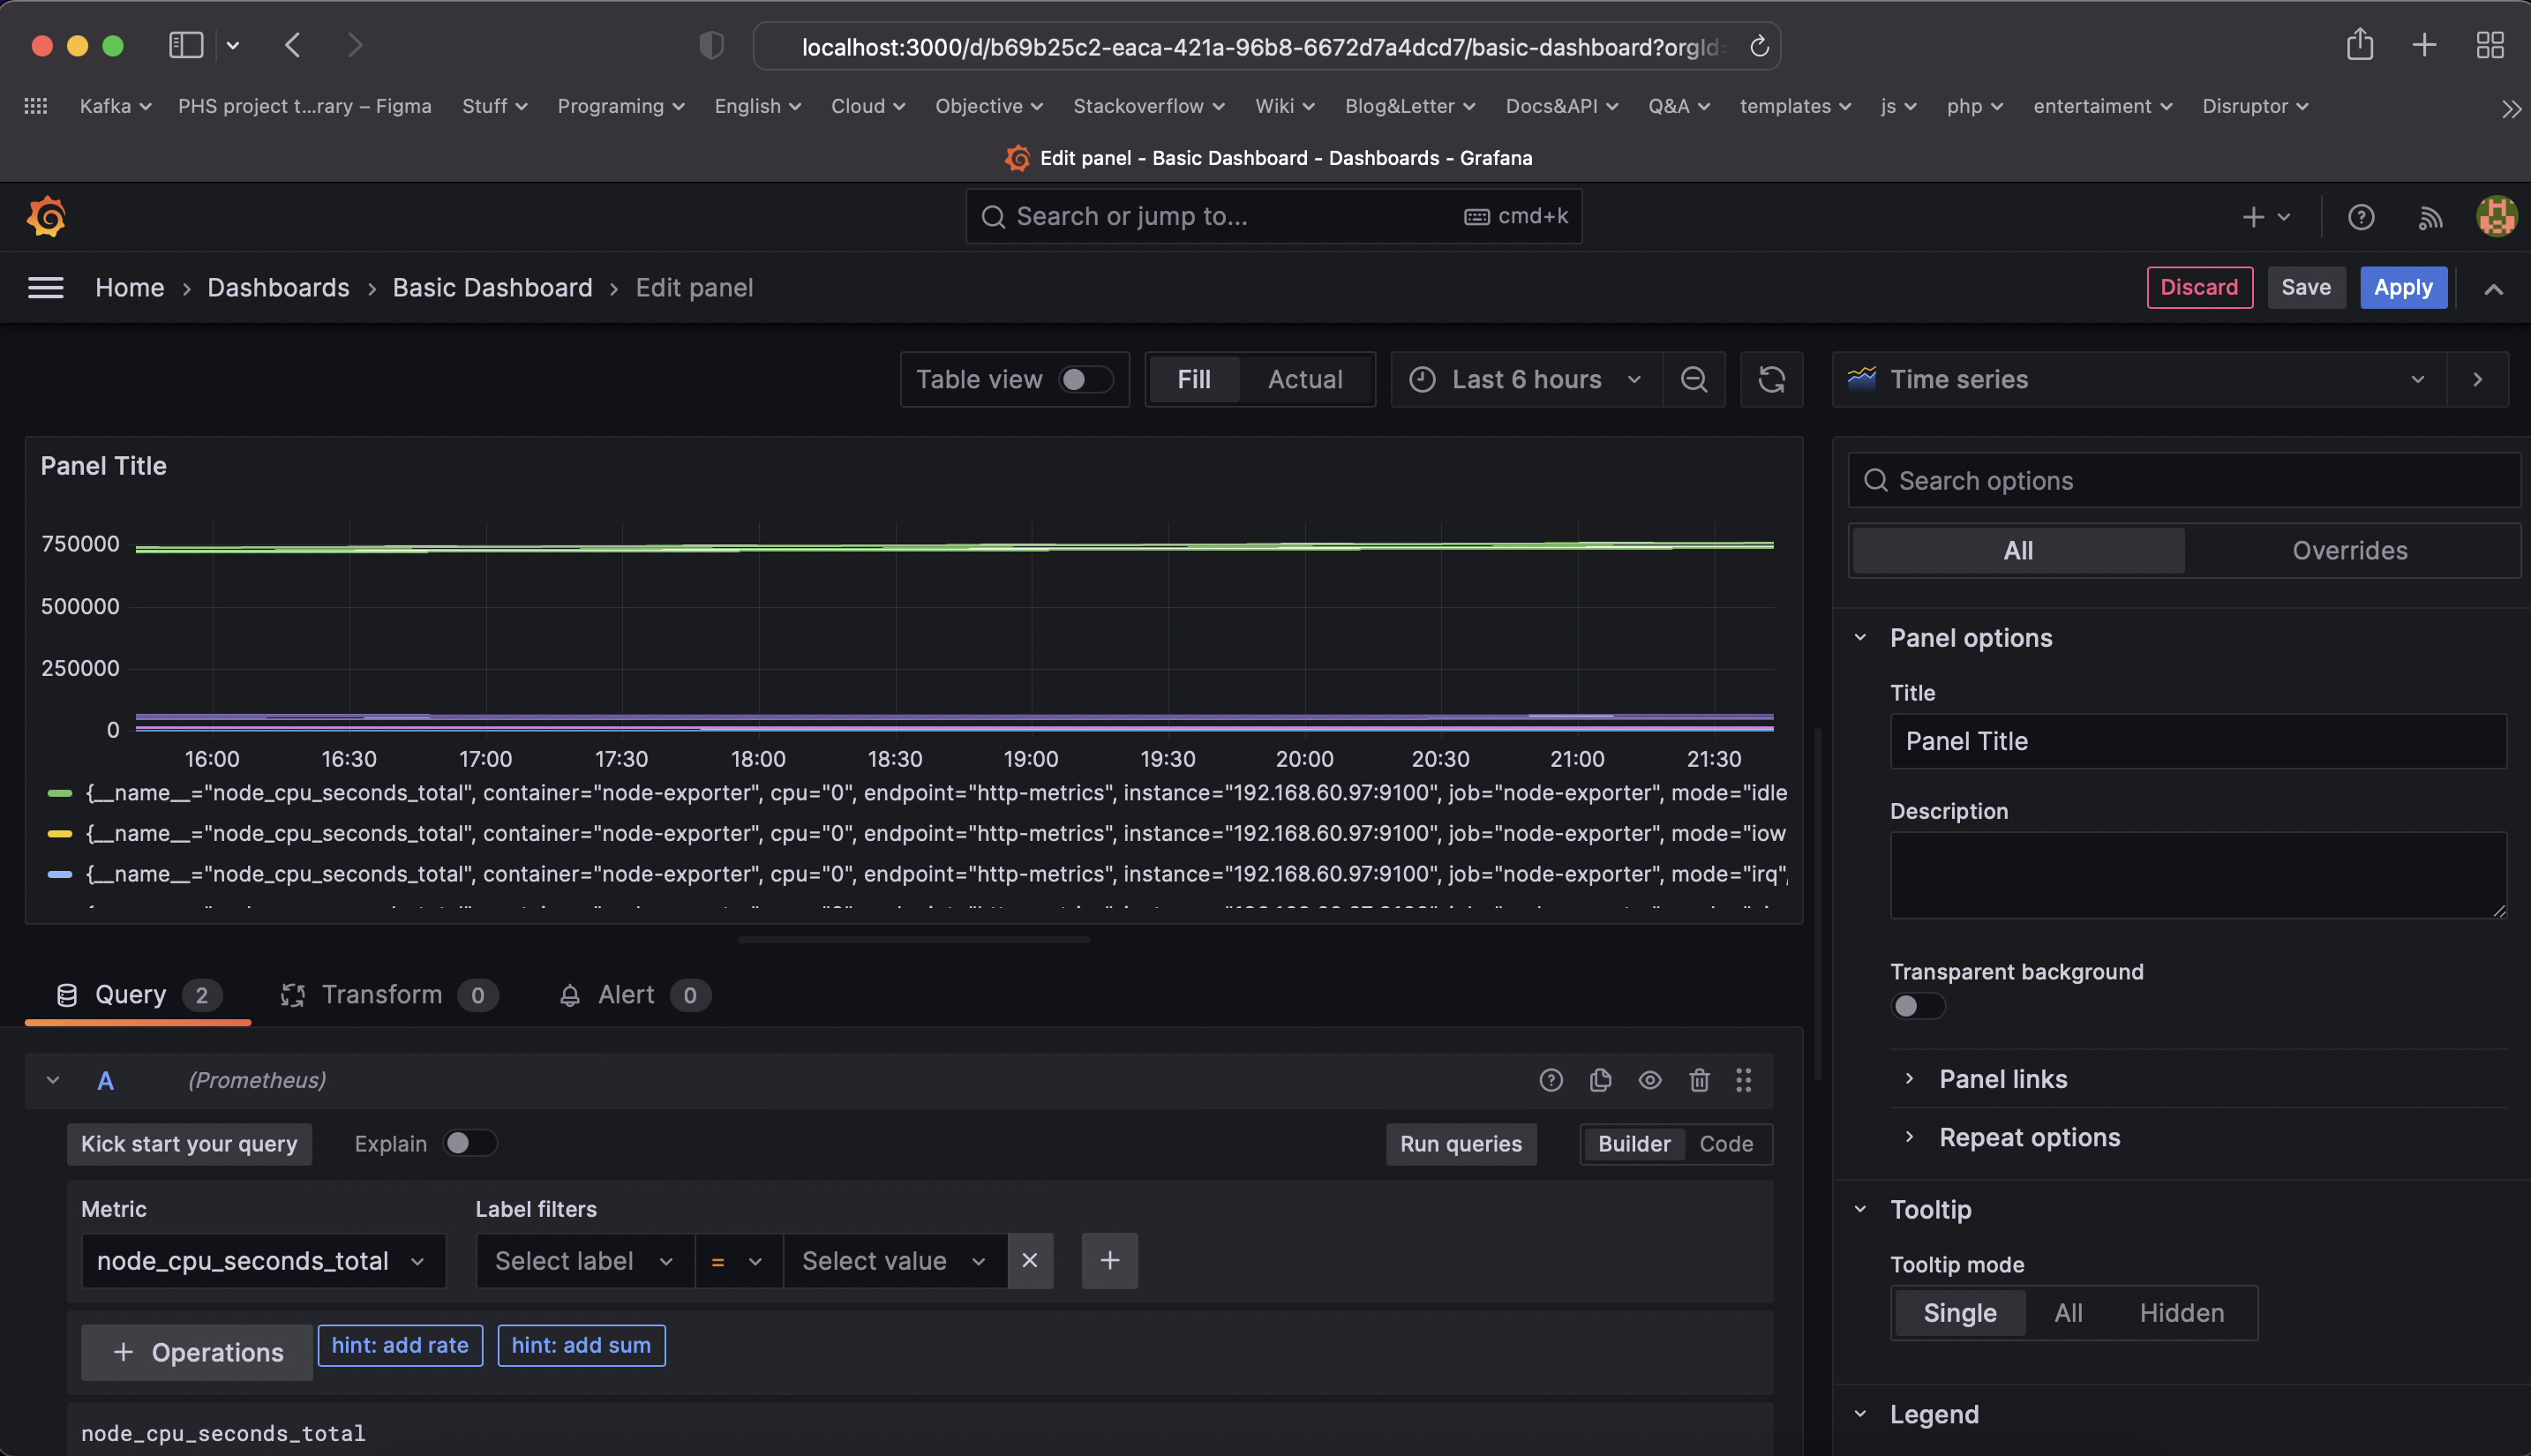
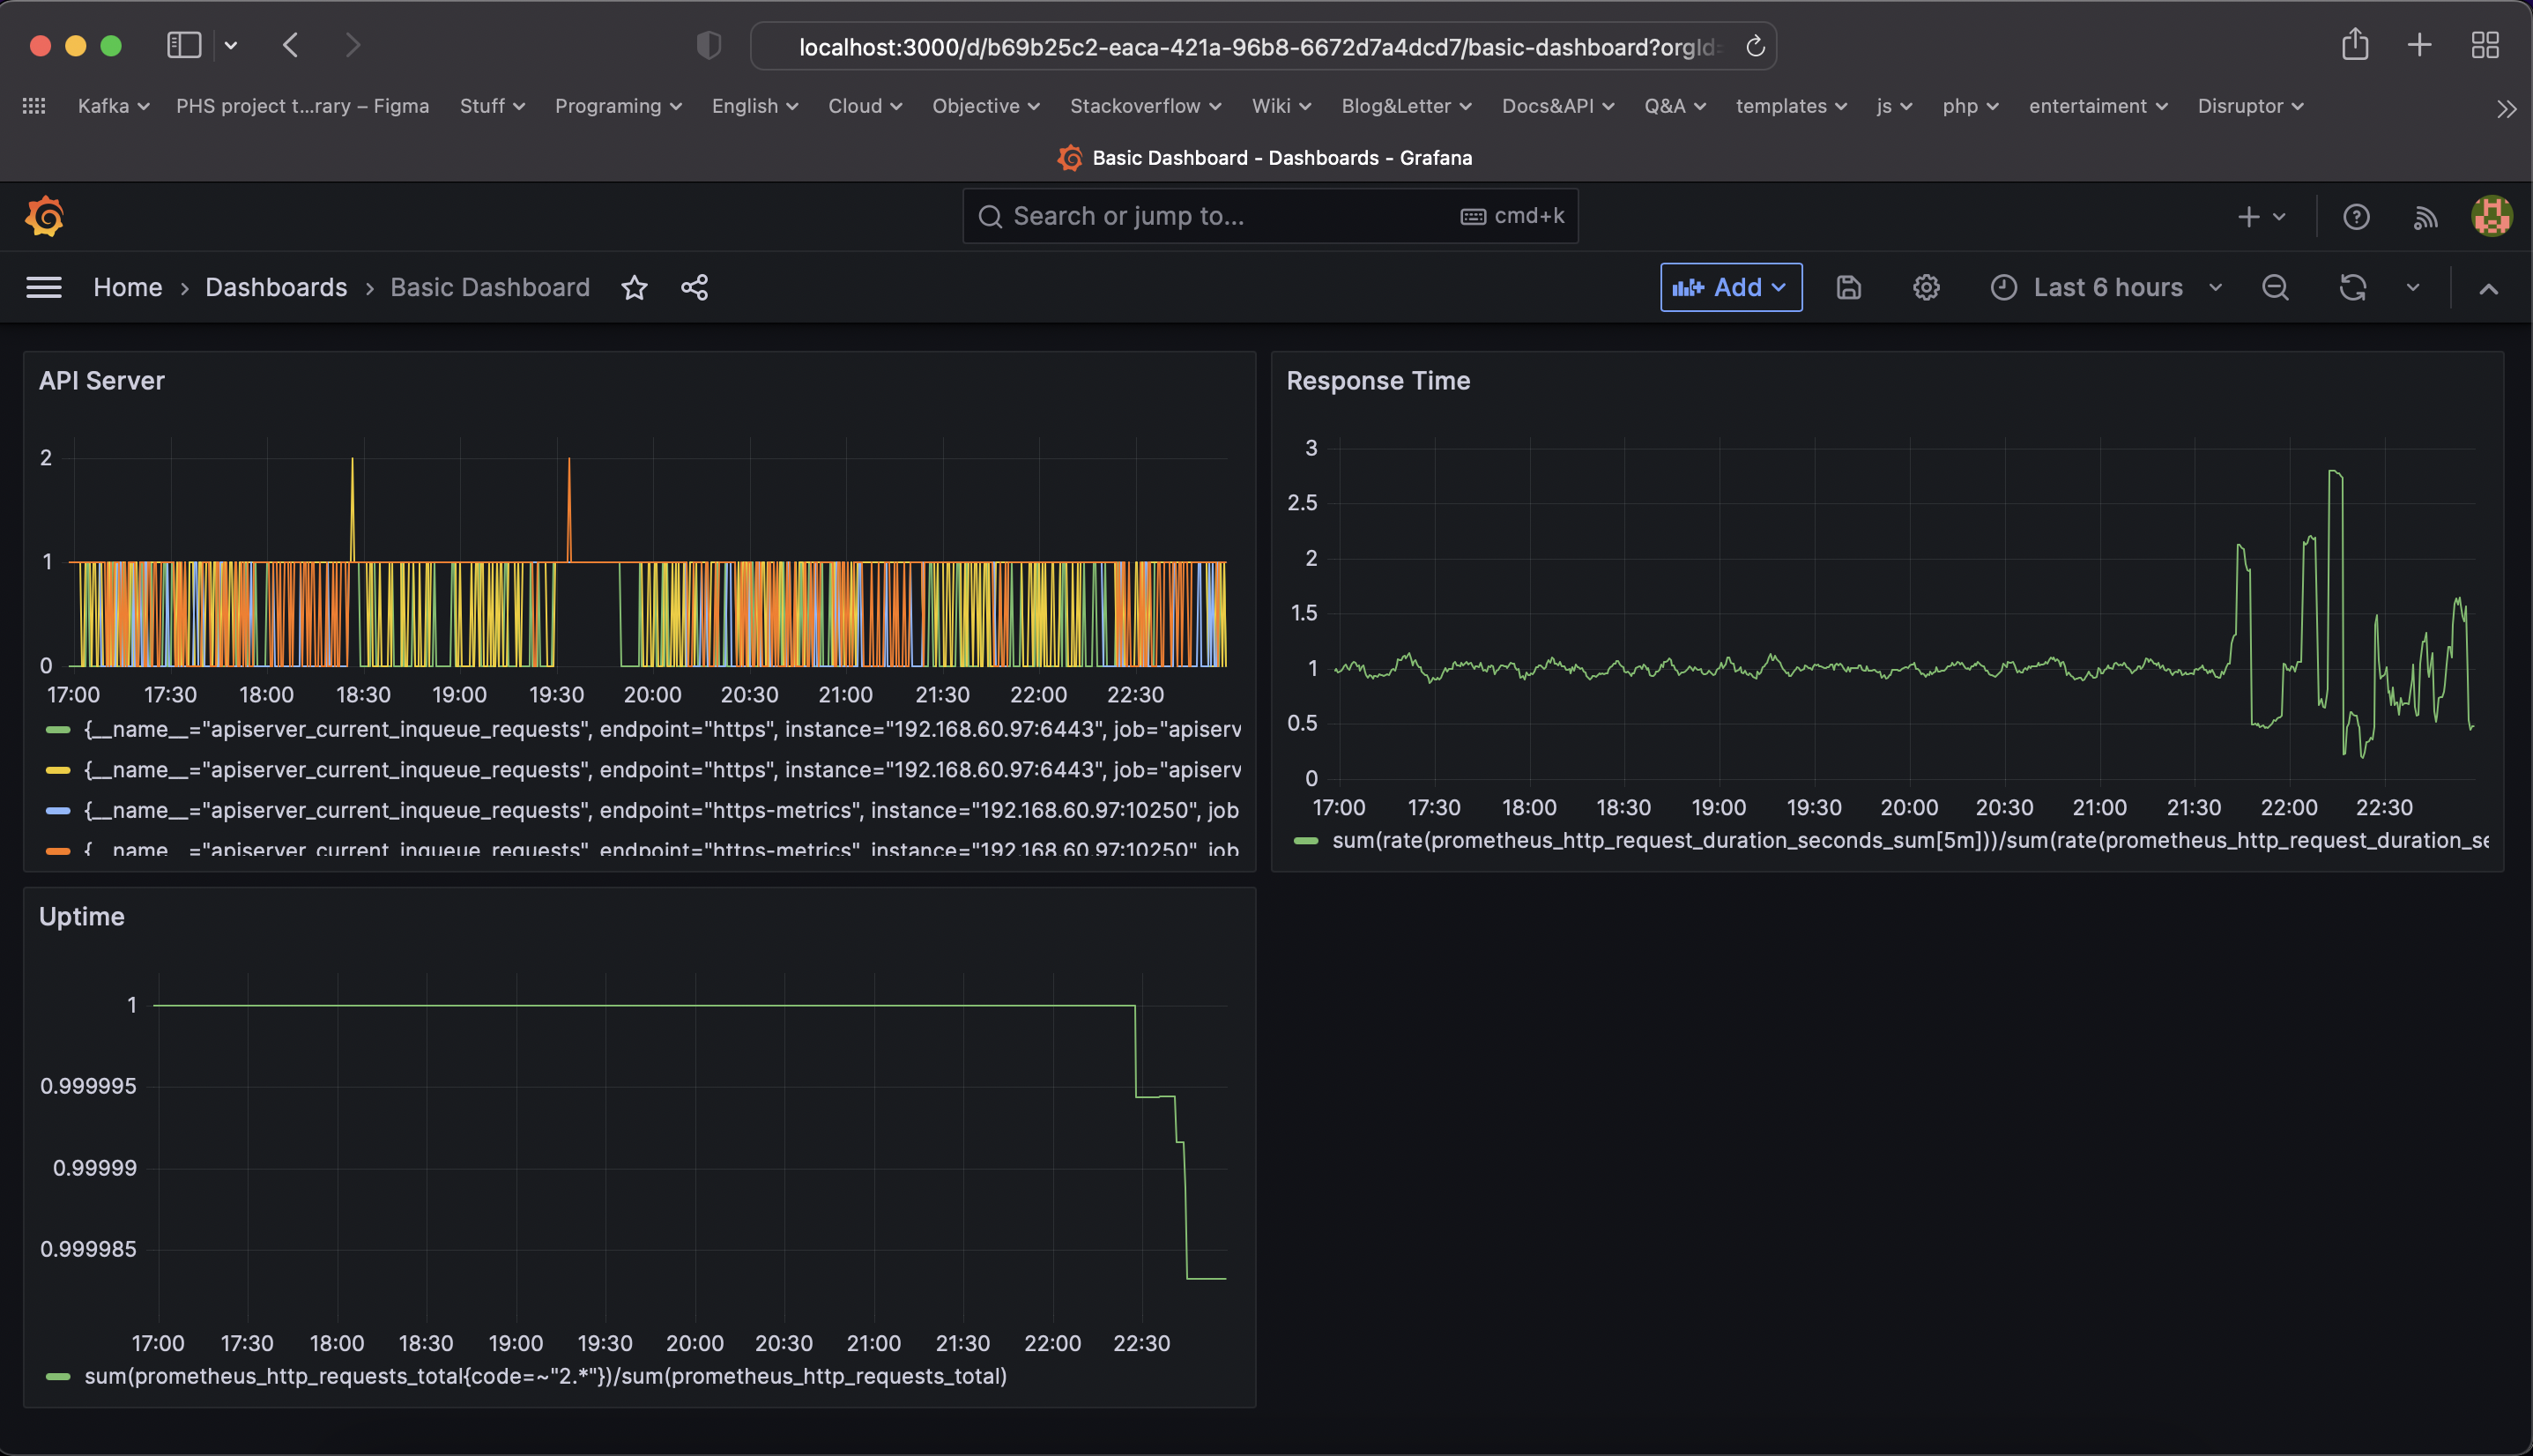
TODO: Create a dashboard in Grafana that shows Prometheus as a source. Take a screenshot and include it here.
TODO: Describe, in your own words, what the SLIs are, based on an SLO of monthly uptime and request response time.
- To indicate SLO monthly uptime, we need SLI is the rate of the 20x or 30x (valid requests) responses of the website in a total incoming requests per month
- To indicate SLO request response time 700ms, we need SLI for a request response time is how long the request took to be served in actuality.
TODO: It is important to know why we want to measure certain metrics for our customer. Describe in detail 5 metrics to measure these SLIs.
- The average 20x or 30x responses of the web application
- It took an average of 700ms for incoming requests to be served
- 1.5% of the total incoming requests had 50x responses
- The average CPU usage of the web application
- The login requests in the web application for a month took an average of 2 seconds to be served
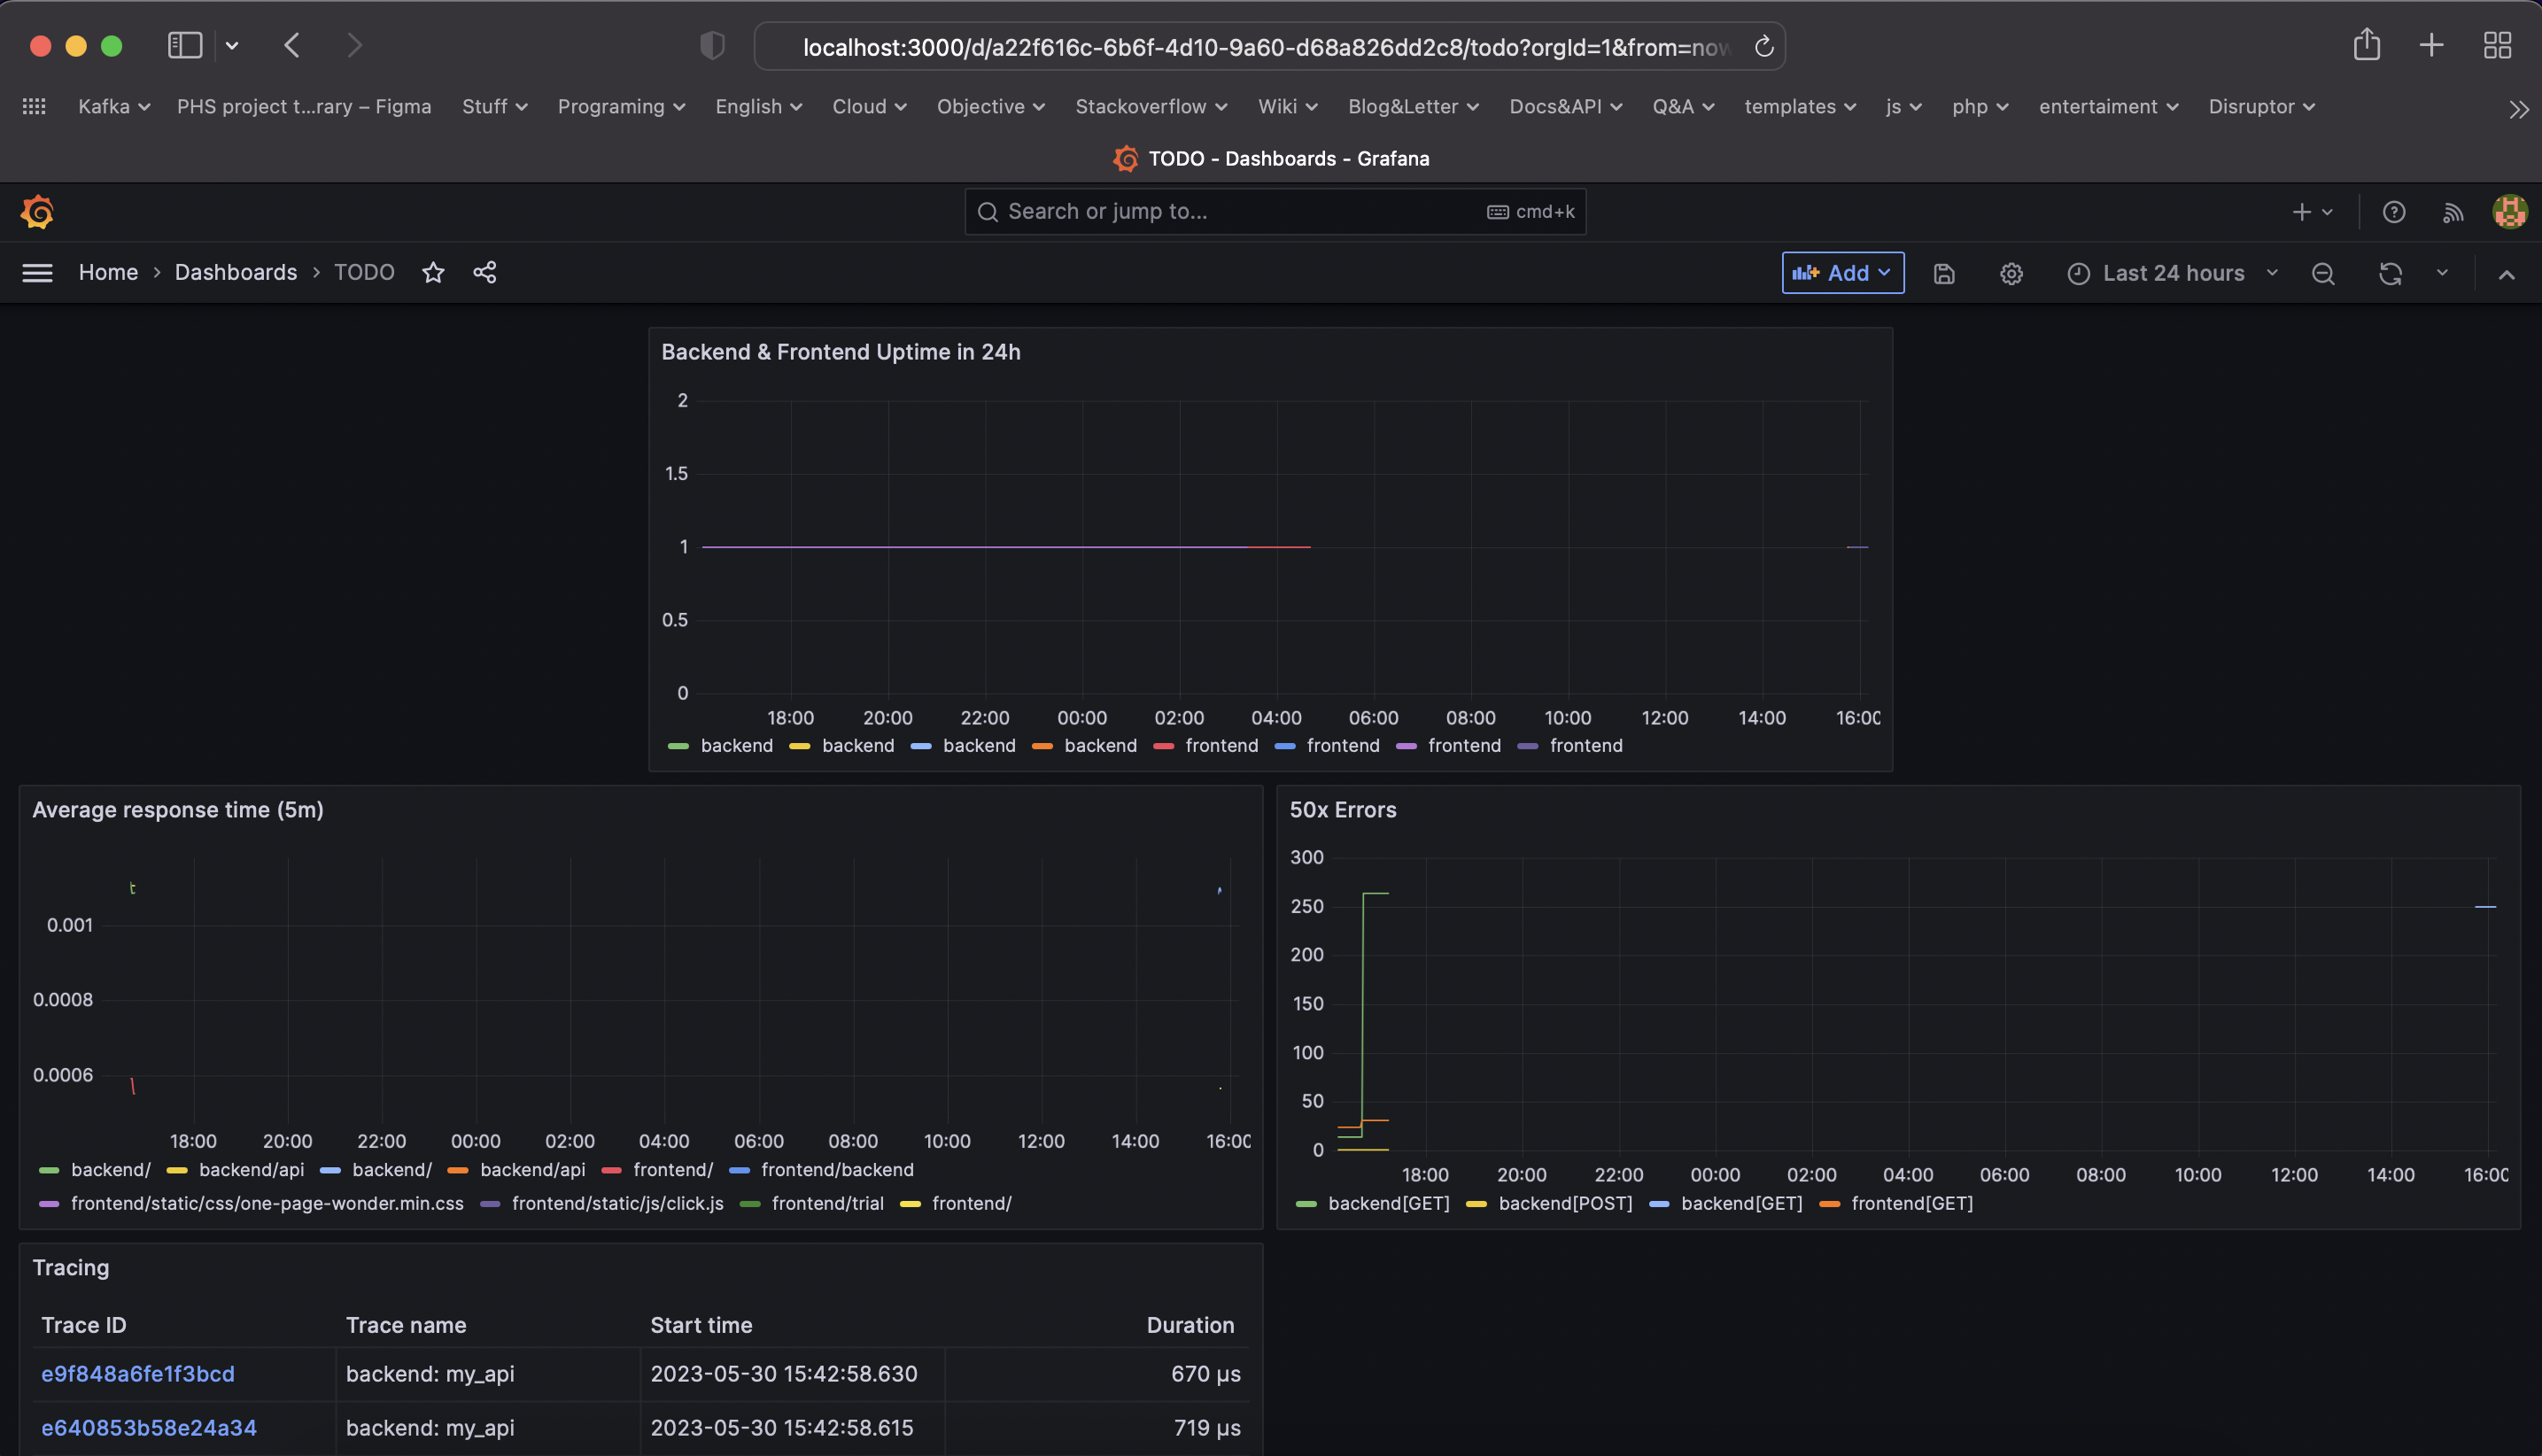
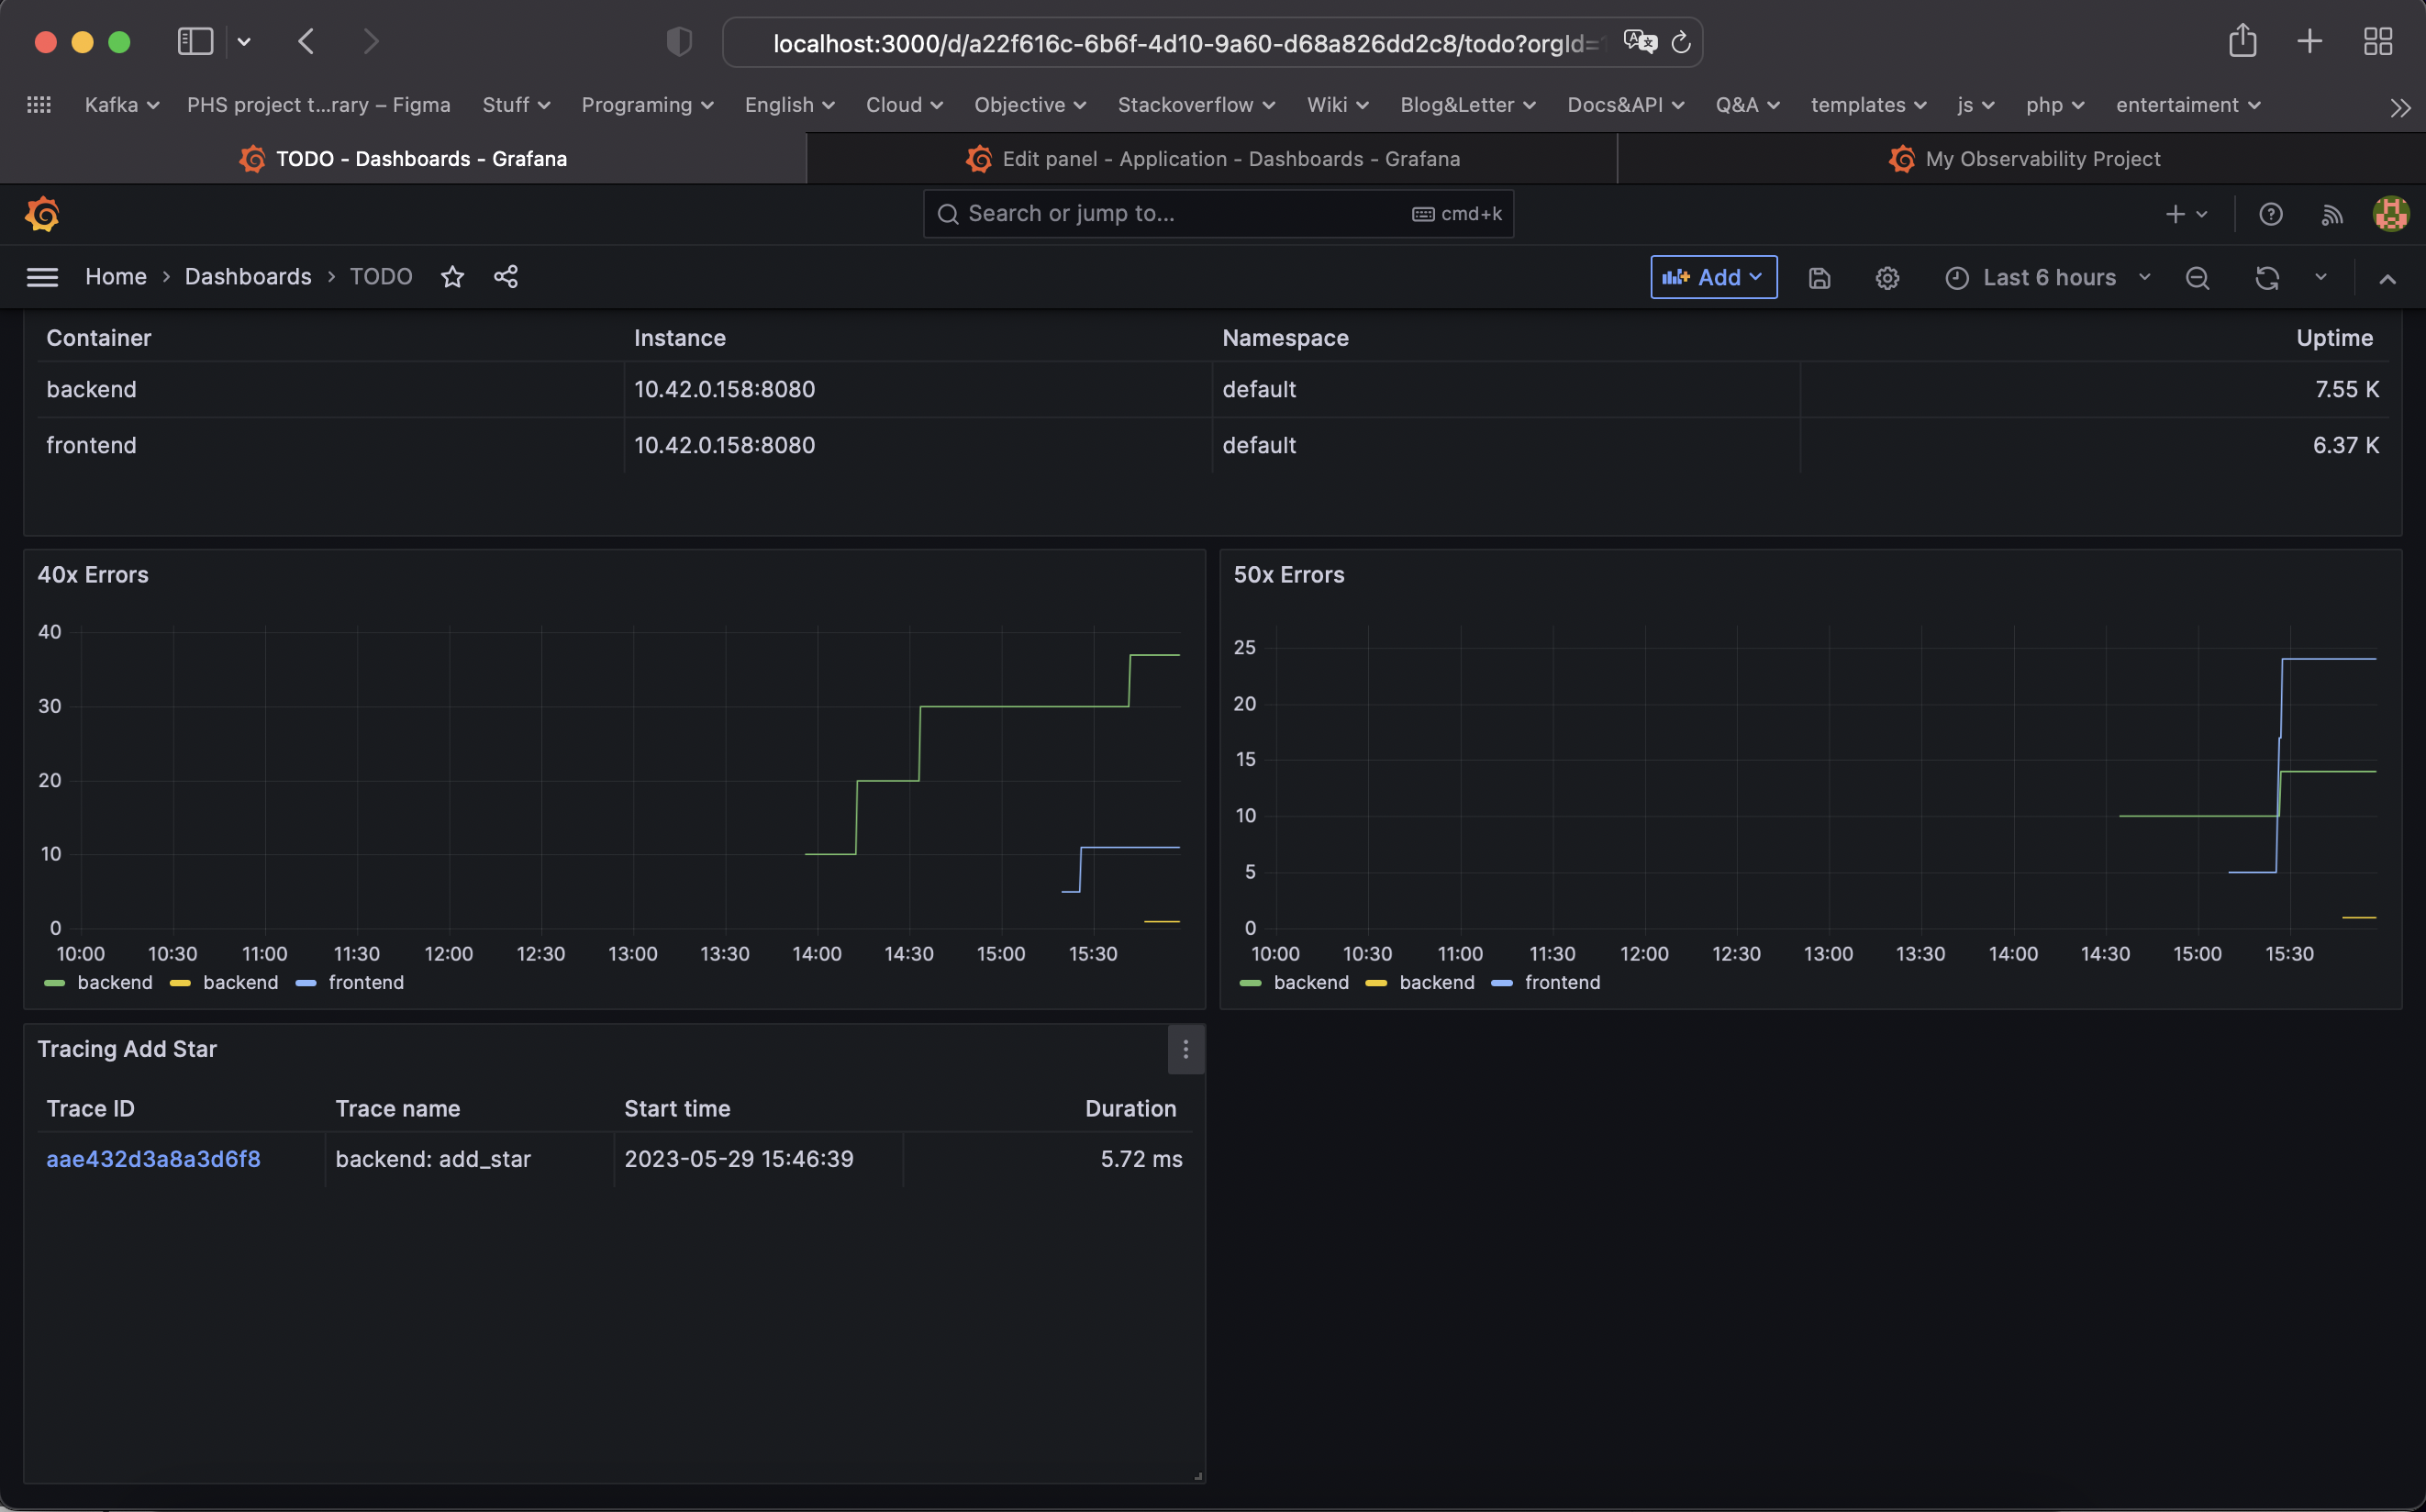
TODO: Create a dashboard to measure the uptime of the frontend and backend services We will also want to measure to measure 40x and 50x errors. Create a dashboard that show these values over a 24 hour period and take a screenshot.
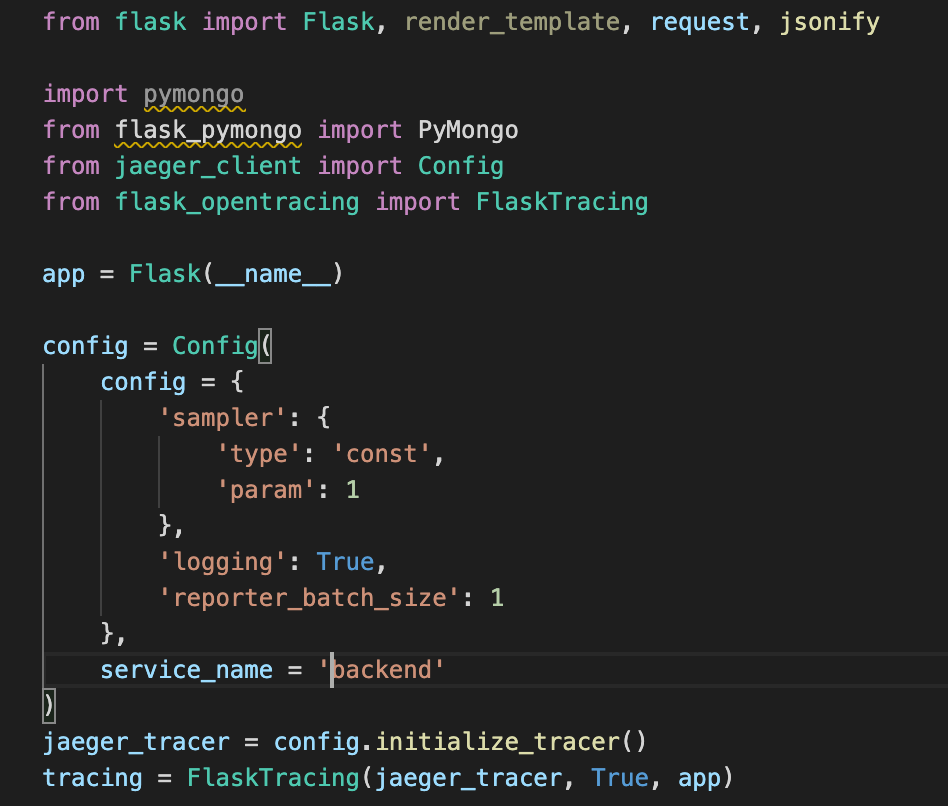
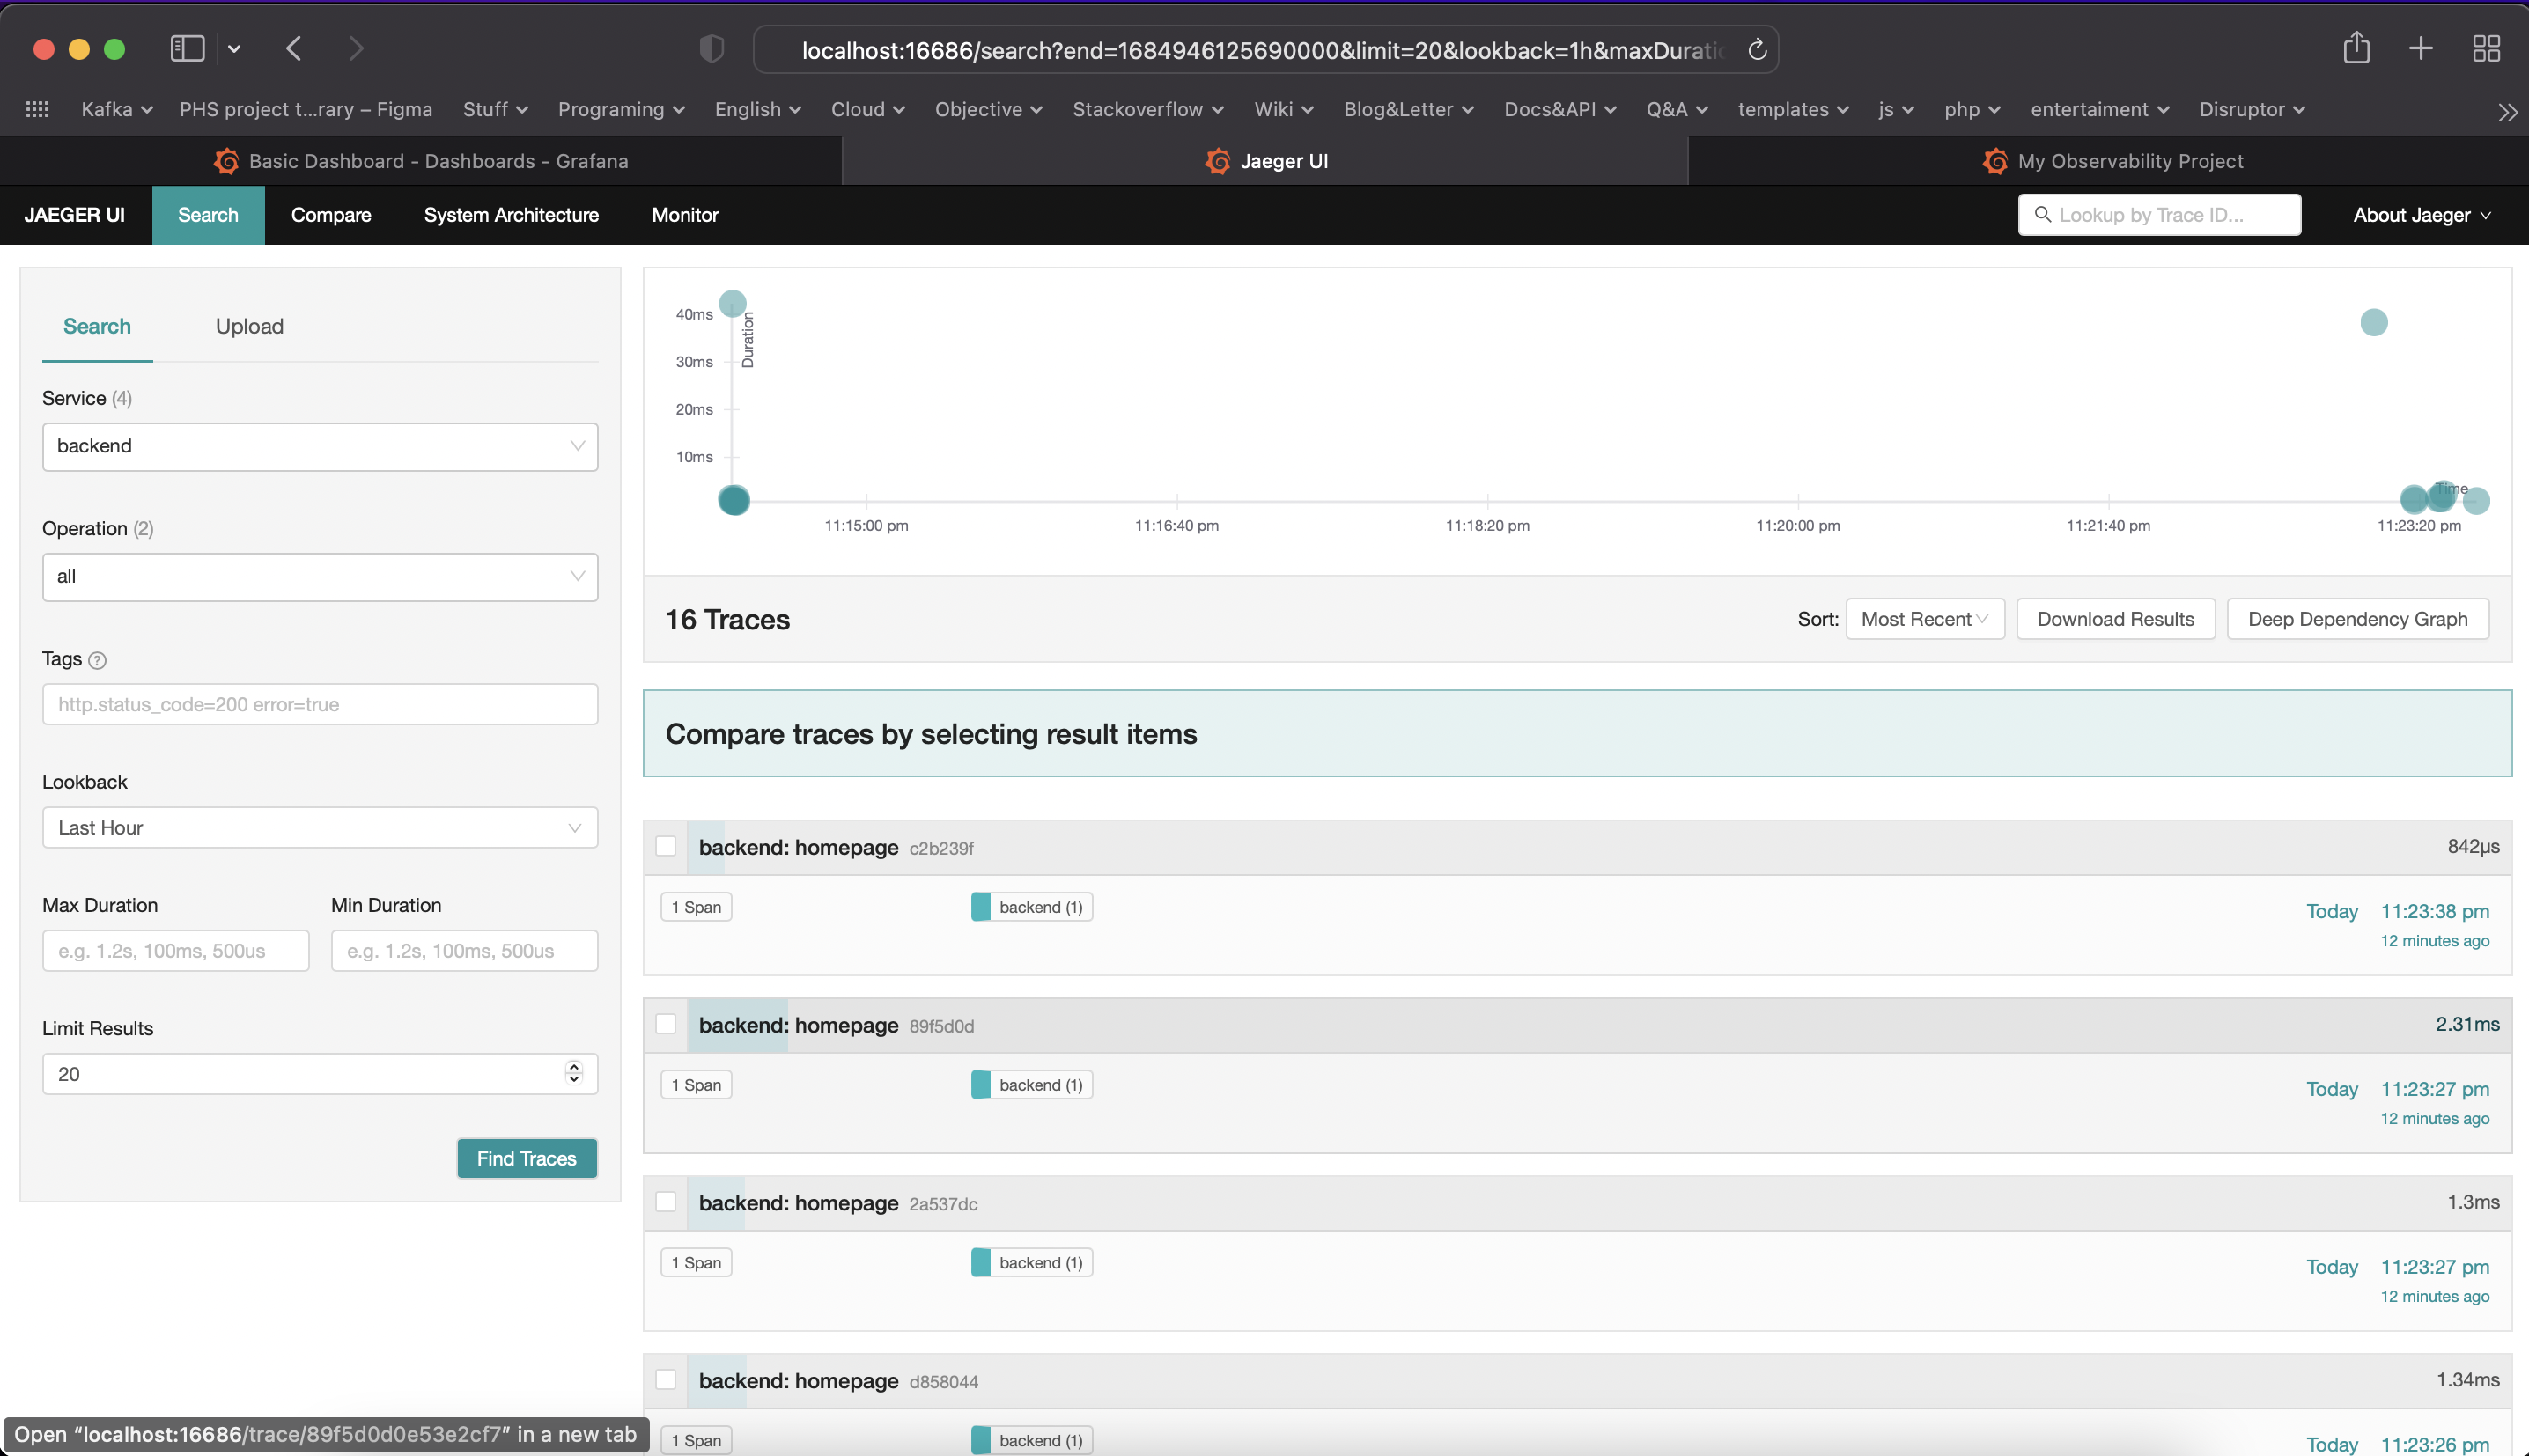
TODO: We will create a Jaeger span to measure the processes on the backend. Once you fill in the span, provide a screenshot of it here. Also provide a (screenshot) sample Python file containing a trace and span code used to perform Jaeger traces on the backend service.
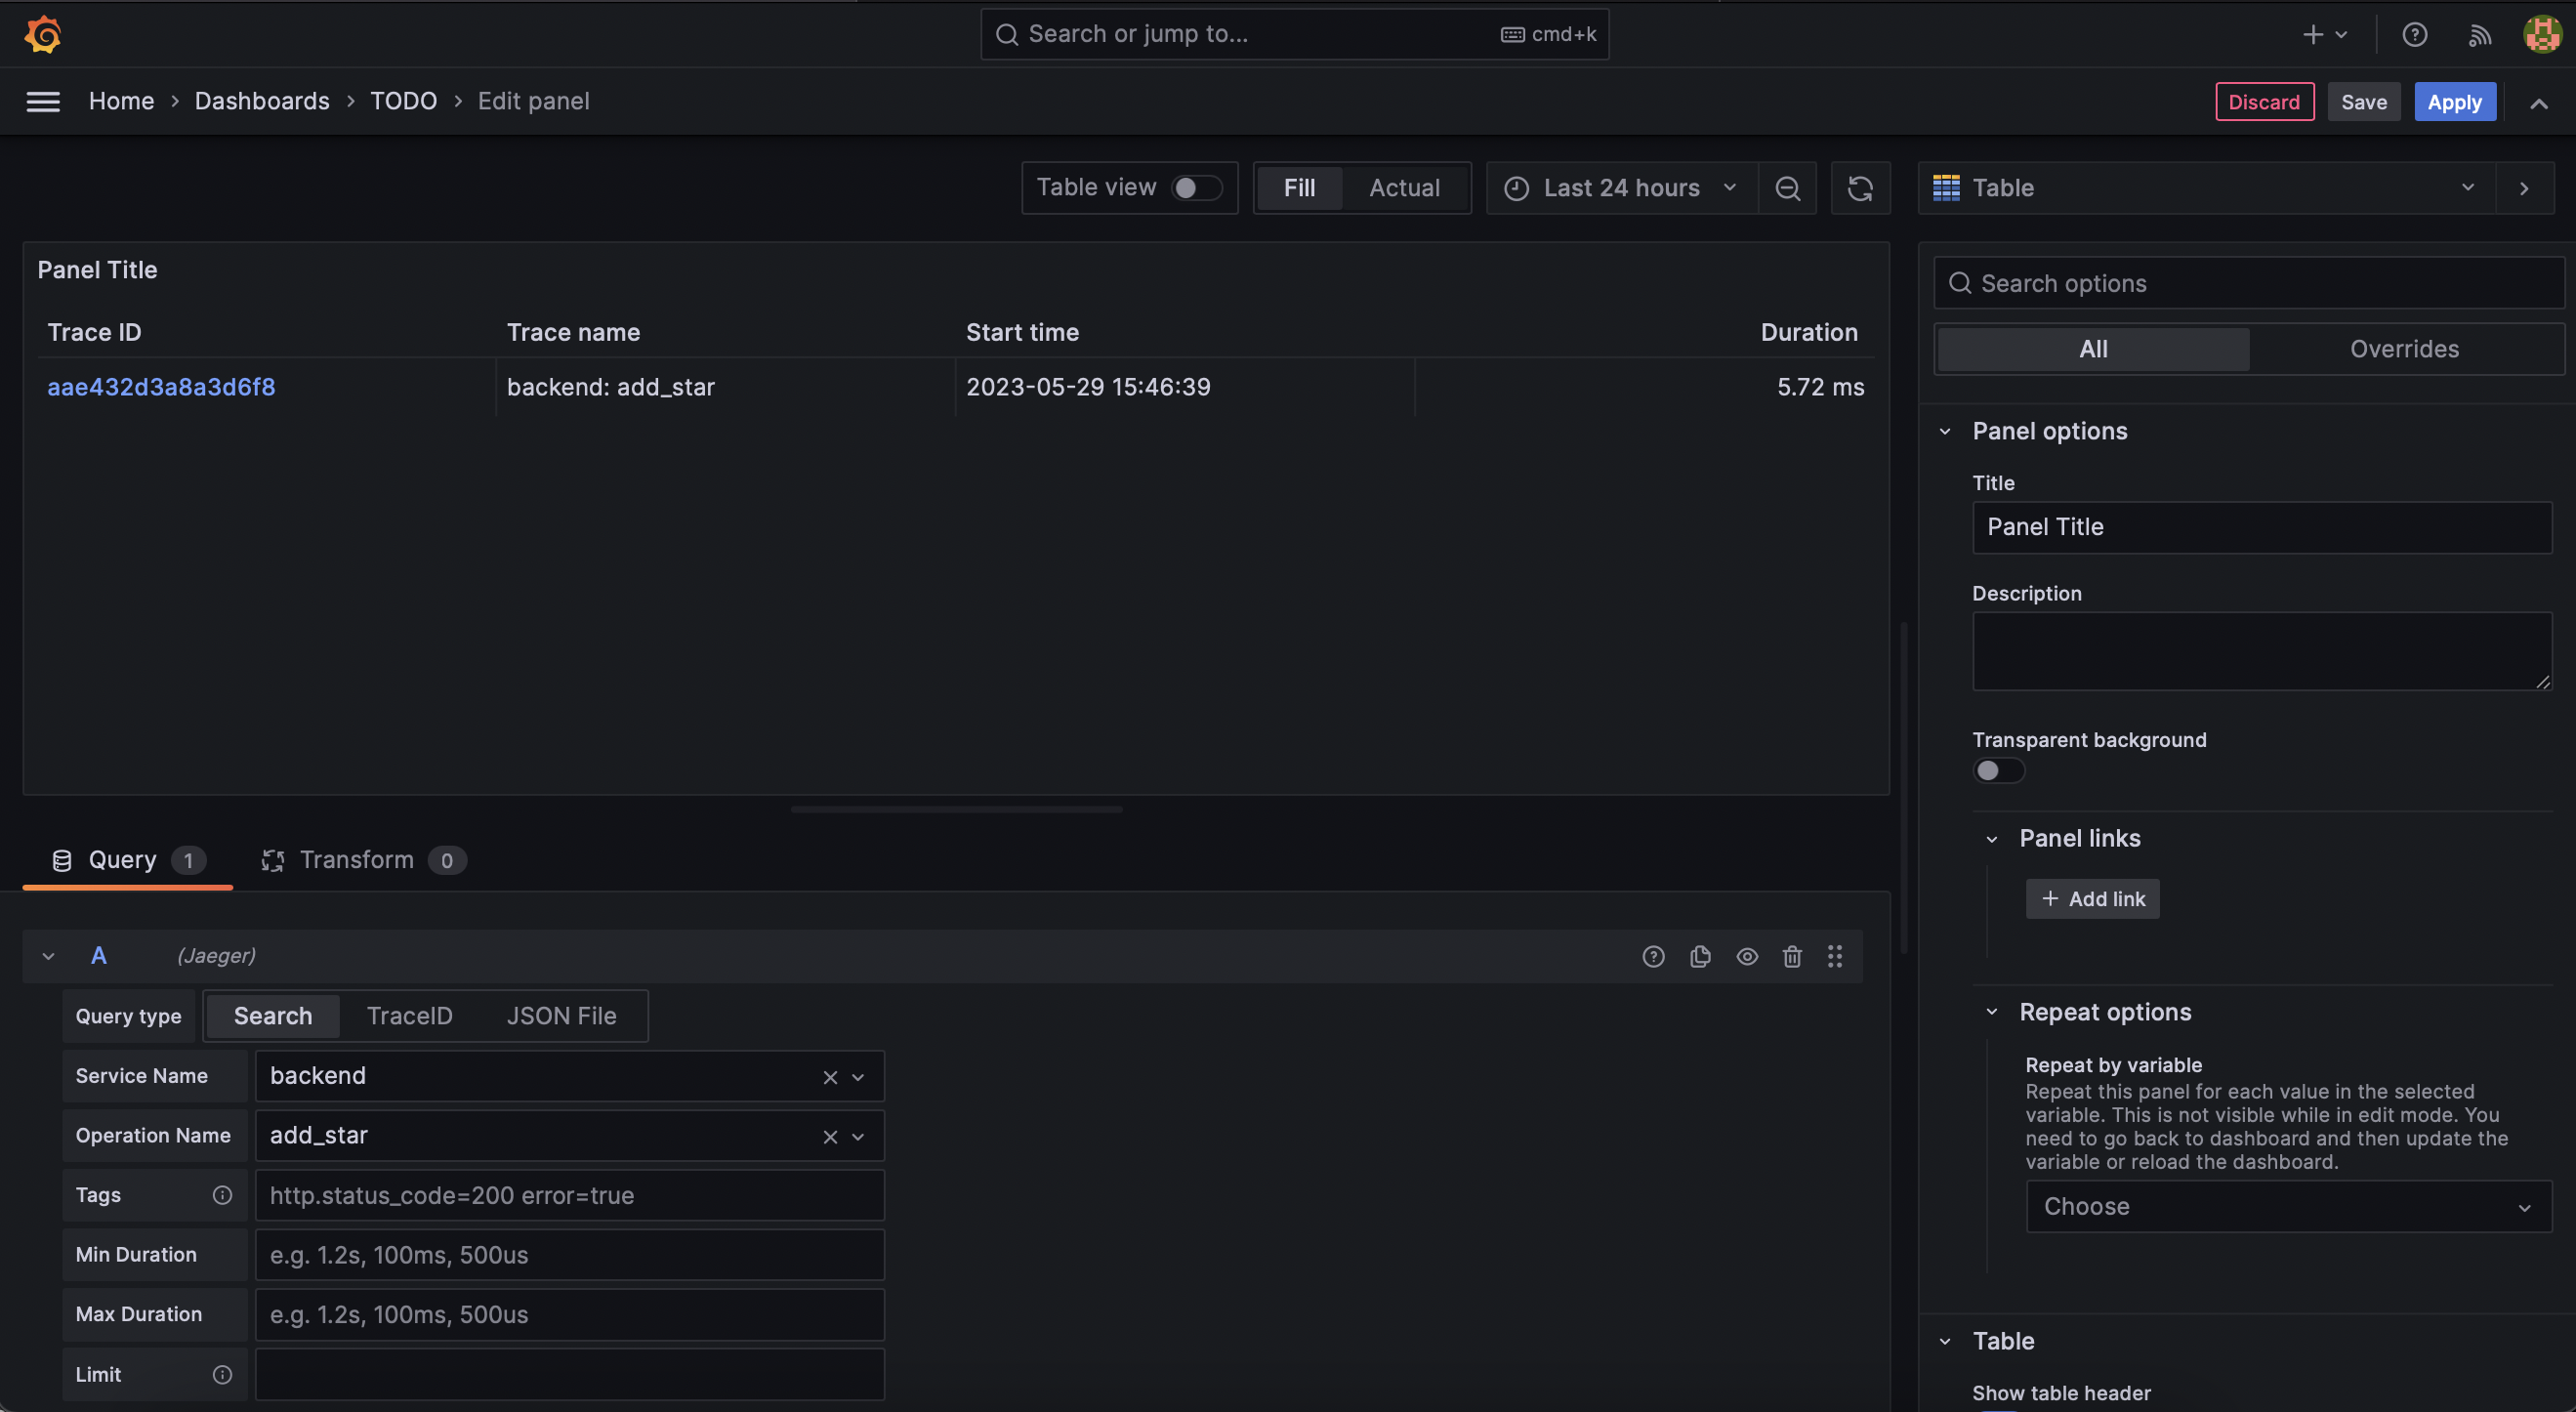
TODO: Now that the trace is running, let's add the metric to our current Grafana dashboard. Once this is completed, provide a screenshot of it here.
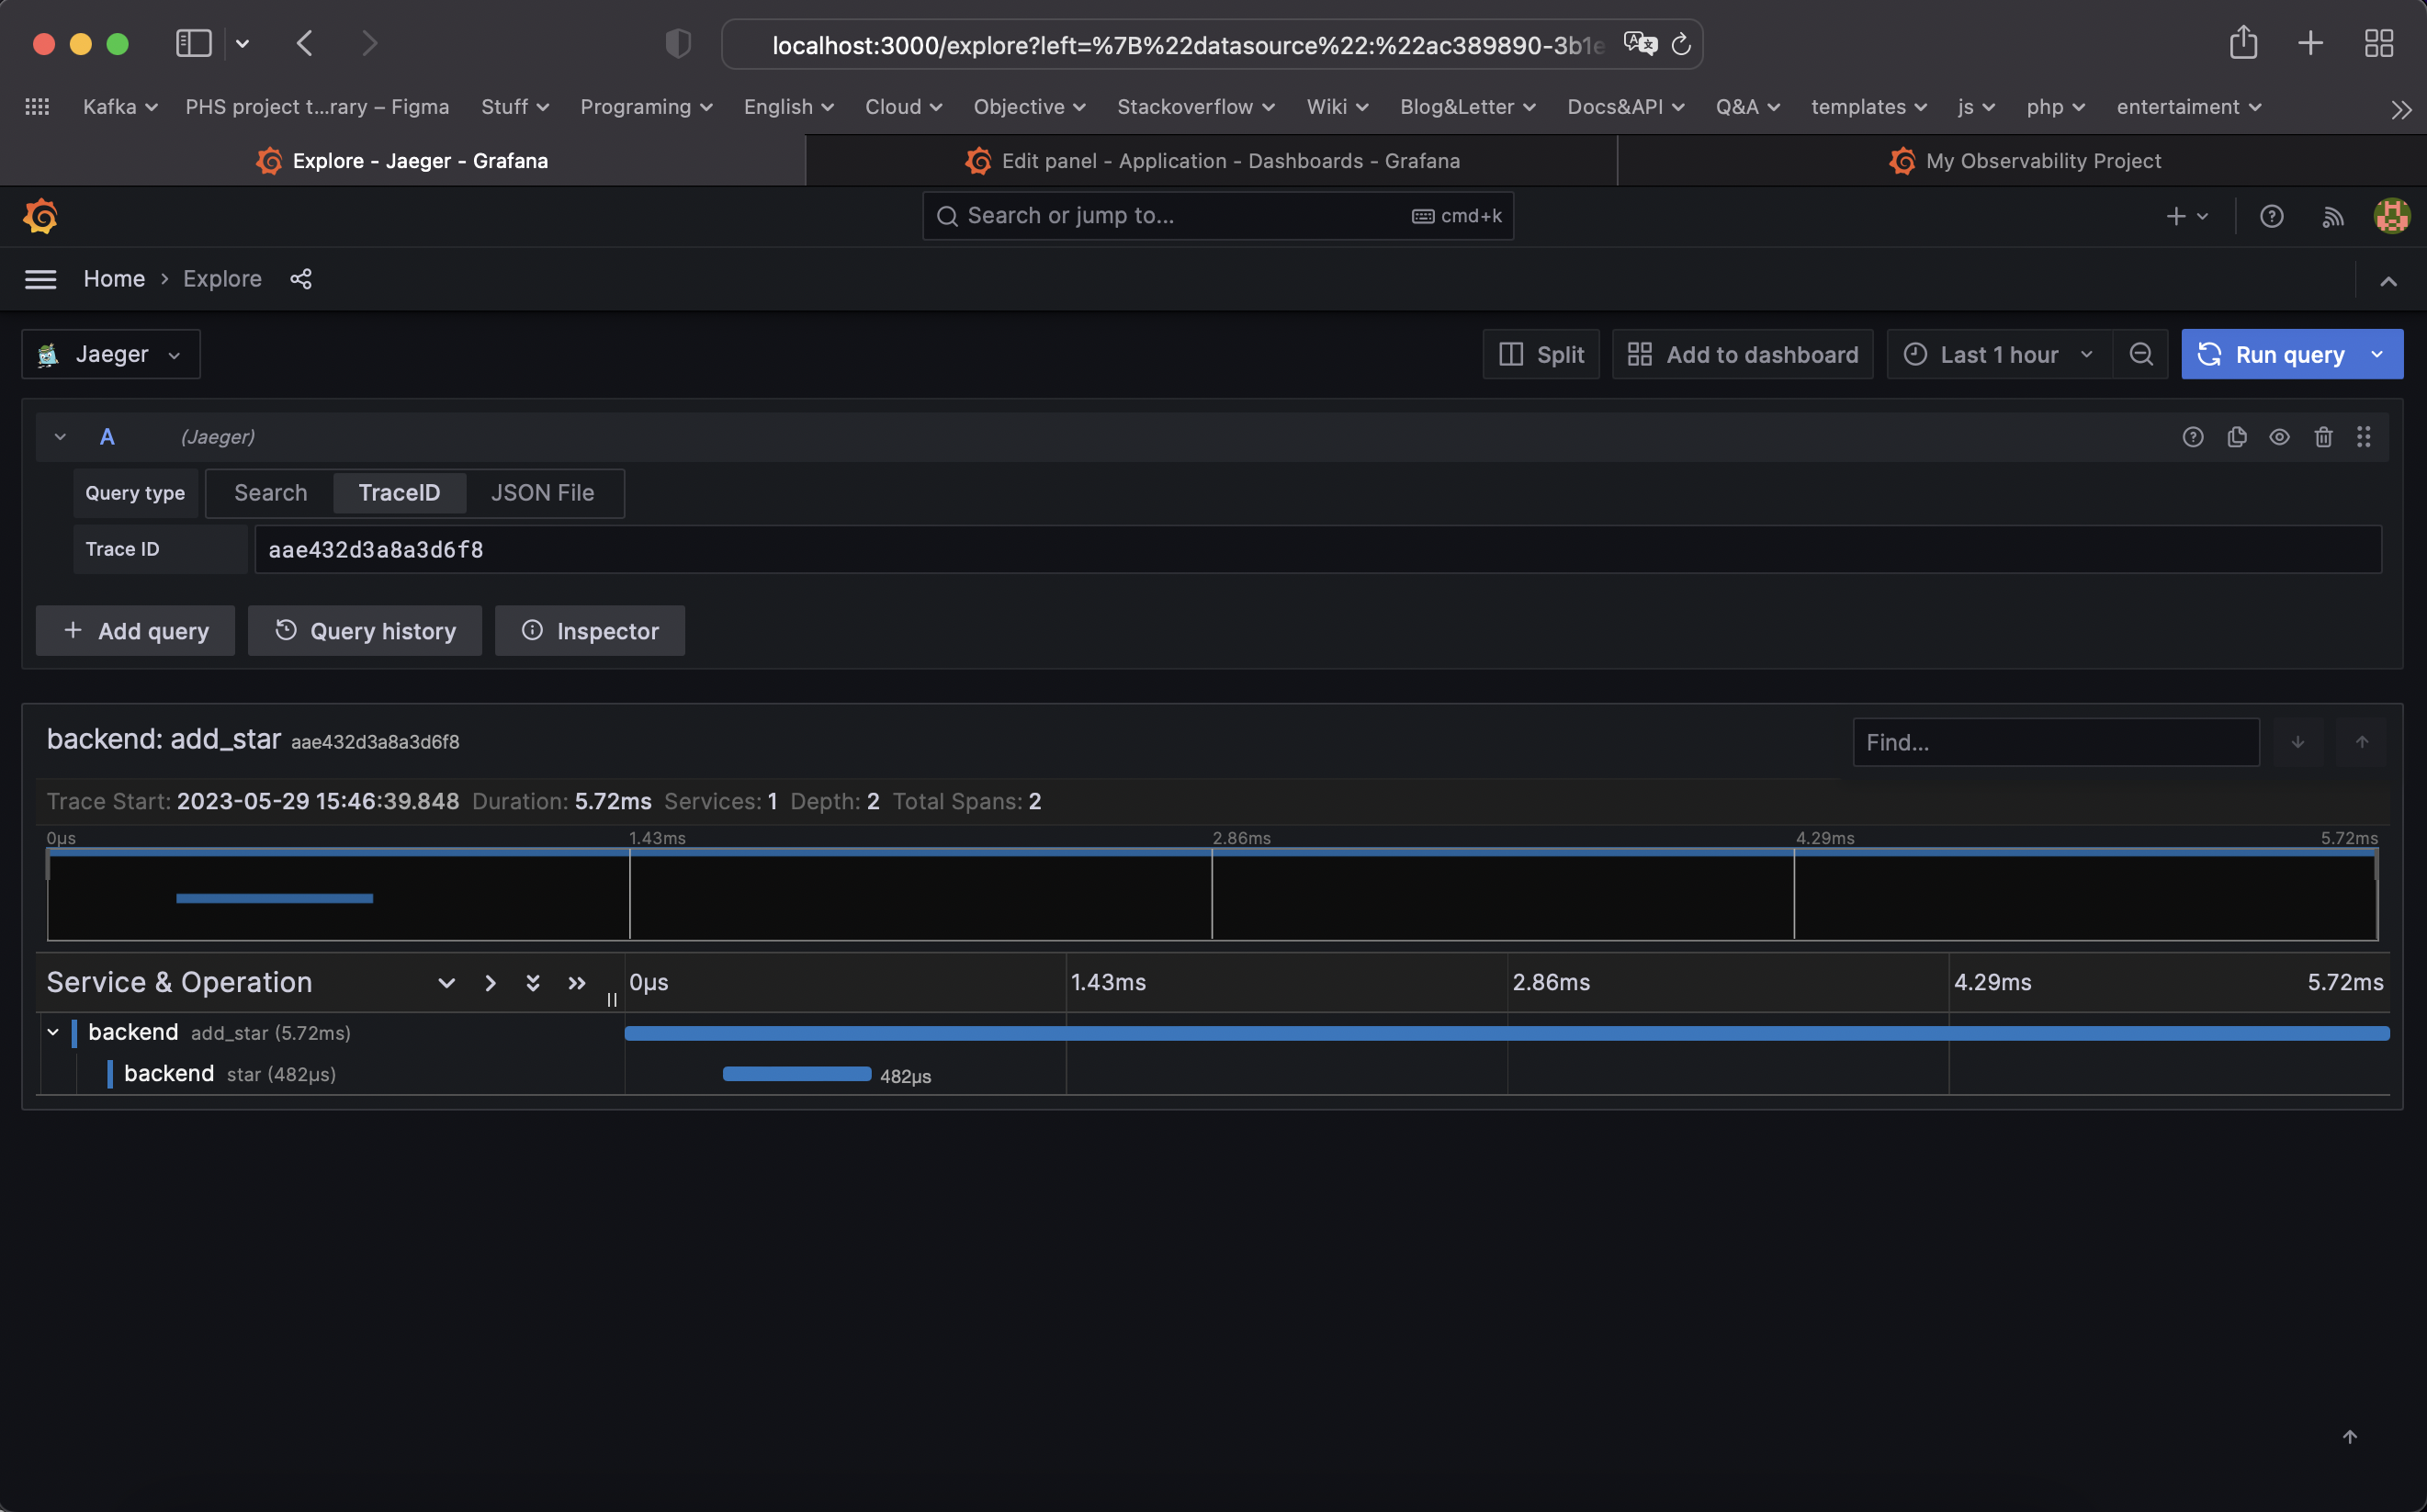
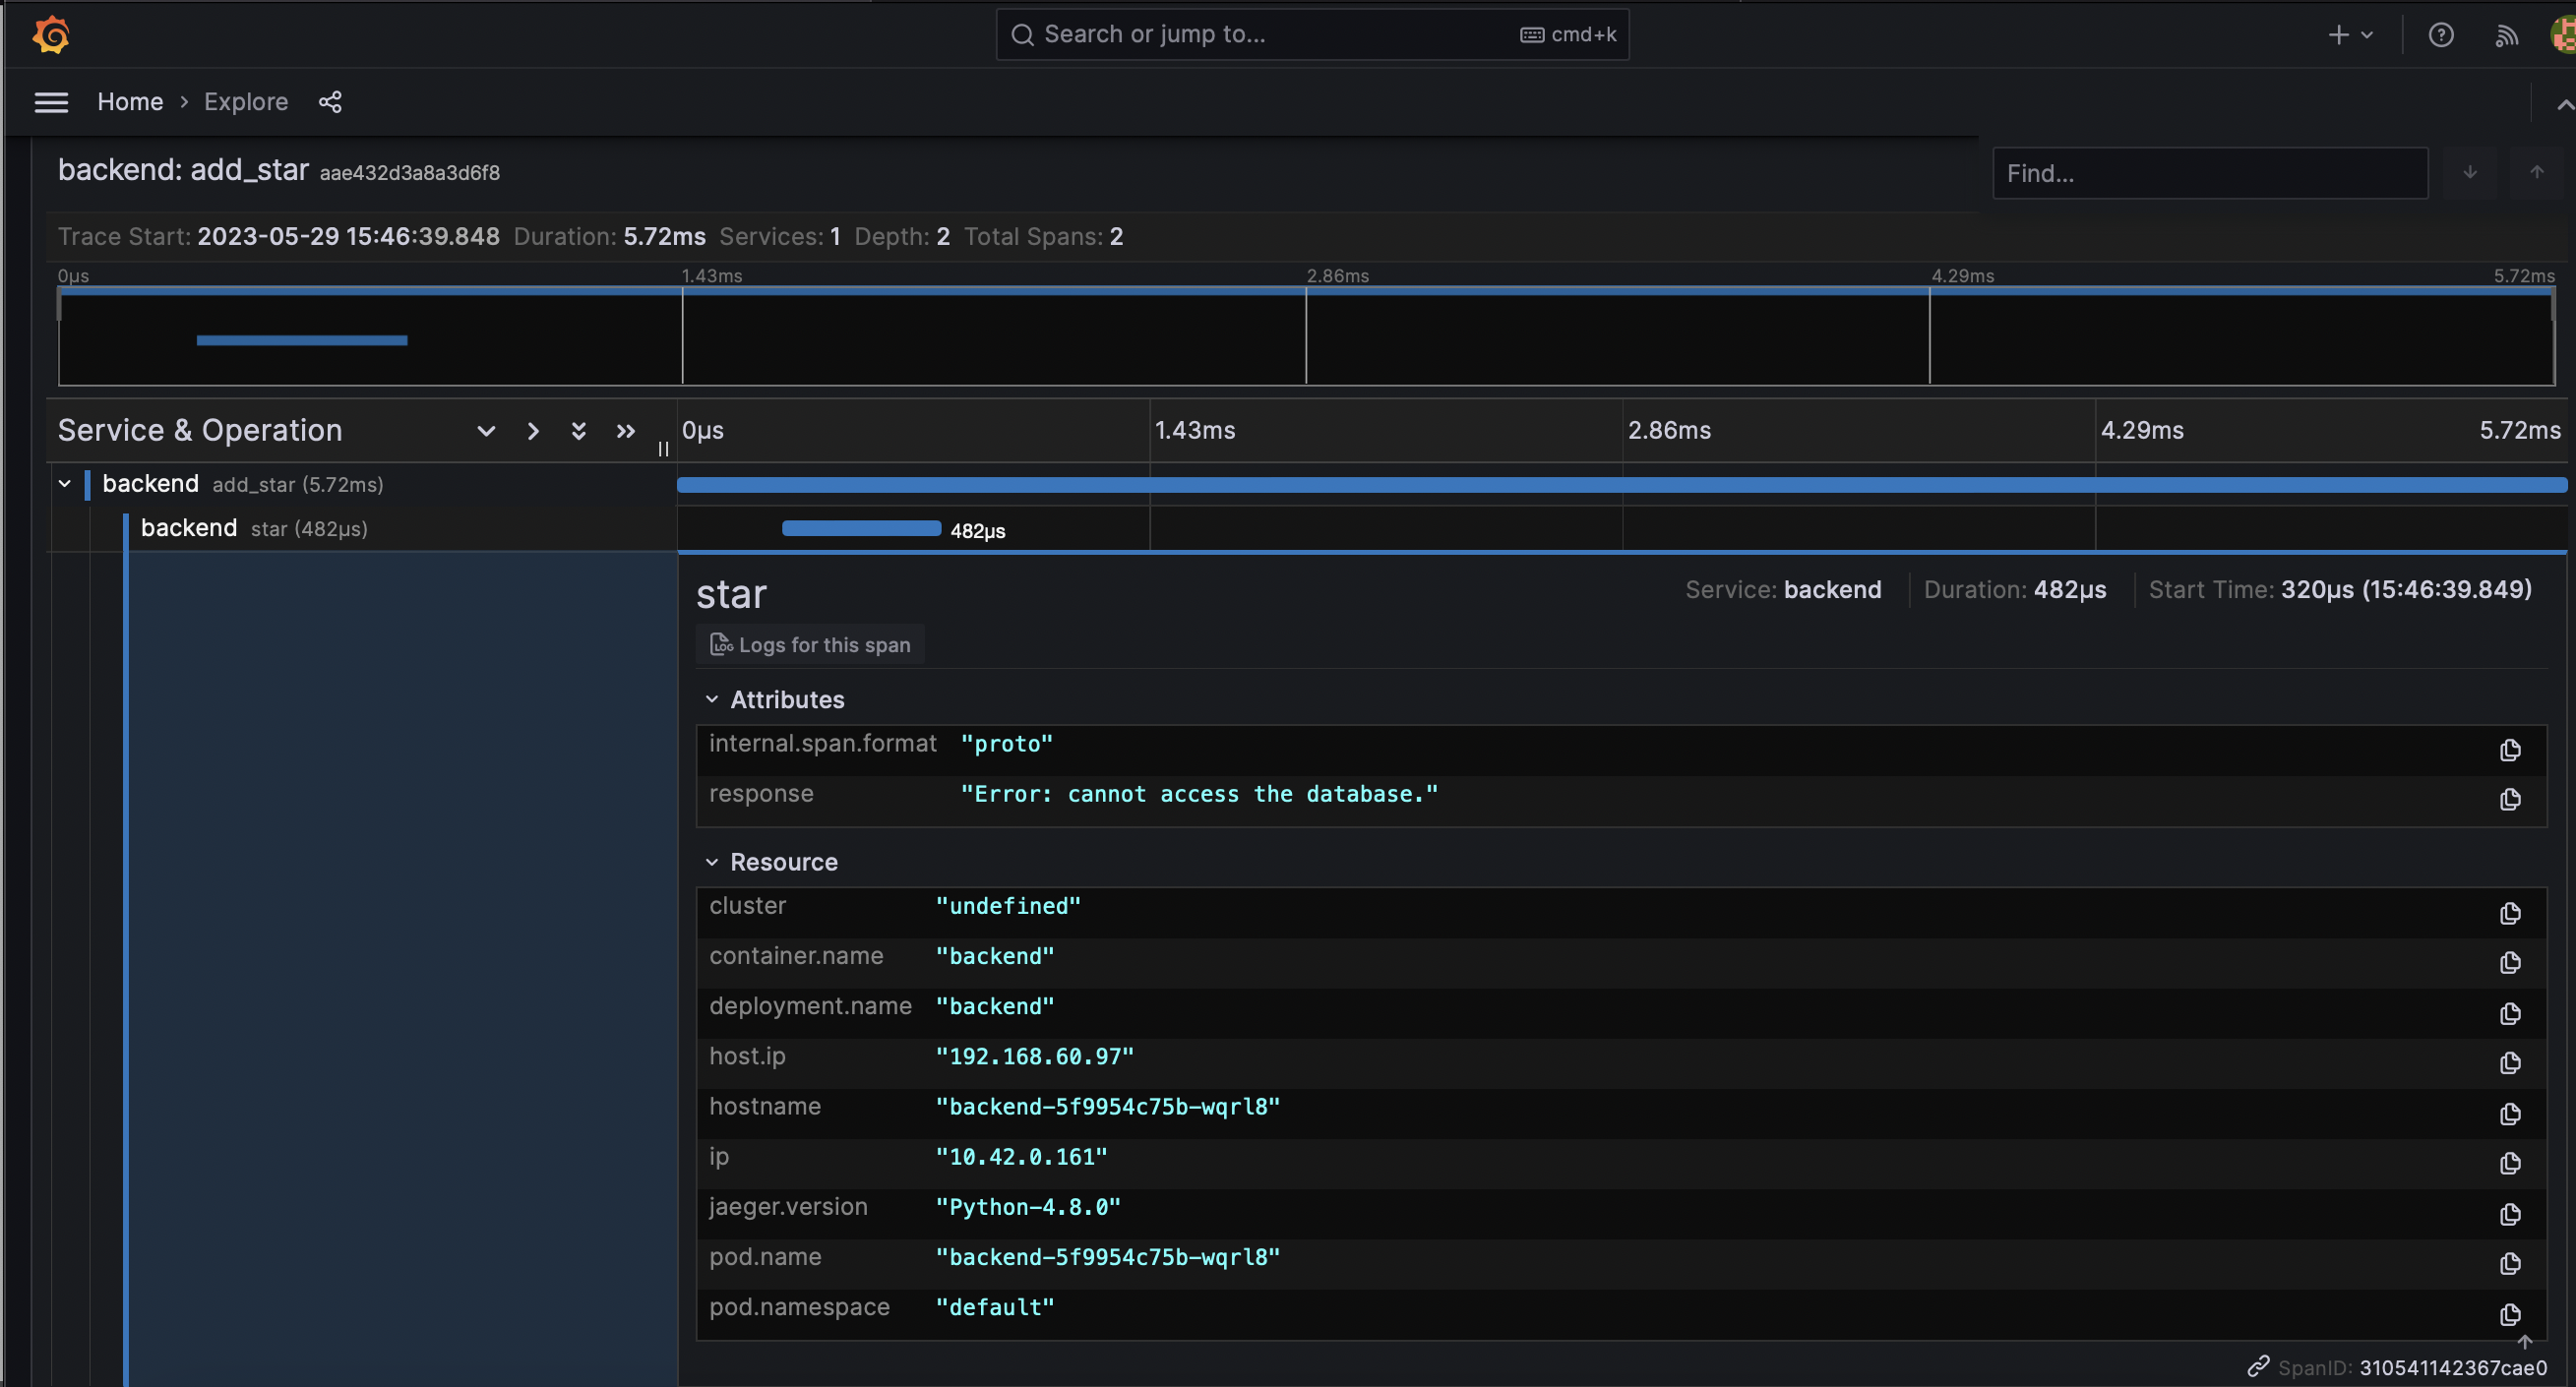
TODO: Using the template below, write a trouble ticket for the developers, to explain the errors that you are seeing (400, 500, latency) and to let them know the file that is causing the issue also include a screenshot of the tracer span to demonstrate how we can user a tracer to locate errors easily.
TROUBLE TICKET
Name: Ethan Nguyen
Date: 29 May 2023
Subject: Backend Service create star shows "Internal Server Error" error 500.
Affected Area: star enpoint
Severity: High
Description: Cannot access database. The tracer span is aae432d3a8a3d6f8
TODO: We want to create an SLO guaranteeing that our application has a 99.95% uptime per month. Name four SLIs that you would use to measure the success of this SLO.
- 99.95% of uptime per month
- 99.9% of responses to our front-service will return 2xx, 3xx or 4xx HTTP code within 2000 ms.
- 99.99% of transaction requests will succeed over any calendar month.
- 99.9% of backend service requests will succeed on their first attempt.
- less than 10 error responses in the last 24 hours.
- average response time of < 2000ms per minute.
- 75% more successful responses than errors.
- 99% of our responses had the right data format.
TODO: Now that we have our SLIs and SLOs, create a list of 2-3 KPIs to accurately measure these metrics as well as a description of why those KPIs were chosen. We will make a dashboard for this, but first write them down here.
- We got less than 10 error responses in the last 24 hours.
- Successful requests per minute: this KPI indicates how well is performed our system.
- Error requests per minute: this KPI is an analogous of this SLI.
- Uptime - this KPI indicates if errors are comming from downtime or not.
- We got an average response time of < 2000ms in the las 24 hours.
- Average response time: this KPI is an analogous of this SLI.
- Uptime - this KPI will help us to determine if response time is affected by downtime of a service.
- We got 75% more successful responses than errors.
- Successful requests per minute: this KPI indicates the number of successful request.
- Error requests per minute: this KPI indicates the number of error requests.
TODO: Create a Dashboard containing graphs that capture all the metrics of your KPIs and adequately representing your SLIs and SLOs. Include a screenshot of the dashboard here, and write a text description of what graphs are represented in the dashboard.