Grafana doesn't supports Druid as a Data Source, this plugin aims to do so.
At the time of writing, the plugin supports all Grafana features and all Druid queries:
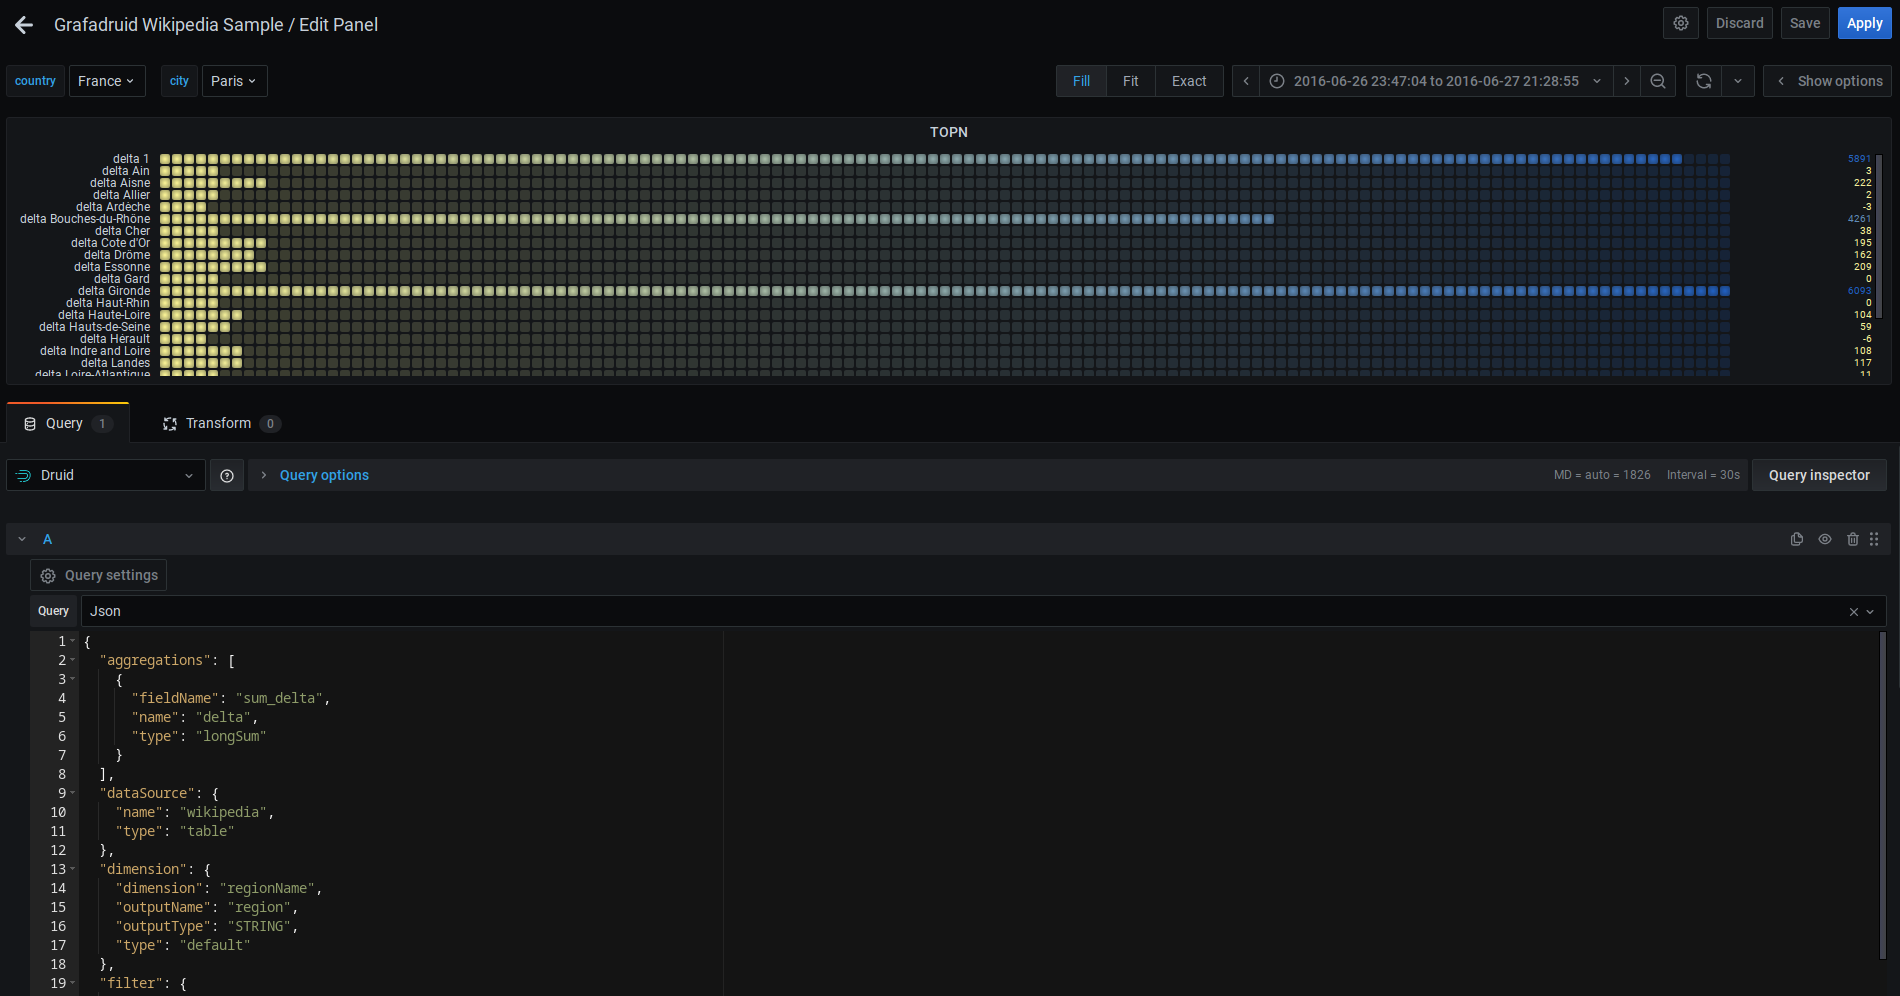
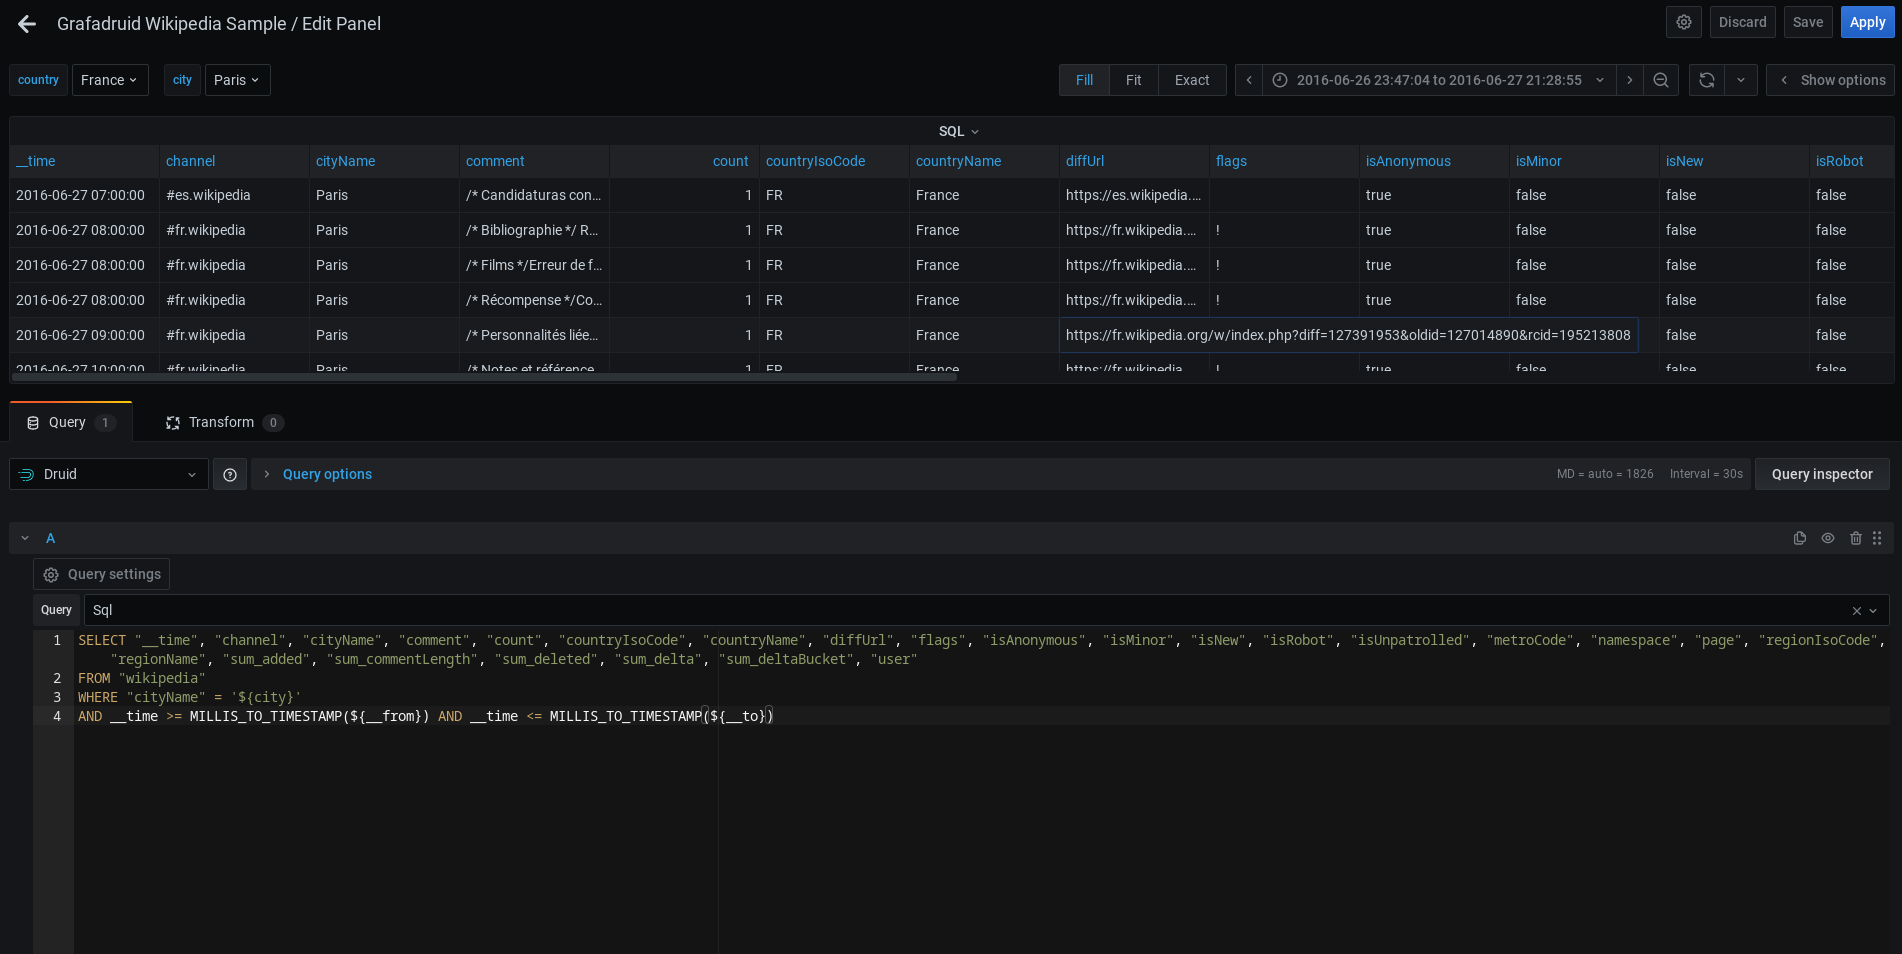
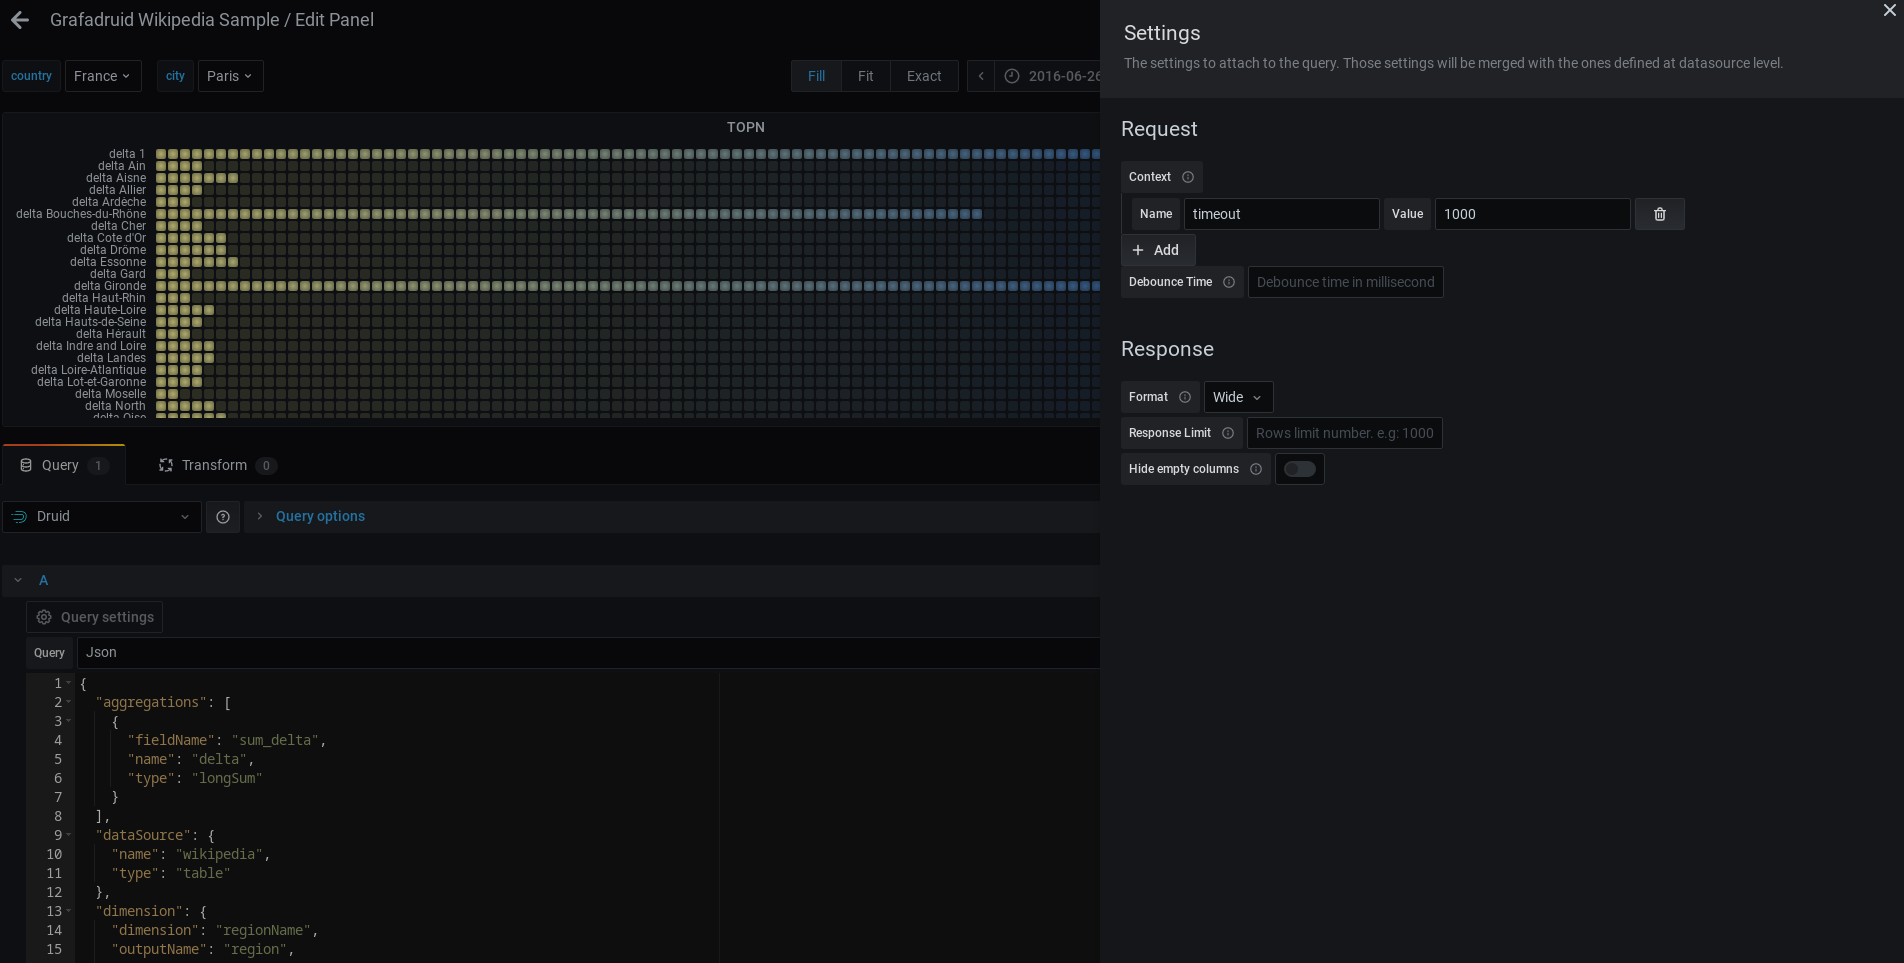
- Druid queries: SQL, timeseries, topn, groupby, timeboundary, segmentmetadata, datasourcemetadata, scan, search, JSON
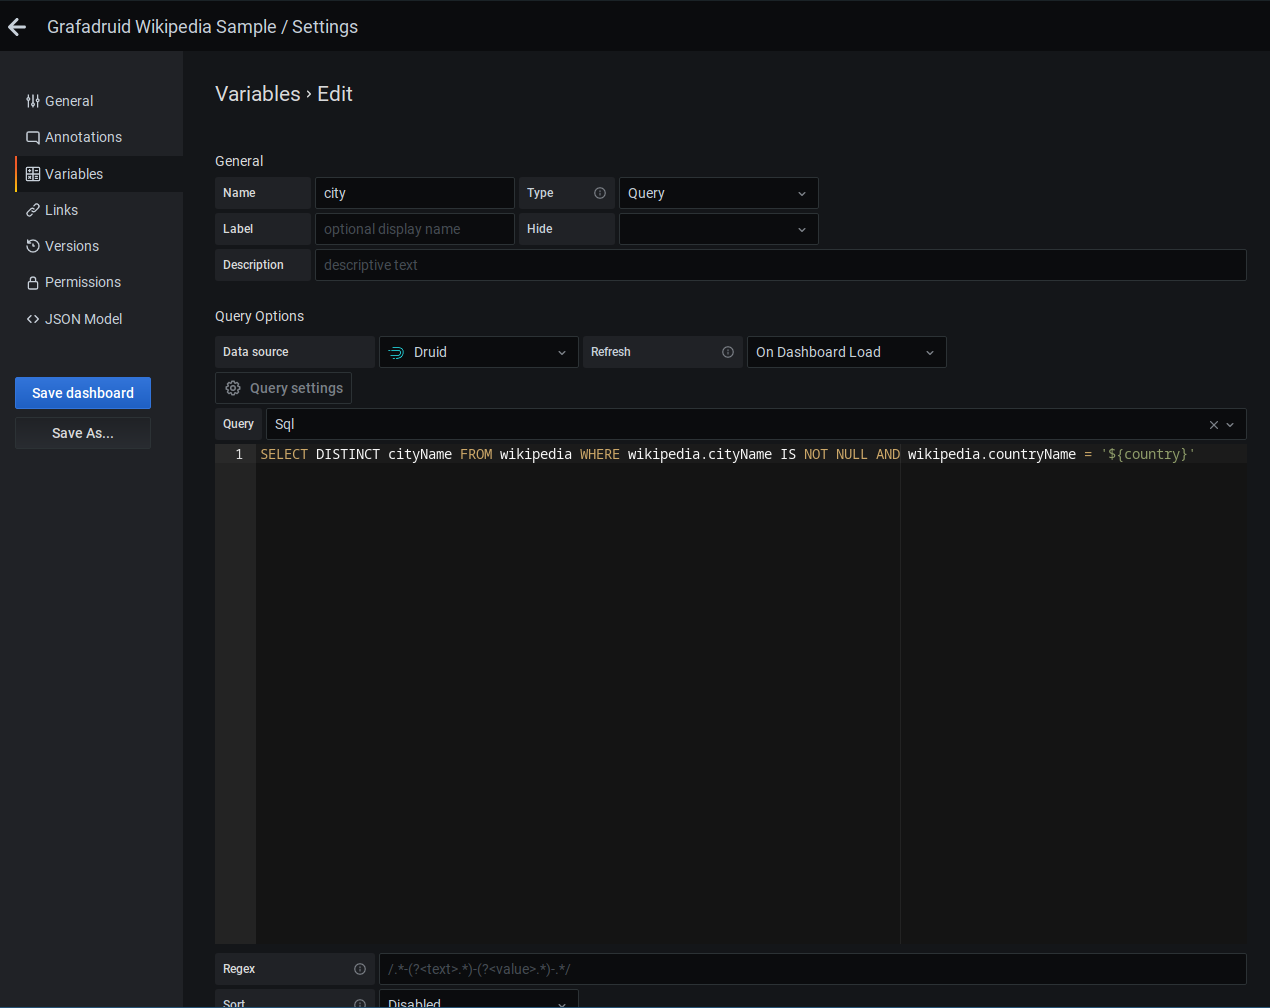
- Variables: Grafana global variables replacement, query variables, formatter
druid:json(provide support for multi-value variables within rune queries). - Alerts
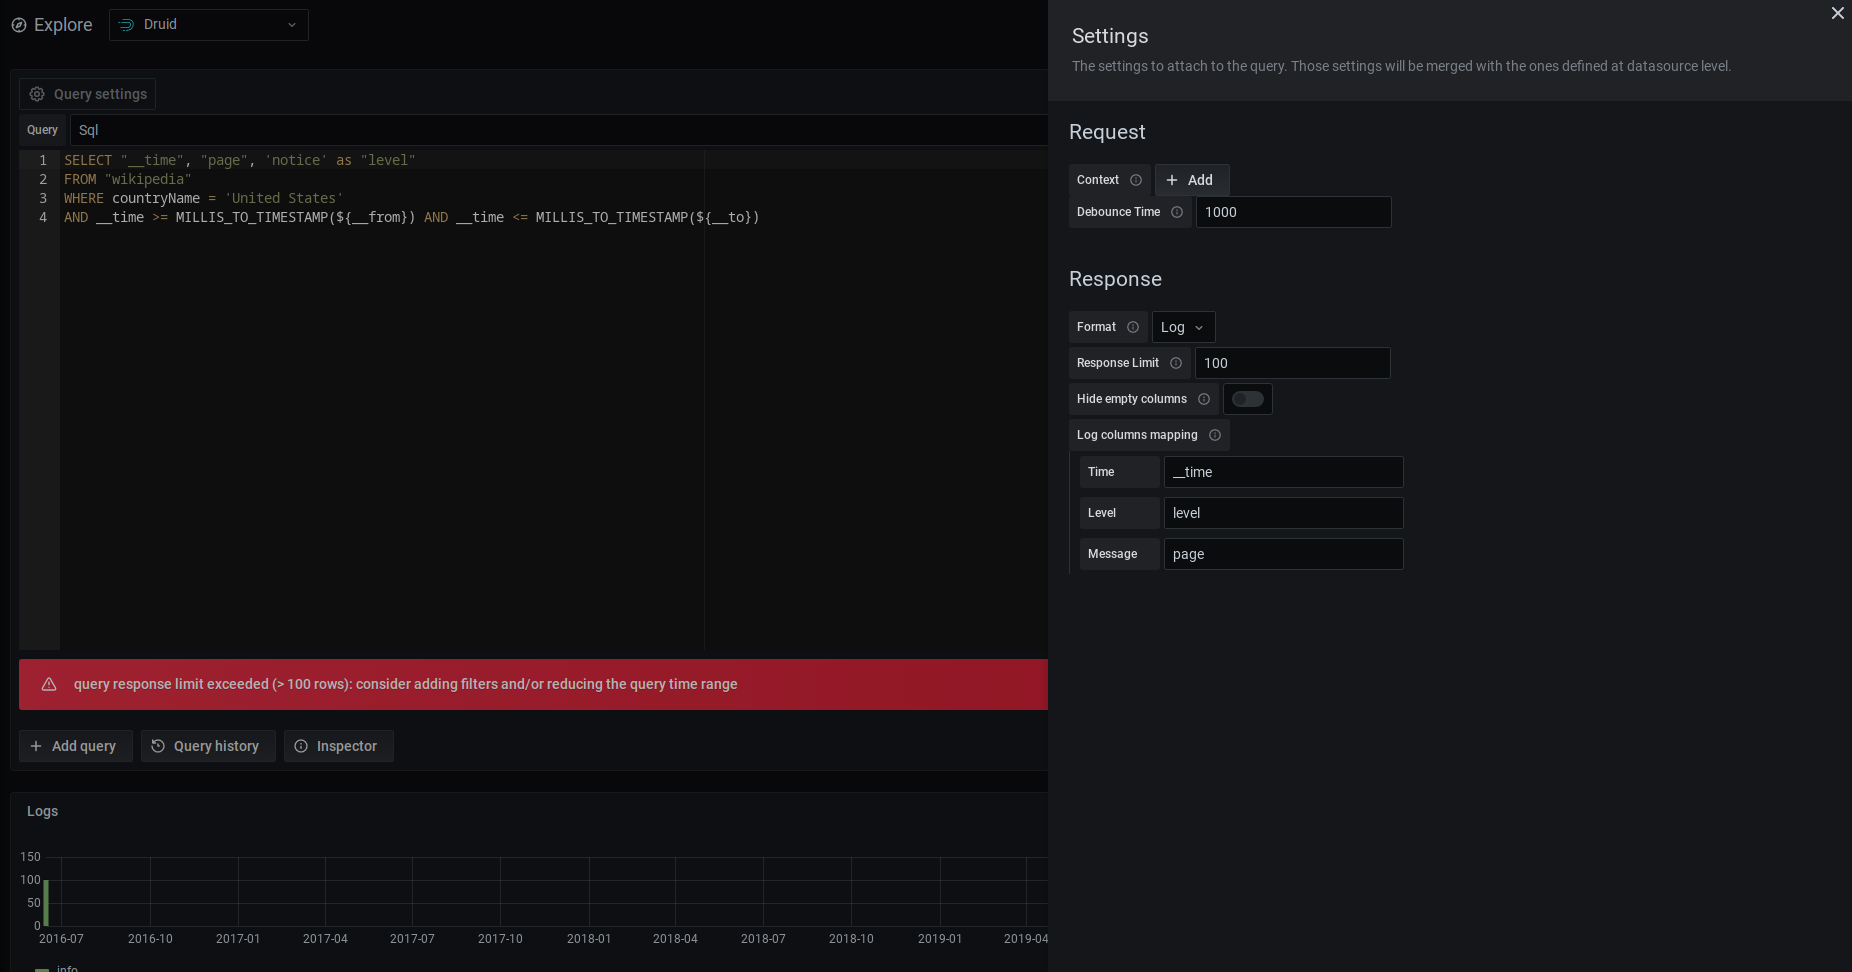
- Explore
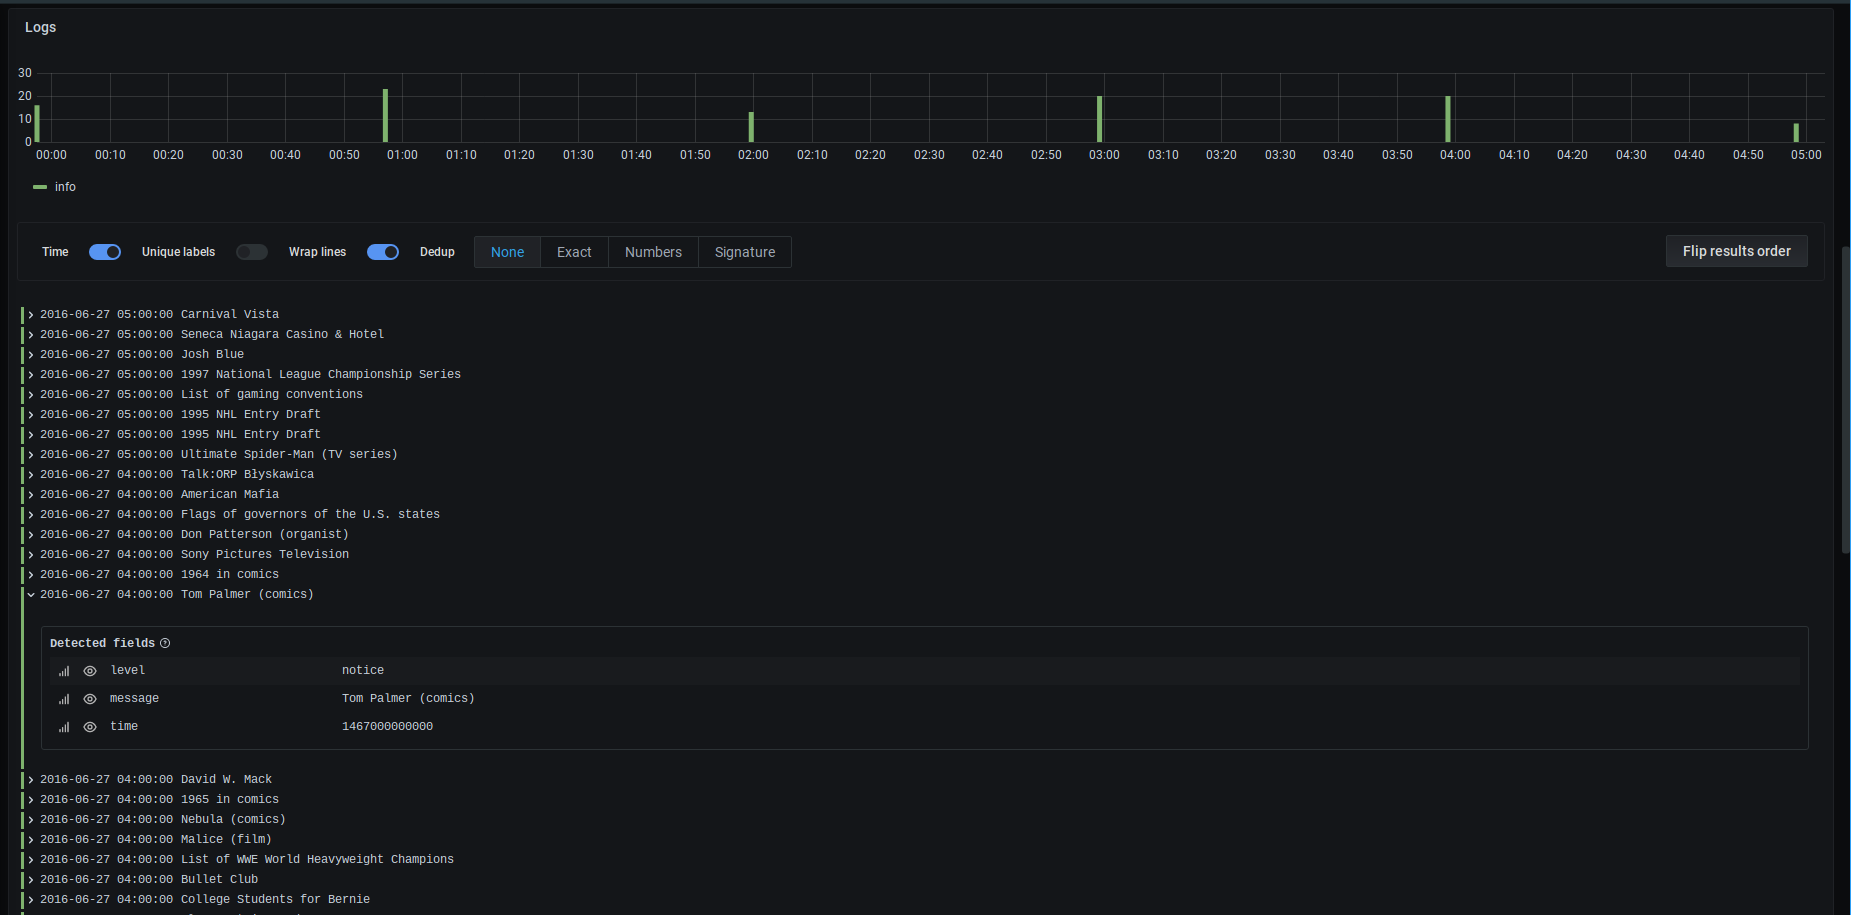
- Logs
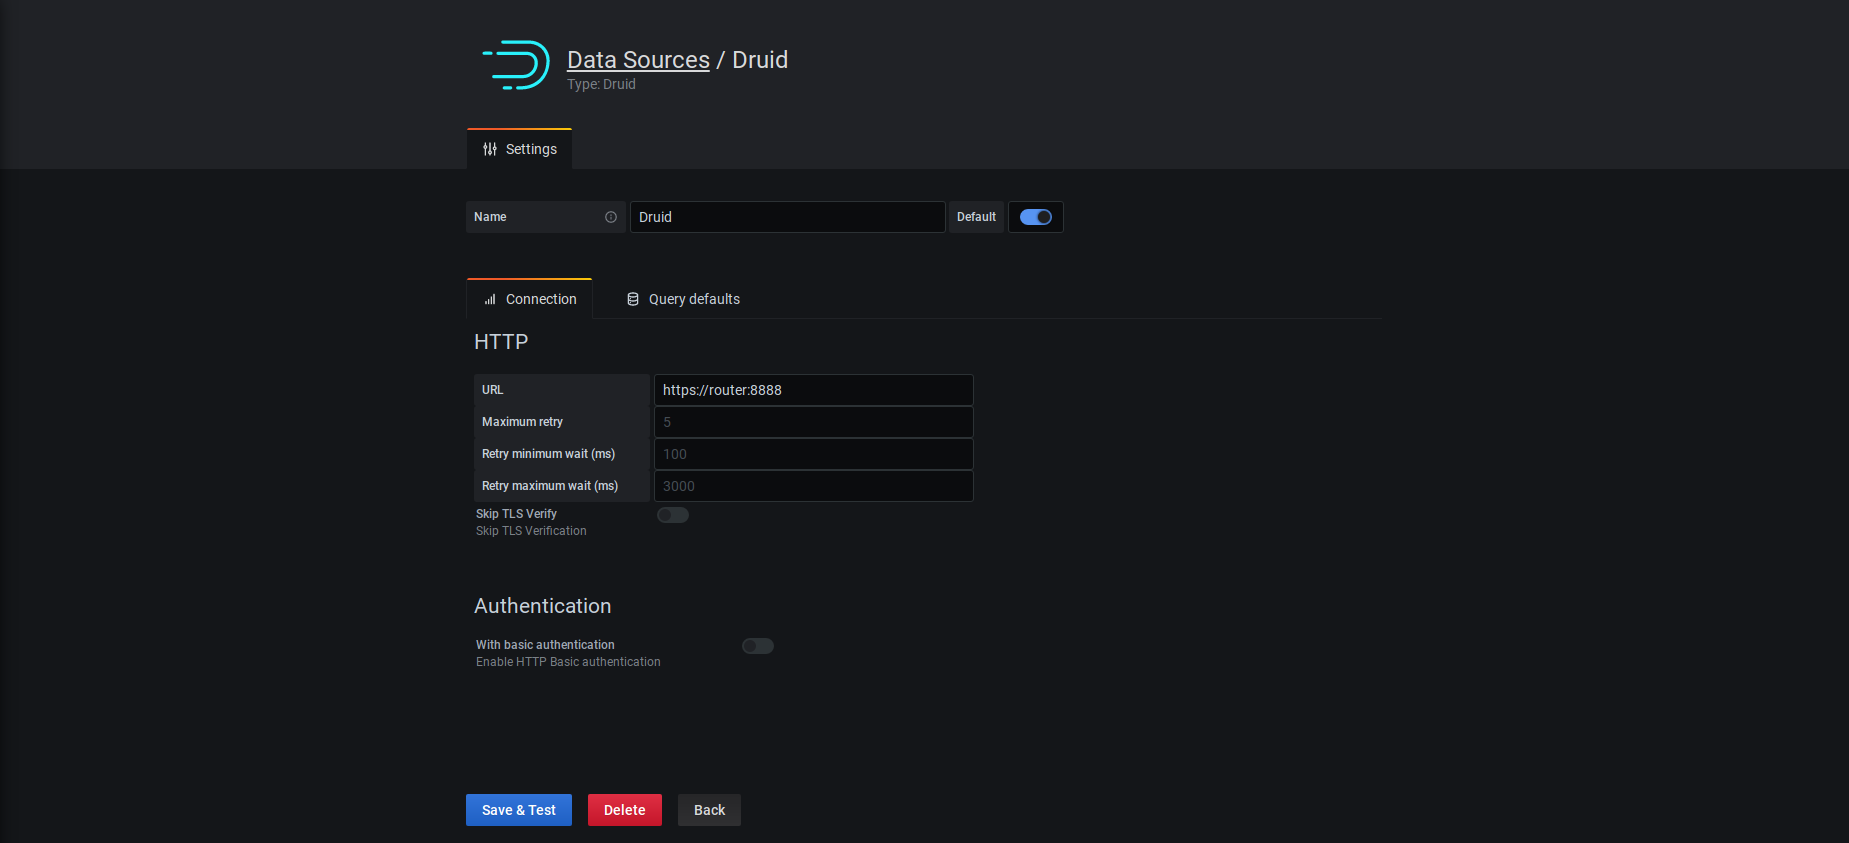
if you're using a self-signed TLS certificate, an option to "Skip TLS verify" will be shown when "https" is used in datasource URI)


Any contribution is welcome! Feel free to join on Slack to discuss :) To go further, see Contribute
- From Grafana.com:
grafana-cli plugins install grafadruid-druid-datasource $VERSION- If
$VERSIONis not specified latest version will be installed
- If
- From remote archive:
grafana-cli --pluginUrl https://github.com/grafadruid/druid-grafana/releases/download/v$VERSION/grafadruid-druid-datasource-$VERSION.zip plugins install grafadruid-druid-datasource - From local archive:
unzip grafadruid-druid-datasource-$VERSION.zip -d $YOUR_PLUGIN_DIR
Where $VERSION is for instance 1.0.0 and $YOUR_PLUGIN_DIR is for instance /var/lib/grafana/plugins
(Source: https://grafana.com/docs/grafana/latest/plugins/installation/)
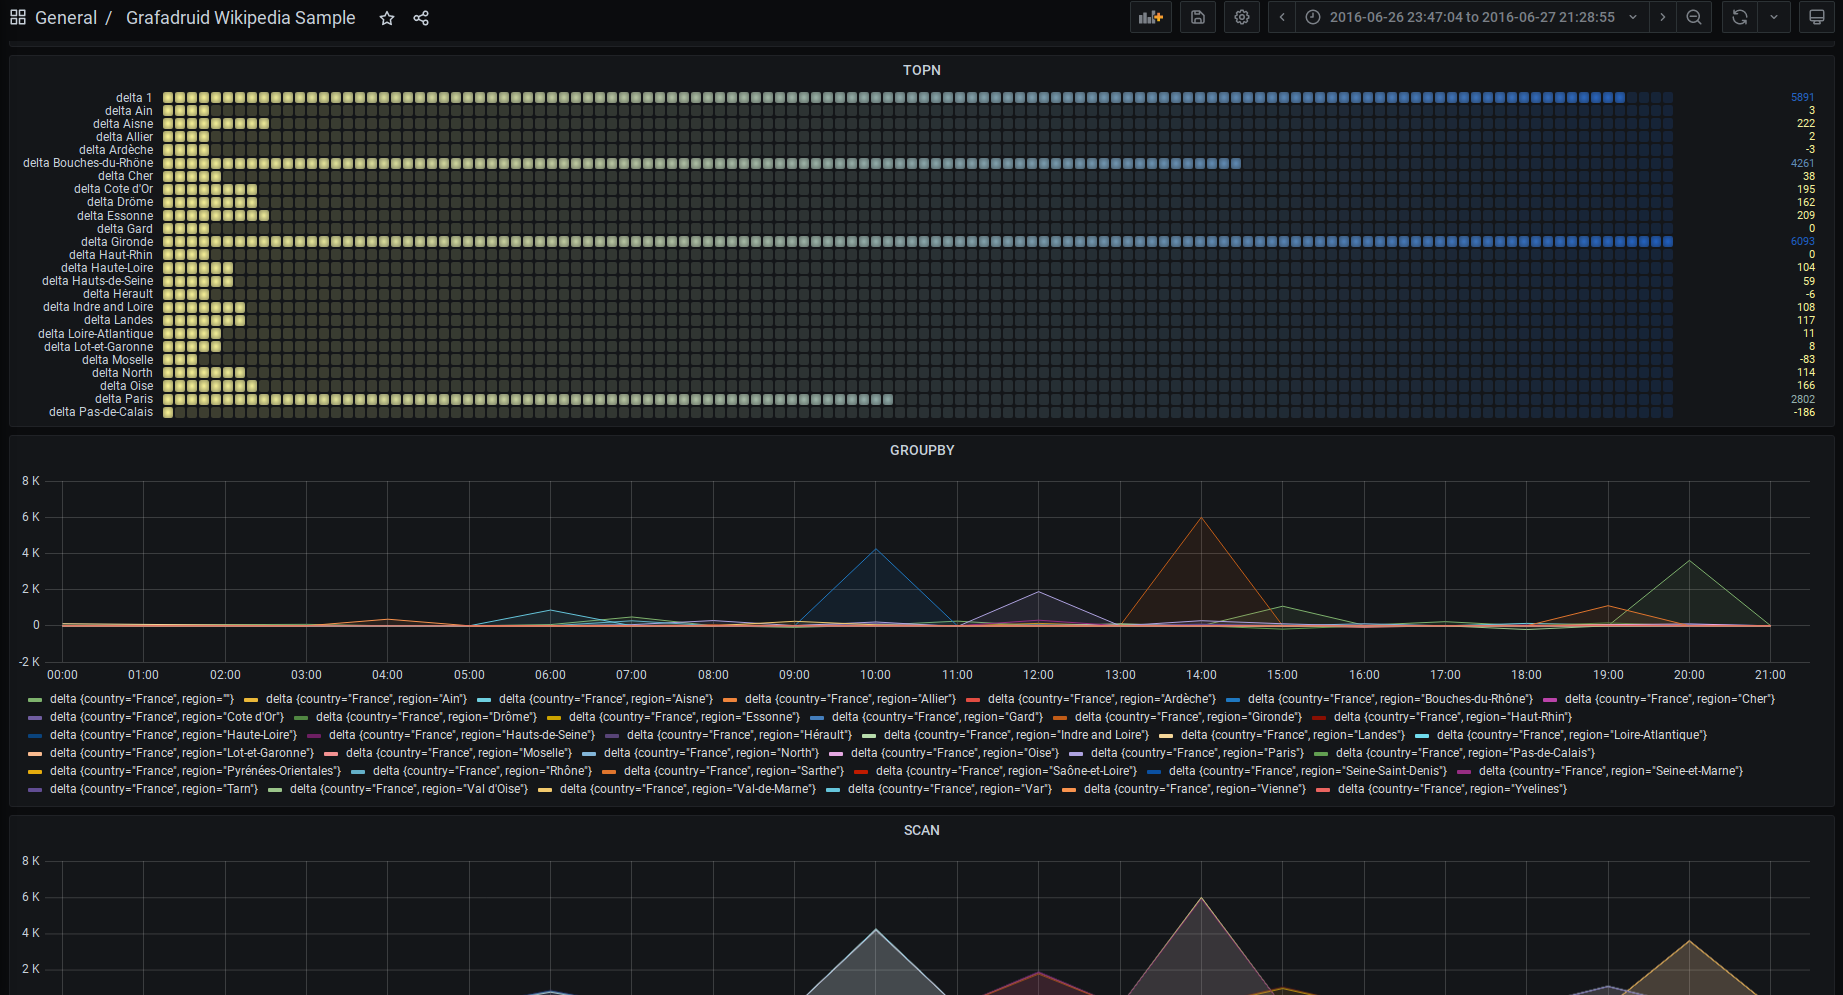
You can try out various advanced features of the plugin by importing the demo dashboard and running it against the Wikipedia dataset used in the Druid quickstart tutorial.
When using the provided docker based environment (
./mage env:start && ./mage), the dataset is automatically ingested in Druid, the datasource and dashboard are automatically provisionned in Grafana.


![dependabot[bot] avatar](https://avatars.githubusercontent.com/in/29110?v=4 "dependabot[bot]")