Git Product home page Git Product logo

globalnoc-networkmap-panel's Introduction

Network Map Panel for Grafana

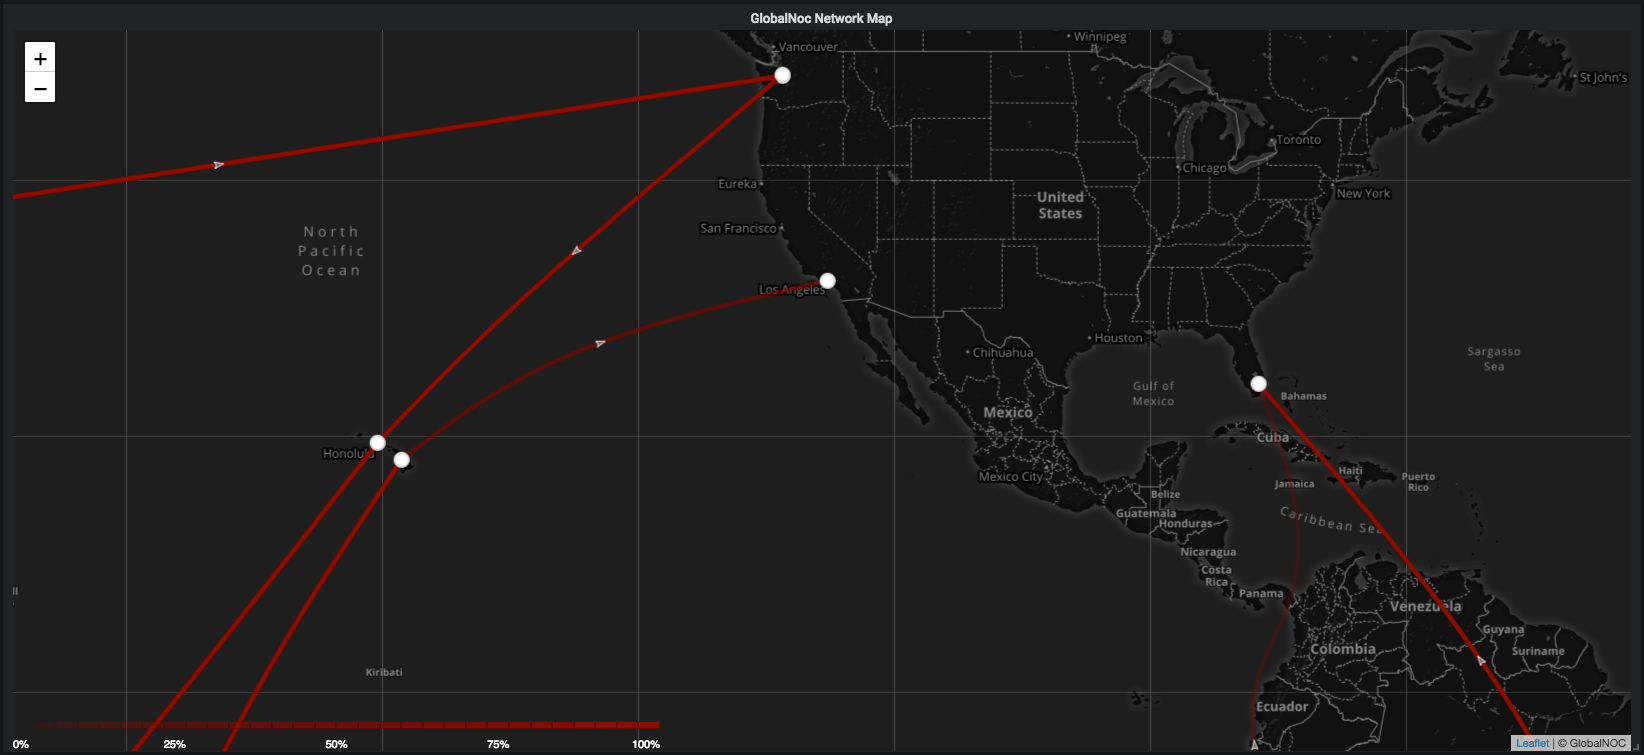
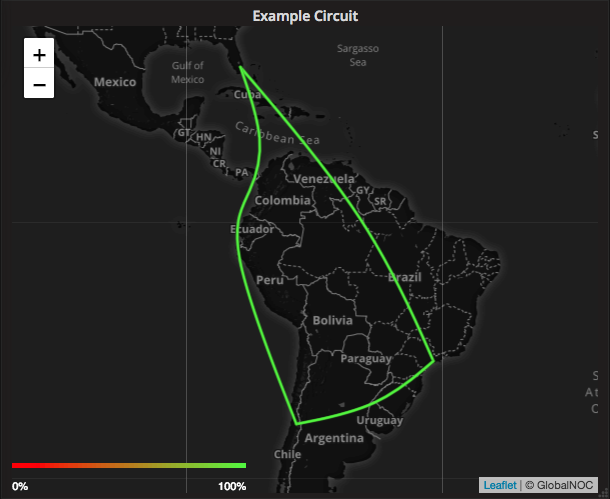
The Network Map Panel is a world map that provides the ability to monitor and visualize realtime traffic statistics. It uses timeseries data to represent traffic between nodes as circuits. It provides this information when hovered over the circuits and nodes.

Network Map

Features

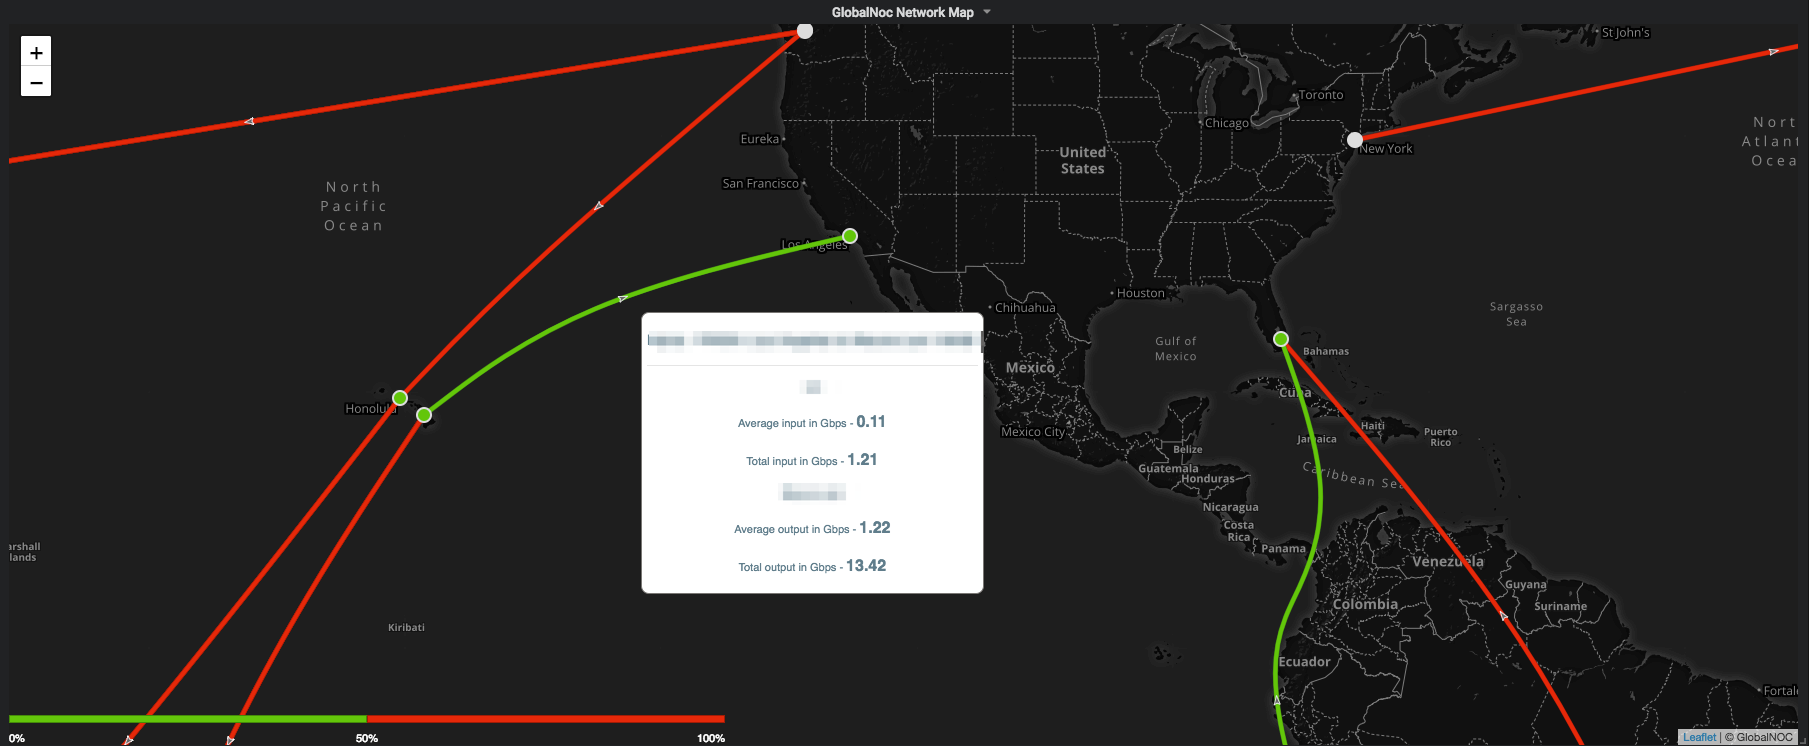
The Network Map Panel also provides the ability to configure different map options and display options.

Options Tab

Biggest Features

  • Map Options Map Options

    • Map URL: A valid map url should be provided so that the map loads with all the tiles. In the screenshot below, mapbox api is used to specify the map tiles. A valid access token is necessary for the mapbox API.

    • Hide Layers with no values: This option allows the user to hide any layers/circuits when there's no data returned for them.

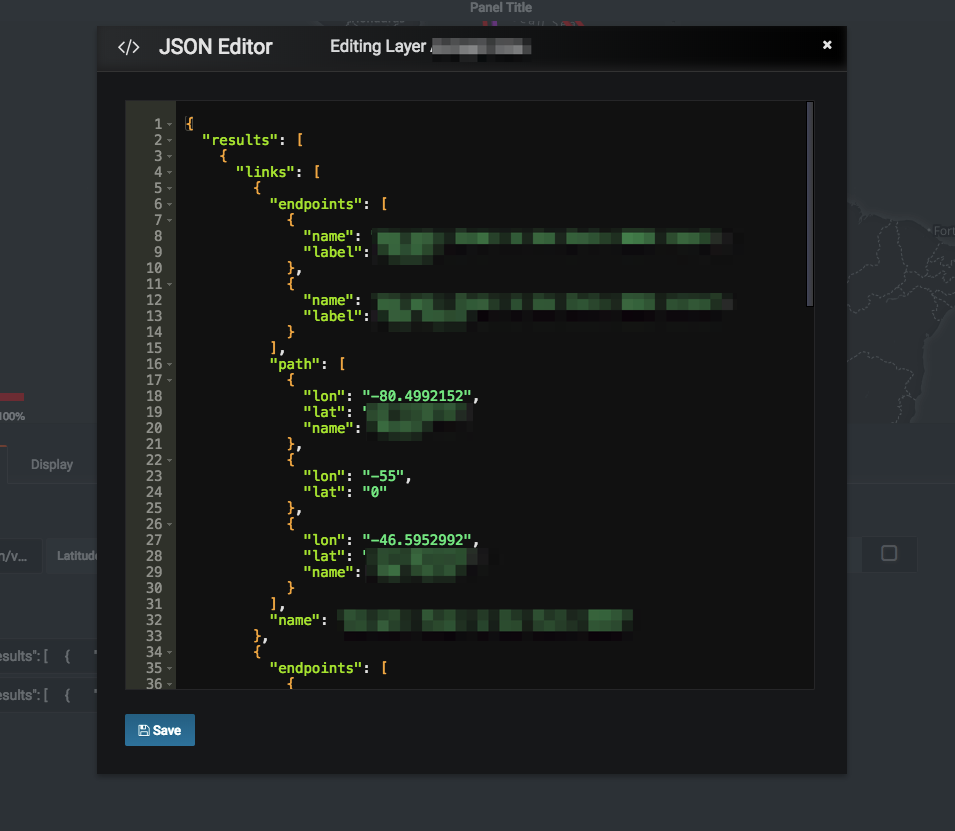
    • JSON Editor: Double clicking the 'Map Source' label or its input field opens a JSON Editor modal. This editor makes use of grafana's code-editor directive to provide the user with code editor capabilities such as syntax highlighting, error detection, collapsible fields etc.

      JSON Editor

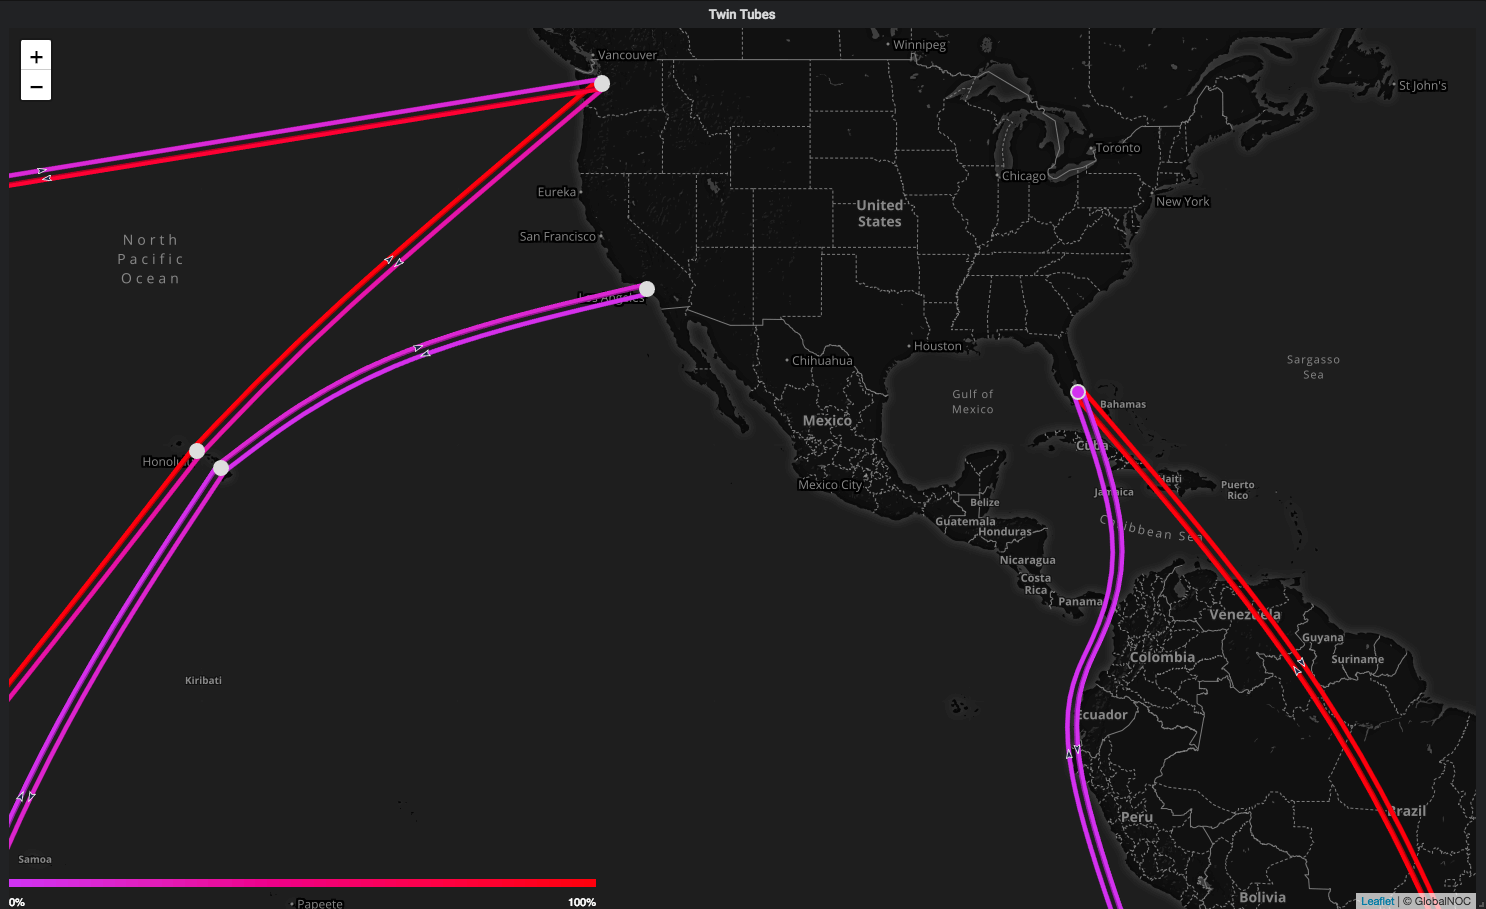
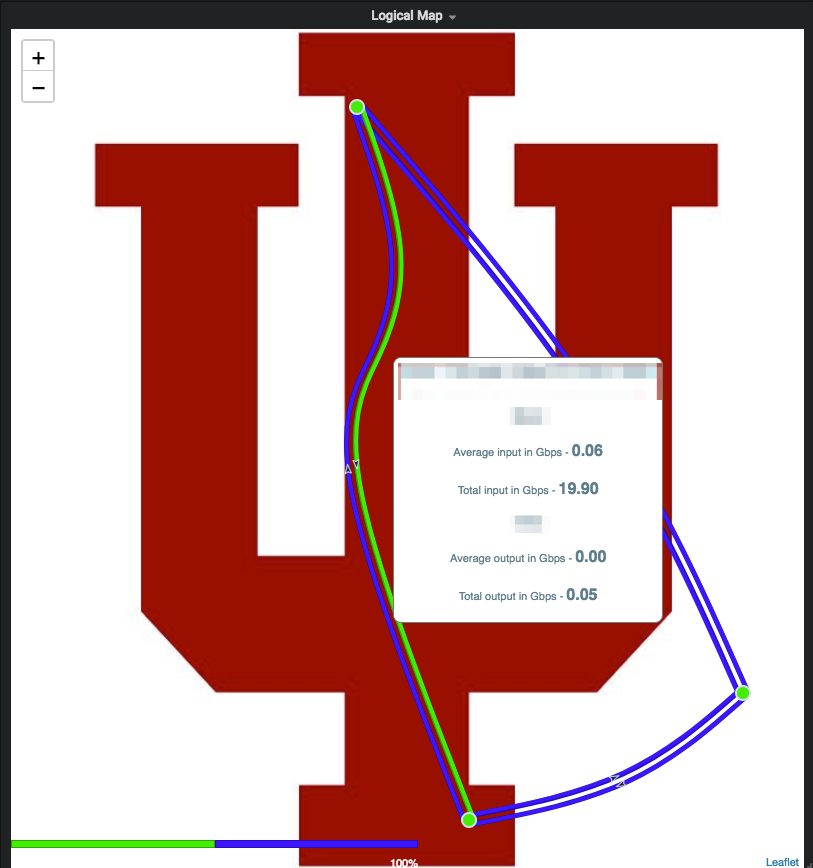
    • Twin Tubes: Checking this option switches the adjacency links on the map to twin tubes mode. Each line has a directional arrow associated with it.

      Twin Tubes

    • Logical Map: Checking the Use Image option allows the user to make use of logical maps. The image below shows the options available to create a logical map.

      Logical Map Options

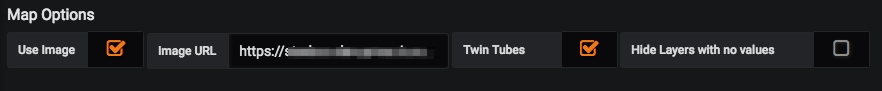
      • Image URL: A valid url to an image should be provided to create a logical map with that image.

      Logical Map

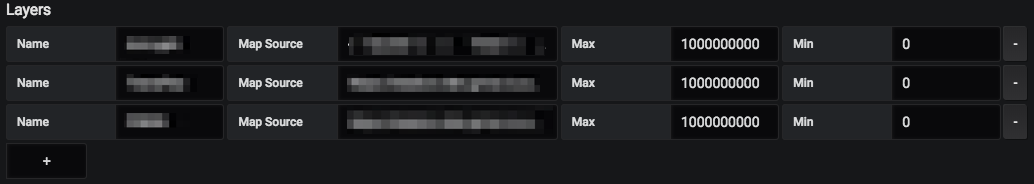
  • Layers: Different layers/circuits can be added to the map using this option. A valid Map Source is required to add each layer on to the map.

Layer Options

Example map source json object.

{
  "results": [
    {
      "links": [
        {
          "endpoints": [
	    {
	      "name": "enpoint1 to endpoint2 input",
              "label": "label for endpoint1"
	    },
	    {
	      "name": "endpoint1 to endpoint2 output",
              "label": "label for endpoint2"
	    }
	  ],
          "path": [
            {
              "lon": "138.8671875",
              "order": "10",
              "lat": "36.0313317763319"
            },
            {
              "lon": "-122.335927373024",
              "order": "20",
              "lat": "47.5652166492485"
            }
          ],
          "name": "Link Name"
        }
      ],
      "endpoints": [
        {
          "pop_id": null,
          "lon": "139.853142695116",
          "real_lon": null,
          "real_lat": null,
          "name": "endpoint1",
          "lat": "35.7653023546885"
        },
        {
          "pop_id": null,
          "lon": "-122.335927373024",
          "real_lon": null,
          "real_lat": null,
          "name": "endpoint2",
          "lat": "47.5652166492485"
        }
      ]
    }
  ]
}

Other Features

  • Ability to set the map's center by providing the lat and long coordinates.
  • Ability to specify the zoom level on the map.

Display Tab

Display tab provides different options for the user to customize the monitoring experience of the metrics on the map.

Biggest Features

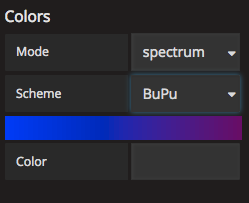
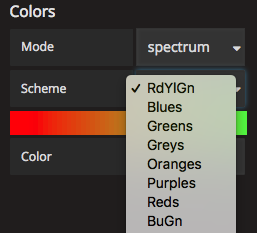
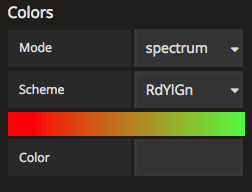
  • Colors: Ability to change the color scheme for the layers on the map based on two different modes.

    • Mode: Spectrum. This mode currently has 19 different color schemes to choose from.

colors-1 colors-2 colors-3

New Color Scheme

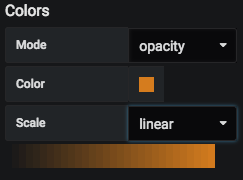
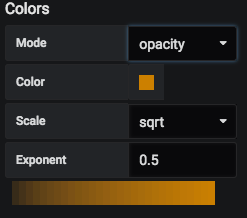
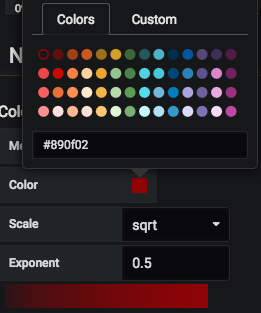
  • Mode: Opacity. This mode provides the ability to choose from two different scales, i.e., linear, sqrt. It also provides the option to choose a custom color from the color picker.

opacity-1 opacity-2 opacity-3

Opacity Scheme

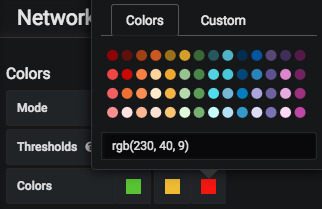
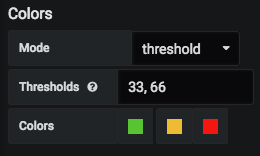
  • Mode: Threshold. This mode provides the ability to specify thresholds as comma separated values between 0 and 100 i.e. 0 < thresholds < 100. It provides the ability to choose a distinct color for each threshold.

threshold-1 threshold-2

threshold Scheme

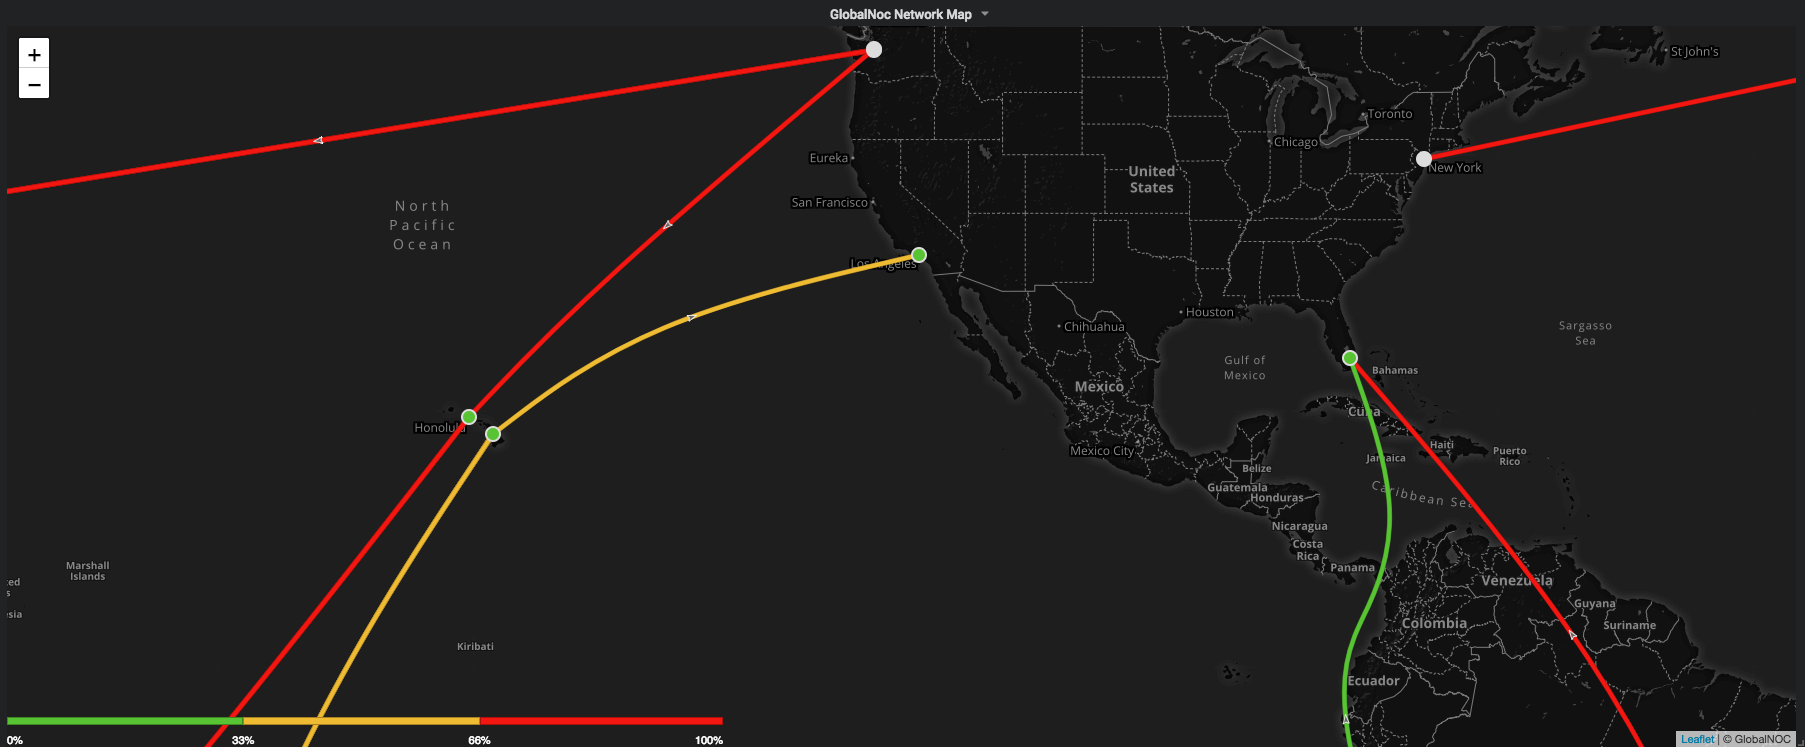
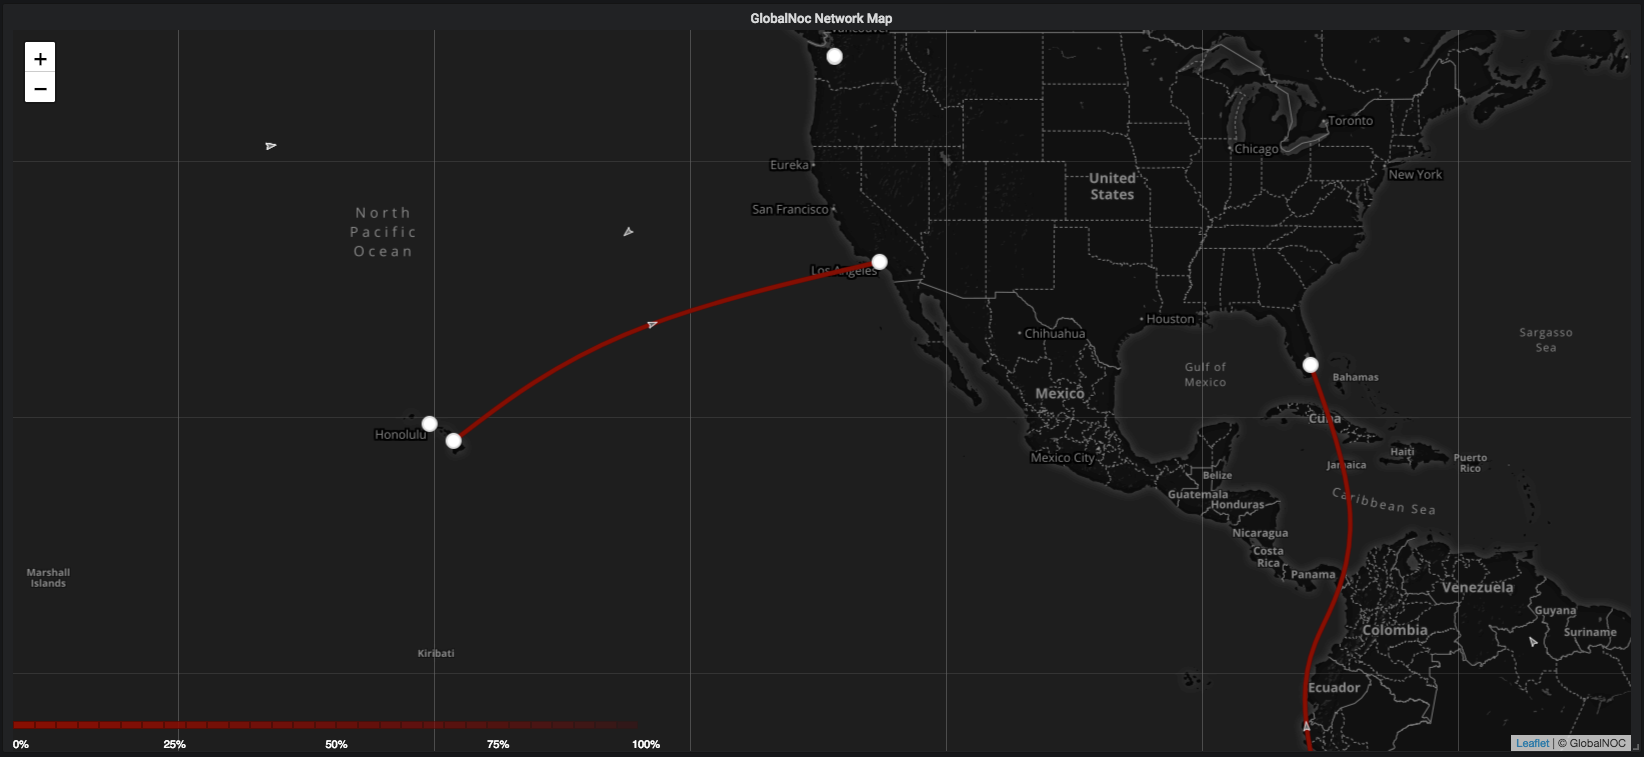
  • Legend: Invert legend. This option inverts the current legend on the map and also affects the map to use the inverted scheme.

Invert Legend Inverted Scheme

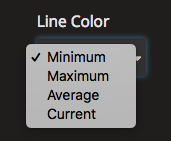
  • Line Color: Ability to choose the behavior of the line colors based on metric.

Line Color

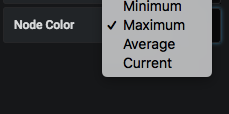
  • Node Color: Ability to choose the behavior of the node colors based on metric.

Node Color

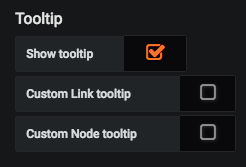
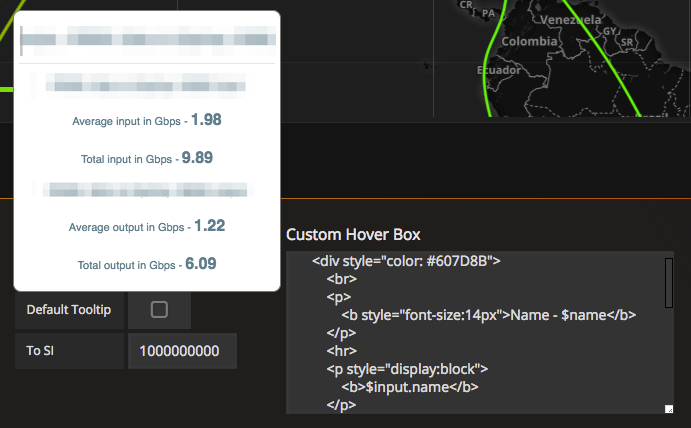
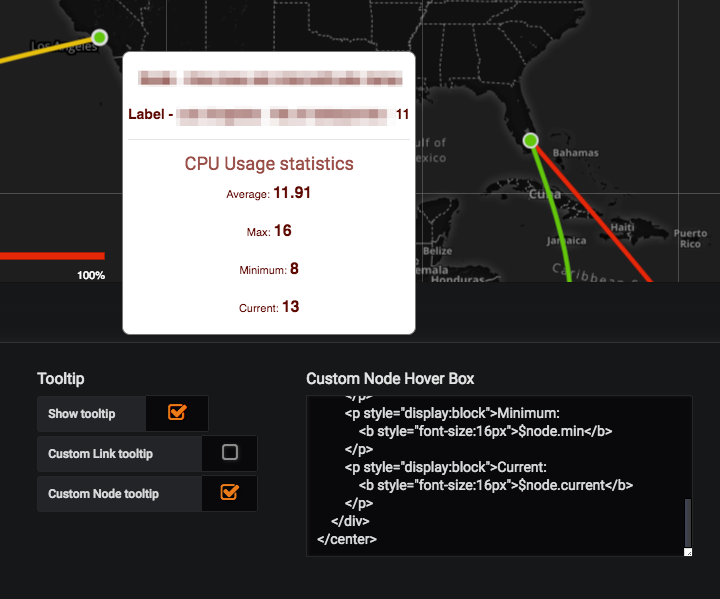
  • Tooltip: Ability to customize the tooltip for the map. It also provides an option for the user to enter html to have a customized link hover box and customized node hover box.
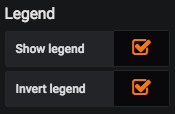
Tooltip Options

Tooltip

Tooltip

Other Features

  • Show or Hide Legend
  • Show or Hide Tooltip

Timeseries data for the Network Map

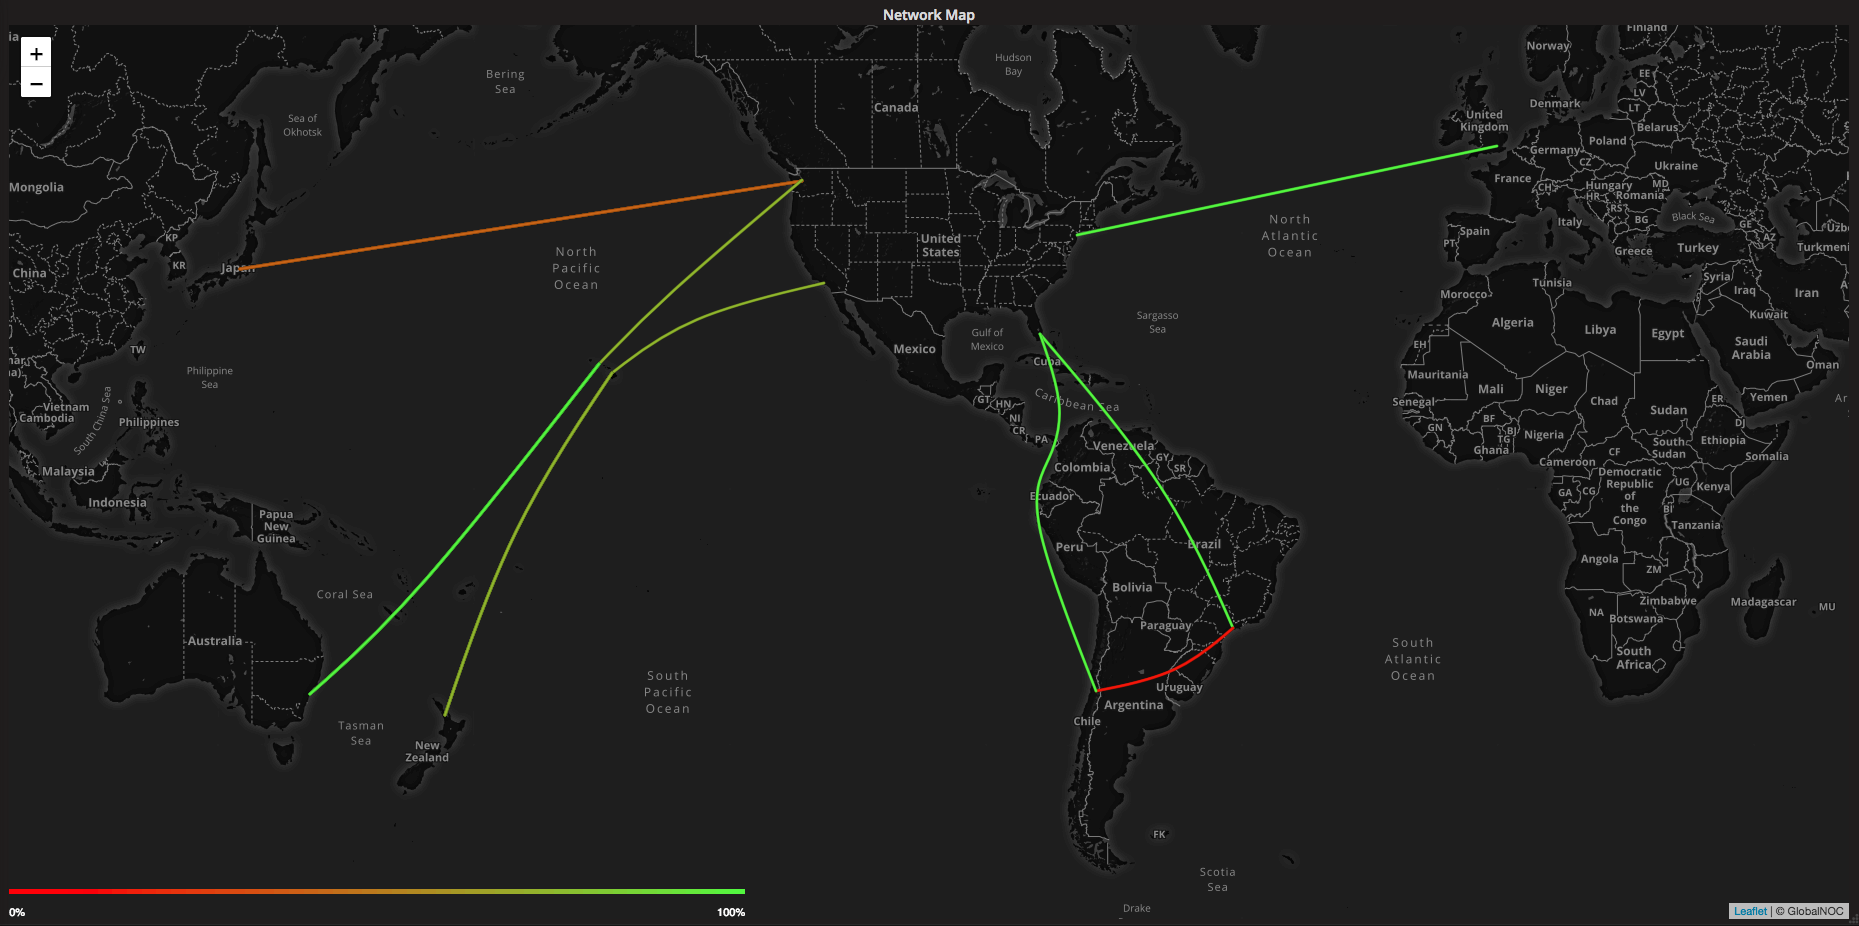
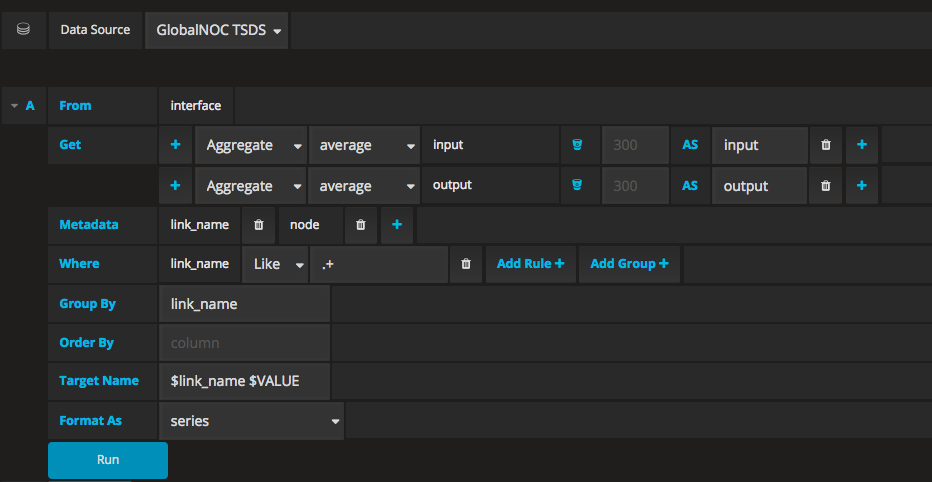
The Network Map Panel takes the timeseries data to represent the traffic between nodes. An example of a query is as follows. Note that the query is for the GlobalNoc's TSDS Datasource.

get link_name, node, aggregate(values.input, 60, average), aggregate(values.output, 60, average) between (1520024588, 1520024888) by link_name from interface where (link_name like ".+")

The query can also be built using the visual query builder from the metrics tab in the map editor. It is shown in the picture below.

TSDS Query

Example of the response dataList that is used by the Network Map Panel to process and render the circuits is shown in the block below.

{
  "dataList": [
  {
     "datapoints": [
        [32583665.47, 1520260620000],[28523481.33, 1520260680000],[23701115.87, 1520260740000],[26656626.8, 1520260800000],[null, 1520260860000]
     ],
     "name": "aggregate(values.input, 60, average)",
     "target": "endpoint1 to endpoint2 input"
  },
  {
     "datapoints": [
      [1171793116.67, 1520260620000],[1075541011.2, 1520260680000],[1005332018.67, 1520260740000],[1087891948.67, 1520260800000],[null, 1520260860000]
     ],
     "name": "aggregate(values.output, 60, average)",
     "target": "endpoint1 to endpoint2 output"
  },
  {...},
  {...}
  ]
}

The target name from each data object in the dataList is matched with the endpoints from the map source json object provided by the user. This allows the map to show the appropriate information for each circuit returned by the TSDS query.

Example

This section demonstrates how the map topology is lined up with the data returned by the TSDS query.

dataList object returned by the TSDS datasource.

{
    "dataList":[
        {
            "name": "aggregate(values.input, 60, average)", "target": "A: endpoint2 to endpoint3 input", "datapoints": [[32583665.47, 1520260620000],[...],[...]]
        },
        {
            "name": "aggregate(values.output, 60, average)", "target": "A: endpoint2 to endpoint3 output", "datapoints": [[...],[...],[...]]
        },
        {
            "name": "aggregate(values.input, 60, average)", "target": "A: endpoint1 to endpoint2 input", "datapoints":[[...],[...],[...]]
        },
        {
            "name": "aggregate(values.output, 60, average)", "target": "A: endpoint1 to endpoint2 output", "datapoints": [[...],[...],[...]]
        },
        {
            "name": "aggregate(values.input, 60, average)", "target": "A: endpoint1 to endpoint3 input", "datapoints": [[...],[...],[...]]
        },
        {
            "name": "aggregate(values.output, 60, average)", "target": "A: endpoint1 to endpoint3 input", "datapoints": [[...],[...],[...]]
        },
        {
            "name": "aggregate(values.input, 60, average)", "target": "B: endpoint1 to endpoint2 input", "datapoints": [[...],[...],[...]]
        },
        {
            "name": "aggregate(values.output, 60, average)", "target": "B: endpoint1 to endpoint2 output", "datapoints": [[...],[...],[...]]
        },
        {
            "name": "aggregate(values.input, 60, average)", "target": "C: endpoint2 to endpoint3 input", "datapoints": [[...],[...],[...]]
        },
        {
            "name": "aggregate(values.output, 60, average)", "target": "C: endpoint2 to endpoint3 output", "datapoints": [[...],[...],[...]]
        },
        {
            "name": "aggregate(values.input, 60, average)", "target": "C: endpoint3 to endpoint4 input", "datapoints": [[...],[...],[...]]
        },
        {
            "name": "aggregate(values.output, 60, average)", "target": "C: endpoint3 to endpoint4 output", "datapoints": [[...],[...],[...]]
        },
        {
            "name": "aggregate(values.input, 60, average)", "target": "C: endpoint5 to endpoint4 input", "datapoints": [[...],[...],[...]]
        },
        {
            "name": "aggregate(values.output, 60, average)", "target": "C: endpoint5 to endpoint4 output", "datapoints": [[...],[...],[...]]
        },
        {
            "name": "aggregate(values.input, 60, average)", "target": "C: endpoint1 to endpoint5 input", "datapoints": [[...],[...],[...]]
        },
        {
            "name": "aggregate(values.output, 60, average)", "target": "C: endpoint1 to endpoint5 output", "datapoints": [[...],[...],[...]]
        },
        {
            "name": "aggregate(values.input, 60, average)", "target": "D: endpoint1 to endpoint2 input", "datapoints": [[...],[...],[...]]
        },
        {
            "name": "aggregate(values.output, 60, average)", "target": "D: endpoint1 to endpoint2 output", "datapoints": [[...],[...],[...]]
        }
    ]
}

The target names from the above dataList are matched with the endpoints from links field in the Map Source JSON object.

Map Source JSON object with three endpoints.

{
  "results": [
    {
      "links": [
        {
          "endpoints": [
	     {
	       "name": "A: endpoint1 to endpoint3 input",
	       "label": "label for endpoint"
	     },
	     {
	       "name": "A: endpoint1 to endpoint3 output",
	       "label": "label for endpoint"
	     }
          ],
          "path": [
            {
              "lon": "-80.4992152",
              "lat": "26.2118715",
              "name": "ep1"
            },
            {
              "lon": "-55",
              "lat": "0"
            },
            {
              "lon": "-46.5952992",
              "lat": "-23.6824124",
              "name": "ep3"
            }
          ],
          "name": "A: endpoint1 to endpoint3"
        },
        {
          "endpoints": [
	    {
	      "name": "A: endpoint2 to endpoint3 input",
	      "label": "label for endpoint"
	    },
	    {
	      "name": "A: endpoint2 to endpoint3 output",
	      "label": "label for endpoint"
	    }
          ],
          "path": [
            {
              "lon": "-46.5952992",
              "lat": "-23.6824124",
              "name": "ep3"
            },
            {
              "lon": "-55",
              "lat": "-32"
            },
            {
              "lon": "-70.6791936",
              "lat": "-33.4533673",
              "name": "ep2"
            }
          ],
          "name": "A: endpoint2 to endpoint3"
        },
        {
          "endpoints": [
	    {
	      "name": "A: endpoint1 to endpoint2 input",
	      "label": "label for endpoint"
	    },
	    {
	      "name": "A: endpoint1 to endpoint2 output",
	      "label": "label for endpoint"
	    }
          ],
          "path": [
            {
              "lon": "-70.6791936",
              "lat": "-33.4533673",
              "name": "ep2"
            },
            {
              "lon": "-88",
              "lat": "5"
            },
            {
              "lon": "-79.7240525",
              "lat": "9.1422762"
            },
            {
              "lon": "-75",
              "lat": "15"
            },
            {
              "lon": "-80.4992152",
              "lat": "26.2118715",
              "name": "ep1"
            }
          ],
          "name": "A: endpoint1 to endpoint2"
        }
      ],
      "endpoints": [
        {
          "lon": "-80.4992152",
          "lat": "26.2118715",
          "name": "endpoint1 cpu",
	  "label": "endpoint1 label"
        },
        {
          "lon": "-46.5952992",
          "lat": "-23.6824124",
          "name": "endpoint2 cpu",
	  "label": "endpoint2 label"
        },
        {
          "lon": "-70.6791936",
          "lat": "-33.4533673",
          "name": "endpoint3 cpu",
	  "label": "endpoint3 label"
        }
      ]
    }
  ]
}

Network Map converts the map source json into an array of links and endpoints. Each element in the links array is an object that is represented in the block below.

[
  {
	  "endpoints": [{"name": "A: endpoint1 to endpoint3 input", "label": "label for endpoint"},{"name": "A: endpoint1 to endpoint3 output", "label": "label for endpoint"}].
	  "link_id": "link_1234",
	  "name": "A: endpoint1 to endpoint3",
	  "path": [{lat,lng,name,...},{lat,lng,name,...},{lat,lng,name,...}]
  }, 
  {...},
  {...},
  {...},
    .
    .
    .
]

The map renders circuits if the endpoints.name of these links match with the target in the dataList array. In addition, the corresponding data for each circuit is used to calculate the metrics to be shown on the map.

In the example above, the first six results in the dataList object match with the endpoints.name from each of the three links. Therefore, the network map renders three circuits for the provided map source json object.

example circuit

Technology

The Network Map Panel makes use of the following libraries:

  • Leaflet
  • D3
  • Lodash

globalnoc-networkmap-panel's People

Contributors

ajragusa avatar ardeora avatar csg33k avatar daldoyle avatar dependabot[bot] avatar hipska avatar katrinaturner avatar maheshkhanal avatar sreemukha avatar whatwehaveunlearned avatar

Stargazers

 avatar  avatar  avatar  avatar  avatar  avatar  avatar  avatar  avatar  avatar  avatar  avatar  avatar  avatar  avatar  avatar  avatar  avatar  avatar  avatar  avatar  avatar  avatar  avatar  avatar  avatar  avatar  avatar  avatar  avatar  avatar  avatar  avatar  avatar  avatar  avatar  avatar  avatar  avatar  avatar  avatar  avatar  avatar  avatar  avatar  avatar  avatar  avatar  avatar  avatar  avatar  avatar  avatar  avatar  avatar  avatar  avatar  avatar  avatar  avatar  avatar  avatar  avatar  avatar  avatar  avatar  avatar  avatar  avatar  avatar  avatar  avatar  avatar  avatar  avatar  avatar  avatar  avatar  avatar  avatar  avatar  avatar  avatar  avatar  avatar  avatar  avatar  avatar  avatar  avatar  avatar  avatar  avatar  avatar  avatar  avatar  avatar  avatar  avatar  avatar

Watchers

 avatar  avatar  avatar  avatar  avatar  avatar  avatar  avatar  avatar  avatar  avatar  avatar  avatar  avatar  avatar  avatar  avatar  avatar  avatar  avatar  avatar  avatar

globalnoc-networkmap-panel's Issues

Can't install plugin on CentOS Linux release 7.7.1908 (Core)

i have problem on installation:
logs:
1. NPM install

npm WARN [email protected] No repository field.
npm WARN optional SKIPPING OPTIONAL DEPENDENCY: [email protected] (node_modules/fsevents):
npm WARN notsup SKIPPING OPTIONAL DEPENDENCY: Unsupported platform for [email protected]: wanted {"os":"darwin","arch":"any"} (current: {"os":"linux","arch":"x64"})

audited 8518 packages in 16.636s

2. npm install gulp -g

/usr/bin/gulp -> /usr/lib/node_modules/gulp/bin/gulp.js
npm WARN optional SKIPPING OPTIONAL DEPENDENCY: [email protected] (node_modules/gulp/node_modules/fsevents):
npm WARN notsup SKIPPING OPTIONAL DEPENDENCY: Unsupported platform for [email protected]: wanted {"os":"darwin","arch":"any"} (current: {"os":"linux","arch":"x64"})

3. npm run build

[email protected] build /var/lib/grafana/plugins/globalnoc-networkmap-panel
gulp

fs.js:35
} = primordials;
^

ReferenceError: primordials is not defined
at fs.js:35:5
at req_ (/var/lib/grafana/plugins/globalnoc-networkmap-panel/node_modules/natives/index.js:143:24)
at Object.req [as require] (/var/lib/grafana/plugins/globalnoc-networkmap-panel/node_modules/natives/index.js:55:10)
at Object. (/var/lib/grafana/plugins/globalnoc-networkmap-panel/node_modules/vinyl-fs/node_modules/graceful-fs/fs.js:1:37)
at Module._compile (internal/modules/cjs/loader.js:1151:30)
at Object.Module._extensions..js (internal/modules/cjs/loader.js:1171:10)
at Module.load (internal/modules/cjs/loader.js:1000:32)
at Function.Module._load (internal/modules/cjs/loader.js:899:14)
at Module.require (internal/modules/cjs/loader.js:1040:19)
at require (internal/modules/cjs/helpers.js:72:18)
npm ERR! code ELIFECYCLE
npm ERR! errno 1
npm ERR! [email protected] build: gulp
npm ERR! Exit status 1
npm ERR!
npm ERR! Failed at the [email protected] build script.
npm ERR! This is probably not a problem with npm. There is likely additional logging output above.

npm ERR! A complete log of this run can be found in:
npm ERR! /root/.npm/_logs/2020-01-23T03_57_50_772Z-debug.log

  1. Error Loading Plugin ; Grafana v6.5.3 (commit: 05025c5)
    image

any suggestions ?

Update lodash to 4.17.5

The current version of lodash has a potential security vulnerability. The panel needs to be updated to use v4.17.5. Make sure there are no compatibility issues with the new version

Map calculation

Hello team,

I have been reading and working with plugin, and I must say, a powerful tool! I am having a bit of difficulty getting my data to come in properly so that the color coding will work. I know its intended to network throughput, but I was thinking I could adapt it for use in monitoring microwave links. When I hover over the endpoints, my values are displayed, but the plugin renders my query values as "down" and won't paint the link or endpoints the color in the spectrum or threshold modes. My question is to better understand the background calculations so that I can manipulate the output data from Influx to satisfy how the plugin operates. I am able to link data to my map source layer JSON, but massaging my query results into a color based layer for data visualization is perplexing me. Details below:

Grafana 7 not in a docker
Ubuntu 20
latest pull from this repository for the globalnoc-networkmap-panel
All installs completed without error.

Query:
SELECT "genEquipRfuStatusRxLevel" *-1 FROM "genEquipRfuStatusTable" WHERE ("genEquipRfuStatusId" = '268451905') AND $timeFilter GROUP BY "agent_host"

Which yeilds an output from the link device as a negative value (dBm) from the microwave radio, which I flip to positive for this plugin with a *-1.

Map Source JSON:
{
"results": [
{
"links": [
{
"endpoints": [
{
"name": "10.20.30.205",
"label": "Ruffner"
},
{
"name": "10.20.30.68",
"label": "Pilot Knob"
}
],
"path": [
{
"lon": "-86.699440",
"lat": "33.565345",
"name": "10.20.30.205"
},
{
"lon": "-86.667503",
"lat": "33.600121",
"name": "10.20.30.68"
}
],
"name": "10.20.30.205"
}
],
"endpoints": [
{
"lon": "-86.699440",
"lat": "33.565345",
"name": "10.20.30.205",
"label": "Ruffner"
},
{
"lon": "-86.667503",
"lat": "33.600121",
"name": "10.20.30.68",
"label": "Pilot Knob"
}
]
}
]
}

Data from my query is:
Capture

Object
request:Object
method:"GET"
url:"api/datasources/proxy/1/query"
params:Object
db:"ptp820"
q:"SELECT "genEquipRfuStatusRxLevel" *-1 FROM "genEquipRfuStatusTable" WHERE ("genEquipRfuStatusId" = '268451905') AND time >= now() - 6h GROUP BY "agent_host""
epoch:"ms"
data:null
precision:"ms"
response:Object
results:Array[1]
0:Object
statement_id:0
series:Array[44]
0:Object
name:"genEquipRfuStatusTable"
tags:Object
agent_host:"10.19.29.135"
columns:Array[2]
0:"time"
1:"genEquipRfuStatusRxLevel"
values:Array[179]
0:Array[1600611133000,36]
1:Array[1600611245000,36]
2:Array[1600611374000,36]
3:Array[1600611484000,36]
4:Array[1600611613000,36]
5:Array[1600611734000,36]
6:Array[1600611863000,36]

Thank you for any assistance. I'm sure I'm overlooking something or trying to make something work that wasn't designed to.

Can't install the plugins

I try to install the plugins but I have this error : What are step for install this plugin

$ npm run build

[email protected] build C:\Users\jmanset\Downloads\globalnoc-networkmap-panel
gulp

fs.js:27
const { Math, Object } = primordials;
^

ReferenceError: primordials is not defined
at fs.js:27:26
at req_ (C:\Users\bazinlougi\Downloads\globalnoc-networkmap-panel\node_modules\natives\index.js:143:24)
at Object.req [as require] (C:\Users\bazinlougi\Downloads\globalnoc-networkmap-panel\node_modules\natives\index.js:55:10)
at Object. (C:\Users\bazinlougi\Downloads\globalnoc-networkmap-panel\node_modules\vinyl-fs\node_modules\graceful-fs\fs.js:1:37)
at Module._compile (internal/modules/cjs/loader.js:945:30)
at Object.Module._extensions..js (internal/modules/cjs/loader.js:962:10)
at Module.load (internal/modules/cjs/loader.js:798:32)
at Function.Module._load (internal/modules/cjs/loader.js:711:12)
at Module.require (internal/modules/cjs/loader.js:838:19)
at require (internal/modules/cjs/helpers.js:74:18)
npm ERR! code ELIFECYCLE
npm ERR! errno 1
npm ERR! [email protected] build: gulp
npm ERR! Exit status 1
npm ERR!
npm ERR! Failed at the [email protected] build script.
npm ERR! This is probably not a problem with npm. There is likely additional logging output above.

Map is not properly rendered with Grafana 6.3.3

Hi everyone,

Network map does not seem to be properly rendered according to the panel size in Grafana v6. Issue occurs with Grafana v6.3.3 but not with Grafana v5.x.x.

globalnoc_netmap_bug_size

Map is correctly set only when click on the panel title.

Is anyone else get the same issue?

add logical map support

We need to be able to support logical maps. I'm pretty sure this from a networkmap panel is relatively easy code wise, however we need to proof of concept it and work on how to do it in production. Also we need to determine any limitations (ie.. image type, size) for the feature

Threshold Color Mode - Limited Number Inputs by Browser

While using the threshold color mode on FireFox, entering more than 7 values as "Thresholds" causes the page to refresh, wiping any additions without saving. Attempting the same thing in Chrome will allow up to 24 "Thresholds". We should try to keep this consistent across browsers and set a reasonable limit for the number of thresholds allowed.

configurable line width scaling

Sometimes when zoomed out fairly far it is difficult to hover over a line. We should allow for configurable line width scaling per-layer (allowing people to also show a difference between say 100G and 10G links). This would be implemented in the topology

Links do not show up in Safari.

Hi when using Safari 13.0.3, the links of the network map are not displayed.

The nodes (endpoints) are displayed correctly and the links are displayed when using Chrome, so it doesn't seem to be a configuration problem.

There is the following error in the console:

[Error] must set onInitComplete (atlas3_leafletmap.js:44506)
(anonymous function) (atlas3_leafletmap.js:44596)
(anonymous function) (atlas3_leafletmap.js:48901)
(anonymous function) (atlas3_leafletmap.js:44675)
(anonymous function) (atlas3_leafletmap.js:47403)
(anonymous function) (atlas3_leafletmap.js:47273)
(anonymous function) (atlas3_leafletmap.js:47382)
(anonymous function) (atlas3_leafletmap.js:46281)
(anonymous function) (atlas3_leafletmap.js:45391)
render (atlas3.js:797)

bad line coloring with no data

When there is no data, the line is treated as if it has seemingly infinity as the value. If my legend goes from light blue to dark blue and there is no data (but the record is in the result set) the line gets drawn as max legend value. See attached screenshot

screen shot 2018-06-26 at 9 58 53 am

I think this should be treated the same as when the record isn't in the result set - ie, make it grey.

tooltip colored with legend

It would be really neat if the tooltip markup could somehow indicate a way to color the values according to the legend.

For example, the legend may use a light blue to indicate 50%. When I mouse over it and the tooltip appears I might want to show current, average, min, max and it would be visually nice if they could be rendered in the color corresponding in the legend. In this case it might be $input.now or similar

More zoom levels

It'd be great to be able to zoom a half step (or less). Zooming in one step makes the map too big, zooming out 1 step makes it too small.

Can't install

Cant't build:

ReferenceError: primordials is not defined at fs.js:35:5

Node version: v12.16.1
Gulp: CLI version: 2.3.0
Local version: 3.9.1

"Panel plugin not found: globalnoc-networkmap-panel"

Hi,

I installed the plugin into the latest grafana docker container, according to the grafana docs over at https://grafana.com/docs/installation/docker/#installing-plugins-from-other-sources with environment variable

GF_INSTALL_PLUGINS=https://github.com/GlobalNOC/globalnoc-networkmap-panel/archive/1.1.2.zip;globalnoc-networkmap-panel

When selecting the Network Map as a panel type, Grafana responds with a red error button

Panel plugin not found: globalnoc-networkmap-panel

Also, under Startpage -> Panels -> Network Map it does not show the Readme: "No plugin help or readme markdown file was found"

I verified the path and README.md is available:

grafana@0d206a83daf2:/var/lib/grafana/plugins/globalnoc-networkmap-panel$ ls -Alh
total 60K
-rw-r--r-- 1 grafana grafana 26 Jun 25 14:00 .gitignore
-rw-r--r-- 1 grafana grafana 452 Jun 25 14:00 BUILD.md
-rw-r--r-- 1 grafana grafana 4.4K Jun 25 14:00 CHANGES.md
-rw-r--r-- 1 grafana grafana 575 Jun 25 14:00 LICENSE
-rw-r--r-- 1 grafana grafana 395 Jun 25 14:00 Makefile
-rw-r--r-- 1 grafana grafana 16K Jun 25 14:00 README.md
-rw-r--r-- 1 grafana grafana 758 Jun 25 14:00 grnoc-grafana-worldview.spec
-rw-r--r-- 1 grafana grafana 6.3K Jun 25 14:00 gulpfile.js
-rw-r--r-- 1 grafana grafana 2.0K Jun 25 14:00 package.json
drwxr-xr-x 6 grafana grafana 4.0K Jun 25 14:00 src

Other plugins work as intended that way.

Any ideas?

hover issue

It seems that the tooltip generated on the hover event may not actually be destroyed when it hides, just maybe made invisible. This can block mouse operations in the area in strange ways.

The tooltip appears to the bottom right of the pointer, so if you mouse over something and then mouse out allowing the tooltip to disappear, then try to mouse over an element to its bottom right you will find that it doesn't actually work because I think the overlay is still technically there. If you mouse over something far away and then return to it it works again because the overlay has moved.

I think this could be fixed in a couple of ways when hiding the overlay, have to tinker to see what makes the most sense.

1 - just destroy it instead of hiding it
2 - when hiding it, set the z-index to way in the back
3 - when hiding it, set the height/width to 0 so that it effectively takes up no space

Displaying dynamic metric values on the map.

I am able to mark the routers on the map and the link between them using the map source (json editor) option. I am trying to display the dynamic values(input rate) fetched from metric query on the map using legend when hovered over the link. But unable to find a way to do so. I tried passing the value in json editor, but couldn't get to see that on the map. Looking for help on displaying the dynamic values on the map. Thanks in advance.
The metric query and legend used is:
metric: ifHCInOctets
legend: ipRate

Below is the json in the map source for marking the routers and link.
{
"results": [
{
"links": [
{
"path": [
{
"lon": "-150.991531",
"lat": "40.742043"
},
{
"lon": "-150.991531",
"lat": "70.742043"
}

			],
			"name": "Interface 1",
                             "current": "100 Kbps"
			
		}
	],
	"endpoints": [
    {
      "pop_id": null,
      "lon": "-150.991531",
      "real_lon": null,
      "real_lat": null,
      "name": "DEN B",
      "lat": "40.742043"
    },
	{
      "pop_id": null,
      "lon": "-150.991531",
      "real_lon": null,
      "real_lat": null,
      "name": "DEN A",
      "lat": "70.742043"
    }
  ]
}

]
}

Unable to edit Map Source

Hi guys,

I am trying to set up this plugin in grafana 5.2.3 under docker (official image), and when editing the "Map Source" field, the JSON Editor pops-up, but hitting "Save" does nothing.

imagen

Also, when reviewing the plugin's code the title of the code editor shoud read "Editing Layer Name", but in my case the name does not show. I tried the browser's console but no info is logged when I press Save button.

I'd really appreciate your help with this.

Missing install documentation

I'm trying to get this up and running on Grafana v5.4.3 (6539180) with following OS.

lsb_release -a
No LSB modules are available.
Distributor ID:	Ubuntu
Description:	Ubuntu 18.04.1 LTS
Release:	18.04
Codename:	bionic

I have cloned the repo to /var/lib/grafana/plugins/{ install_dir } and reloaded Grafana. After this I can see the Panel in "Add panels". But after adding the panel to a Dashboard, I can't edit it or manipulate it in any way.

What is missing here?

NPM deprecation warnings

When running npm install for the first time, I get a lot of depreciation warnings:

npm WARN deprecated [email protected]: Use topojson-client, topojson-server or topojson-simplify directly.
npm WARN deprecated [email protected]: This module is now under the @mapbox namespace: install @mapbox/leaflet-omnivore instead
npm WARN deprecated [email protected]: Use topojson-client, topojson-server or topojson-simplify directly.
npm WARN deprecated [email protected]: This module has moved: please install @mapbox/togeojson instead
npm WARN deprecated [email protected]: This module is now under the @mapbox namespace: install @mapbox/polyline instead
npm WARN deprecated [email protected]: This module is now under the @mapbox namespace: install @mapbox/corslite instead
npm WARN deprecated [email protected]: This module is now under the @mapbox namespace: install @mapbox/sexagesimal instead
npm WARN deprecated [email protected]: ð��� Thanks for using Babel: we recommend using babel-preset-env now: please read https://babeljs.io/env to update!
npm WARN deprecated [email protected]: gulp-util is deprecated - replace it, following the guidelines at https://medium.com/gulpjs/gulp-util-ca3b1f9f9ac5
npm WARN deprecated [email protected]: In 6.x, the babel package has been deprecated in favor of babel-cli. Check https://opencollective.com/babel to support the Babel maintainers
npm WARN deprecated [email protected]: Deprecated in favor of gulp-markdown.
npm WARN deprecated [email protected]: core-js@<3.0 is no longer maintained and not recommended for usage due to the number of issues. Please, upgrade your dependencies to the actual version of core-js@3.
npm WARN deprecated [email protected]: Please update to minimatch 3.0.2 or higher to avoid a RegExp DoS issue
npm WARN deprecated [email protected]: CircularJSON is in maintenance only, flatted is its successor.
npm WARN deprecated [email protected]: Please update to minimatch 3.0.2 or higher to avoid a RegExp DoS issue
npm WARN deprecated [email protected]: CoffeeScript on NPM has moved to "coffeescript" (no hyphen)
npm WARN deprecated [email protected]: Please update to minimatch 3.0.2 or higher to avoid a RegExp DoS issue
npm WARN deprecated [email protected]: please upgrade to graceful-fs 4 for compatibility with current and future versions of Node.js
npm WARN deprecated [email protected]: This module relies on Node.js's internals and will break at some point. Do not use it, and update to [email protected].
npm WARN deprecated [email protected]: please upgrade to graceful-fs 4 for compatibility with current and future versions of Node.js
npm WARN deprecated [email protected]: gulp-util is deprecated - replace it, following the guidelines at https://medium.com/gulpjs/gulp-util-ca3b1f9f9ac5
npm WARN deprecated [email protected]: Please update to minimatch 3.0.2 or higher to avoid a RegExp DoS issue
npm WARN deprecated [email protected]: connect 2.x series is deprecated
npm WARN deprecated [email protected]: Use uuid module instead
npm WARN deprecated [email protected]: This module moved to @hapi/hawk. Please make sure to switch over as this distribution is no longer supported and may contain bugs and critical security issues.
npm WARN deprecated [email protected]: This version has been deprecated in accordance with the hapi support policy (hapi.im/support). Please upgrade to the latest version to get the best features, bug fixes, and security patches. If you are unable to upgrade at this time, paid support is available for older versions (hapi.im/commercial).
npm WARN deprecated [email protected]: This module moved to @hapi/sntp. Please make sure to switch over as this distribution is no longer supported and may contain bugs and critical security issues.
npm WARN deprecated [email protected]: This version has been deprecated in accordance with the hapi support policy (hapi.im/support). Please upgrade to the latest version to get the best features, bug fixes, and security patches. If you are unable to upgrade at this time, paid support is available for older versions (hapi.im/commercial).

Please fix dependencies.

general key/value support in hover events

On one of the maps someone wanted to be able to include supplemental data, such as a link to the supporting organization or maybe a reference for abuse reports.

We already expose some data from the JSON wireframe into the hover template, I think this is just taking it to next step.

There should be an optional "metadata" section in the JSON at the same level as "name", ie as a top level key in the objects under "links". This would point to an object of arbitrary key/value pairs.

{
"name": "TransPAC: Seattle to Tokyo 100GE"
"metadata": {"url": "https://internationalnetworks.iu.edu/projects/transpac/",
"logo": "https://internationalnetworks.iu.edu/files/images/TransPAC_logo_2014.png"
},
"endpoints": [....],
"path": [....]
}

These keys and their values would be exposed in the hover template as "$metadata.", so using the above as an example we could use $metadata.url and $metadata.logo.

nodes as pie charts

It would be very cool if we could color nodes as pie charts. For example number of down bgp sessions vs. up bgp sessions.

Ubuntu server installation failed

Hello, everybody.

I'm trying to install globalnoc-network-panel on Ubuntu Server 18.04, but I'm receiving the following errors:

[email protected] postinstall /var/lib/grafana/plugins/globalnoc-networkmap-panel-1.1.2/node_modules/core-js
node scripts/postinstall || echo "ignore"

module.js:549
throw err;
^

Error: Cannot find module '/var/lib/grafana/plugins/globalnoc-networkmap-panel-1.1.2/node_modules/core-js/scripts/postinstall'
at Function.Module._resolveFilename (module.js:547:15)
at Function.Module._load (module.js:474:25)
at Function.Module.runMain (module.js:693:10)
at startup (bootstrap_node.js:188:16)
at bootstrap_node.js:609:3
ignore

[email protected]
│ │ ├── UNMET PEER DEPENDENCY [email protected]

[email protected]
├── UNMET PEER DEPENDENCY eslint-plugin-react@^4.2.3

Map source JSON format

Hi, I can't seem to find anywhere what the correct format for the map source JSON should be, what each item means, which items are required, ...

Multi-scale map ( different scale for circuit vs. nodes)

right now the scale is the same for node and circuits. It would be cool if we could do separate scales for nodes and circuits as the data they are showing is probably sufficiently different that people may get confused between them

readme on the panel is empty

The readme on the panel when installed in an instance is empty. We should put some kind of readme and link to the documentation we have on github

Logical map from image url error?

Is anything different needed to switch from maps to image? every time i select use image and add a valid image url i receive:

Panel rendering error
Cannot read property 'parentNode' of undefined

and can no longer edit the panel?

do the lat long need to be changed to work with the image somehow

Thanks again

hover on far right side off page

When hovering it seems that the overlay is always placed to the bottom right of the cursor. When you mouse over something on the far right side it causes the overlay to be clipped out of the viewport.

It would be better if this was detected and moved over to the left an appropriate amount.

screen shot 2018-10-04 at 12 53 53 pm

Could I set a line width dynamically?

Hi
Usually, we use the map for a network status panel.
We can monitor the carriers, throughout, latency, etc. The node shape can identify carriers, color can be used as latency, and lines with different thicknesses can describe a throughout?

Node color

Hello team,
Thank you for good project.
I'm trying to use your map in my project and with InfluxDb and it's works fine with highlighting links, but I have some touble with highlighting Nodes. It's just not working in my project, for debuging, I have added to the code in file atlas3.js console.log (target_endpoints), and caught in web browser endpointColor: "#fc0500", it's mean that node need be colored in red. But unfortinatly color of this node still by default. Could you please help with next steps of investigation of this issue?

Coordinates not correct

Dear contributors,

I have a problem with coordinates. When given in the json they appear in different parts of the world. For example trying London coordinates (51.507407, -0.127665) they will show up at the coastline of Somalia.

API URL:
http://api.tiles.mapbox.com/v4/mapbox.satellite/{z}/{x}/{y}.png?access_token=xxxx.xxxx.xxxx

JSON:

{
  "results": [
    {
      "links": [
        {
          "endpoints": [
            {
              "name": "A: endpoint1 to endpoint3 input",
              "label": "label for endpoint"
            },
            {
              "name": "A: endpoint1 to endpoint3 output",
              "label": "label for endpoint"
            }
          ],
          "path": [
            {
              "lon": "51.507407",
              "lat": "-0.127665",
              "name": "ep1",
              "order": "1"
            },
            {
              "lon": "52.381058",
              "lat": "4.902243",
              "name": "ep3",
              "order": "2"
            }
          ],
          "name": "A: endpoint1 to endpoint3"
        }
      ],
      "endpoints": [
        {
          "lon": "51.507407",
          "lat": "-0.127665",
          "name": "endpoint1 cpu",
          "label": "endpoint1 label"
        },
        {
          "lon": "52.381058",
          "lat": "4.902243",
          "name": "endpoint2 cpu",
          "label": "endpoint2 label"
        }
      ]
    }
  ]
}

OUTPUT:
Screenshot 2020-11-23 at 13 44 18

Is there anything I'm doing wrong?

Thank you in advance.

map 自动读取json文件,刷新页面后数据不丢失

我想要自动读取json文件,不要手动配置。做法如下:在atlas.js中给定本地json的路径,利用ajax读取json内容,将json内容传给ctrl.panel.mapSrc[j]后可以显示节点信息,但是整个页面刷新之后数据没了。
问题:如何在不点击右上角的Save dashboard情况下,自动保存我们的地图数据,刷新页面不影响???源码怎么去改???
我的json文件如下:急急急!!!!
{
"results": [
{
"links": [

    {
      "path": [
        {
          "lon": "120.291547",
          "order": "1",
          "lat": "31.926044"
        },
        {
          "lon": "119.725848",
          "order": "2",
          "lat": "31.501712"
        }
      ],
      "name": "Link Name"
    },
    {
      "path": [
        {
          "lon": "120.291547",
          "order": "3",
          "lat": "31.926044"
        },
        {
          "lon": "120.304573",
          "order": "3",
          "lat": "31.686696"
        }
      ]
    }
  ],
  "endpoints": [
    {
      "pop_id": "jp",
      "lon": "120.291547",
      "real_lon": null,
      "real_lat": null,
      "name": "endpoint1",
      "lat": "31.926044"
    },
    {
      "pop_id": "usa",
      "lon": "120.304573",
      "real_lon": null,
      "real_lat": null,
      "name": "endpoint2",
      "lat": "31.686696"
    },
    {
      "pop_id": "ch",
      "lon": "120.318559",
      "real_lon": null,
      "real_lat": null,
      "name": "endpoint3",
      "lat": "31.498764"
    },
    {
      "pop_id": "yx",
      "lon": "119.725848",
      "real_lon": null,
      "real_lat": null,
      "name": "endpoint4",
      "lat": "31.501712"
    }
  ]
}

]
}

SQL Example

Hi,

I was wondering if there was an easy way to query data from a SQL Database (Postgres in my case), format data as expected by your plugin and display those data on the map.

I didn't find any example or mention that it is possible.

I have to use SQL, and it'd be better if I could use your plugin without touching the code.

Thanks.

twin tube support

One common request from people has been for what we called twin tubes. This is 2 parallel lines that show each direction of traffic.

Show "current" values in info div

When I mouseover a link, the popup shows avg, max, min, and sum. I'd also like to see the current (last) value, or at least be able to make a custom tooltip that shows it.

(Also, in the documentation about custom tooltips, could you list the kinds of variables you can use? A couple can be seen in the screenshots. It'd also be useful to be able to see the default html so I can easily just modify it.)

different shapes for nodes

Would be very cool to allow people to specify the node shape in the wireframe. This would include size, so we could draw different nodes as different shapes.

If 2 points have the same latitude, the shape and label of one won't show up.

I noticed that if I have 2 endpoints with the same lat (but different lon's), the shape and label of one of the disappears. Sree noticed the same thing and tracked it down to this line:

return obj.lat === ep.lat;

Both lat and lon should be checked together, rather than just lat.

Not a big deal since the lat's can made slightly different, but it's confusing when you run into it and don't know why your point is not showing up.

Recommend Projects

  • React photo React

    A declarative, efficient, and flexible JavaScript library for building user interfaces.

  • Vue.js photo Vue.js

    🖖 Vue.js is a progressive, incrementally-adoptable JavaScript framework for building UI on the web.

  • Typescript photo Typescript

    TypeScript is a superset of JavaScript that compiles to clean JavaScript output.

  • TensorFlow photo TensorFlow

    An Open Source Machine Learning Framework for Everyone

  • Django photo Django

    The Web framework for perfectionists with deadlines.

  • D3 photo D3

    Bring data to life with SVG, Canvas and HTML. 📊📈🎉

Recommend Topics

  • javascript

    JavaScript (JS) is a lightweight interpreted programming language with first-class functions.

  • web

    Some thing interesting about web. New door for the world.

  • server

    A server is a program made to process requests and deliver data to clients.

  • Machine learning

    Machine learning is a way of modeling and interpreting data that allows a piece of software to respond intelligently.

  • Game

    Some thing interesting about game, make everyone happy.

Recommend Org

  • Facebook photo Facebook

    We are working to build community through open source technology. NB: members must have two-factor auth.

  • Microsoft photo Microsoft

    Open source projects and samples from Microsoft.

  • Google photo Google

    Google ❤️ Open Source for everyone.

  • D3 photo D3

    Data-Driven Documents codes.