Git Product home page Git Product logo

ghislainv / riskmapjnr Goto Github PK

View Code? Open in Web Editor NEW
24.0 7.0 7.0 111.95 MB

๐Ÿ“ฆ๐Ÿ Mapping deforestation risk following JNR methodology

Home Page: https://ecology.ghislainv.fr/riskmapjnr

License: GNU General Public License v3.0

QML 6.50% Python 56.08% Makefile 0.34% CSS 0.06% Shell 0.22% TeX 34.67% Emacs Lisp 2.13%
deforestation-risk jurisdictional-and-nested-redd verified-carbon-standard co2-emissions climate-change-mitigation forest-conservation

riskmapjnr's Introduction

Logo riskmapjnr

riskmapjnr Python package

Python version PyPI version GitHub Actions License GPLv3 Zenodo

Overview

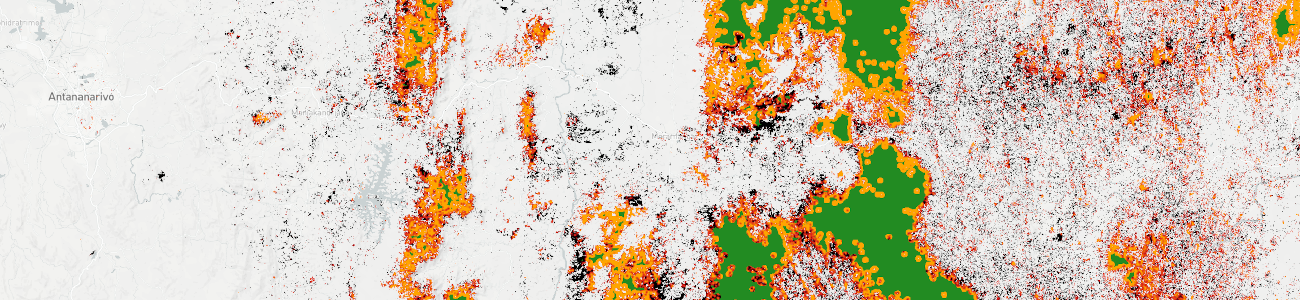
The riskmapjnr Python package can be used to obtain maps of the spatial risk of deforestation and forest degradation following the methodology developed in the context of the Jurisdictional and Nested REDD+ (JNR) and using only a forest cover change map as input.

riskmapjnr-example

Statement of Need

The VCS (Verified Carbon Standard) program allows certified projects to turn their greenhouse gas (GHG) emission reductions and removals into tradable carbon credits. Since its launch in 2006, the VCS program has grown into the world's largest voluntary GHG program.

In the forest sector, programs to mitigate GHG emissions across entire national or subnational jurisdictions (called REDD+ programs, i.e. programs aiming at Reducing Emissions from Deforestation and Forest Degradation) can be accounted for and credited using a jurisdictional-scale framework, the Jurisdictional and Nested REDD+ (JNR) framework. JNR integrates government-led and project-level REDD+ activities and establishes a clear pathway for subnational- and project-level activities to be incorporated within broader REDD+ programs. The JNR framework ensures all projects and other reducing emissions from deforestation and degradation activities in a given jurisdiction are developed using consistent baselines and crediting approaches. They mitigate the risk of "leakage", i.e. the displacement of emission-causing activities to areas outside the project boundary, by monitoring emissions across an entire jurisdictional area.

The JNR Risk Mapping Tool is a "benchmark" methodology that provides a standardized approach for developing deforestation and forest degradation risk maps for users of the JNR Allocation Tool in the context of Jurisdictional and Nested REDD+ (JNR) requirements. The methodology allows deriving a map of the deforestation (or degradation) risk based on a minimal spatial information provided by the past deforestation (or degradation) map at the jurisdictional scale.

The JNR Risk Mapping Tool allows the creation of categorical and spatially static maps whose categories represent different levels of risk of deforestation or forest degradation in the validity period of the Forest Reference Emissions Level (FREL) and throughout the jurisdictional geographical boundaries. In the JNR Allocation Tool, the level of risk determines how the jurisdictional FREL is spatially distributed to nested lower-level jurisdictional programs and projects.

While the JNR Risk Mapping Tool methodology favors simplicity, obtaining the risk map is not straightforward. The approach requires several geoprocessing steps on raster data that can be large, i.e. covering large spatial extent (eg. national scale) at high spatial resolution (eg. 30 m). The riskmapjnr Python package includes functions to perform these geoprocessing steps and derive a risk map on any jurisdiction and at any spatial resolution following the JNR Risk Mapping Tool methodology.

Installation

You will need several dependencies to run the riskmapjnr Python package. The best way to install the package is to create a Python virtual environment, either through conda (recommended) or virtualenv.

Using conda (recommended)

You first need to have miniconda3 installed (see here).

Then, create a conda environment (details here) and install the riskmapjnr package with the following commands:

conda create --name conda-rmj -c conda-forge python=3 gdal numpy matplotlib pandas pip scipy --yes
conda activate conda-rmj
pip install riskmapjnr # For PyPI version
# pip install https://github.com/ghislainv/riskmapjnr/archive/master.zip # For GitHub dev version
# conda install -c conda-forge sphinx flake8 jedi jupyter geopandas descartes folium --yes  # Optional additional packages

To deactivate and delete the conda environment:

conda deactivate
conda env remove --name conda-rmj

Using virtualenv

You first need to have the virtualenv package installed (see here).

Then, create a virtual environment and install the riskmapjnr package with the following commands:

cd ~
mkdir venvs # Directory for virtual environments
cd venvs
virtualenv --python=/usr/bin/python3 venv-rmj
source ~/venvs/venv-rmj/bin/activate
# Install numpy first
pip install numpy
# Install gdal (the correct version)
pip install --global-option=build_ext --global-option="-I/usr/include/gdal" gdal==$(gdal-config --version)
pip install riskmapjnr # For PyPI version, this will install all other dependencies
# pip install https://github.com/ghislainv/riskmapjnr/archive/master.zip # For GitHub dev version
# pip install sphinx flake8 jedi jupyter geopandas descartes folium # Optional additional packages

To deactivate and delete the virtual environment:

deactivate
rm -R ~/venvs/venv-rmj # Just remove the repository

Installation testing

You can test that the package has been correctly installed using the command riskmapjnr in a terminal:

riskmapjnr

This should return a short description of the riskmapjnr package and the version number:

# riskmapjnr: Map of deforestation risk following JNR methodology.
# https://ecology.ghislainv.fr/riskmapjnr/
# riskmapjnr version x.x.

You can also test the package executing the commands in the Get started tutorial.

Main functionalities

The riskmapjnr package includes functions to:

  1. Estimate the distance to forest edge beyond which the deforestation risk is negligible: dist_edge_threshold().
  2. Compute local deforestation rates using a moving window whose size can vary: local_defor_rate().
  3. Transform local deforestation rates into categories of deforestation risks using several slicing algorithms: set_defor_cat_zero() and defor_cat()
  4. Validate maps of deforestation risk and select the map with the higher accuracy: defrate_per_cat() and validation().

The riskmapjnr package uses several known Python scientific packages such as NumPy, SciPy, and Pandas for fast matrix and vector operations and gdal for processing georeferenced raster data. Raster data are divided into blocks of data for in-memory processing. Such an approach allow processing large raster files with large geographical extents (e.g. country scale) and high spatial resolutions (eg. 30 m).

Contributing

The riskmapjnr Python package is Open Source and released under the GNU GPL version 3 license. Anybody who is interested can contribute to the package development following our Community guidelines. Every contributor must agree to follow the project's Code of conduct.

riskmapjnr's People

Contributors

12rambau avatar ghislainv avatar

Stargazers

 avatar  avatar  avatar  avatar  avatar  avatar  avatar  avatar  avatar  avatar  avatar  avatar  avatar  avatar  avatar  avatar  avatar  avatar  avatar  avatar  avatar  avatar  avatar  avatar

Watchers

 avatar  avatar  avatar  avatar  avatar  avatar  avatar

riskmapjnr's Issues

AttributeError: module 'numpy' has no attribute 'int'

I am getting an error while running the makemap function of the package. Here are the details:

Model calibration and validation
.. Model 0: window size = 5, slicing method = ei.

AttributeError Traceback (most recent call last)
in <cell line: 1>()
----> 1 results_makemap = rmj.makemap(
2 fcc_file=output_raster_path,
3 time_interval=[3, 3],
4 output_dir=out_dir,
5 clean=False,

4 frames
/usr/local/lib/python3.10/dist-packages/riskmapjnr/makemap.py in makemap(fcc_file, time_interval, output_dir, clean, dist_bins, win_sizes, ncat, methods, csize, no_quantity_error, parallel, ncpu, figsize, dpi, blk_rows, verbose)
411 for i in range(n_ws):
412 s = win_sizes[i]
--> 413 ii, wRMSE_list, ncell, csize_km = makemap_ws(
414 i, s, fcc_file, time_interval,
415 dist_file, dist_v_file,

/usr/local/lib/python3.10/dist-packages/riskmapjnr/makemap.py in makemap_ws(i, win_size, fcc_file, time_interval, dist_file, dist_v_file, dist_edge_thresh, calval_dir, ncat, methods, meth, n_m, csize, nqe, figsize, dpi, blk_rows, verbose)
115 verbose=False)
116 # Validation
--> 117 val = validation(
118 fcc_file=fcc_file,
119 time_interval=time_interval[1],

/usr/local/lib/python3.10/dist-packages/riskmapjnr/validation.py in validation(fcc_file, time_interval, riskmap_file, tab_file_defrate, csize, no_quantity_error, tab_file_pred, fig_file_pred, figsize, dpi, verbose)
111
112 # Make square
--> 113 squareinfo = make_square(fcc_file, csize)
114 nsquare = squareinfo[0]
115 nsquare_x = squareinfo[1]

/usr/local/lib/python3.10/dist-packages/riskmapjnr/misc/miscellaneous.py in make_square(rasterfile, square_size)
145 nsquare = nsquare_x * nsquare_y
146 # Upper-left coordinates of each square
--> 147 x = np.arange(0, ncol, square_size, dtype=np.int).tolist()
148 y = np.arange(0, nrow, square_size, dtype=np.int).tolist()
149 # Size (number of col and row) of each square

/usr/local/lib/python3.10/dist-packages/numpy/init.py in getattr(attr)
317
318 if attr in former_attrs:
--> 319 raise AttributeError(former_attrs[attr])
320
321 if attr == 'testing':

AttributeError: module 'numpy' has no attribute 'int'.
np.int was a deprecated alias for the builtin int. To avoid this error in existing code, use int by itself. Doing this will not modify any behavior and is safe. When replacing np.int, you may wish to use e.g. np.int64 or np.int32 to specify the precision. If you wish to review your current use, check the release note link for additional information.
The aliases was originally deprecated in NumPy 1.20; for more details and guidance see the original release note at:
https://numpy.org/devdocs/release/1.20.0-notes.html#deprecations

riskmapjnr display issue

I have installed the riskmap package as per the procedure.
However, I am getting following message when setting a virtual environment

(conda-rmj) C:\Users\Asdfhg>riskmapjnr
no display found. Using non-interactive Agg backend

riskmapjnr: Map of deforestation risk following JNR methodology.

https://ecology.ghislainv.fr/riskmapjnr

riskmapjnr version 0.2.

The above message is not allowing the tool to function properly, is there any help that I can get on this particular issue. I am a intermediate user of python.

Thank you

pool is never joined

when run in parralel, Pool's async-methods return objects which are conceptually "explicit futures", you need to call .get() to await and receive the actual result which is exactly what you did. On the other hand, before going any further in your code you also need to close and join the pool. Which is not done here:

res = pool.starmap_async(makemap_ws, args).get()

A call to the method in a script will execute next command before all the runners have finished:

results_makemap = rmj.makemap(**kwargs)

# add the results in the textfields 
ws_hat = results_makemap["ws_hat"]
m_hat = results_makemap["m_hat"]
dist_thresh = results_makemap["dist_thresh"]

will return:

UnboundLocalError: local variable 'results_makemap' referenced before assignment

Is there other places where you used this method ? Happy to make a PR

note

It's invisible in notebooks as tornado is making sure every promise is closed before finishing cell computation.

Error version 1.2.1 defrate_per_cat

In function makemap_ws defrate_per_cat contains the key defor_values , while in the function does not exist see functions bellow:

makemap_ws :
defrate_per_cat(
fcc_file,
defor_values=1,
riskmap_file=riskmap_file,
time_interval=time_interval[0],
tab_file_defrate=tab_file_defrate,
blk_rows=blk_rows,
verbose=False)

defrate_per_cat(fcc_file, riskmap_file, time_interval,
period="calibration",
tab_file_defrate="defrate_per_cat.csv",
blk_rows=128, verbose=True):

don't manage to run the lib on a FCC derived from GEE

details

Hi @ghislainv,

I'm trying to run the riskmapjnr in a module. before building up the interface I would like to create a running notebook using some GEE based map for the forest cover change (namely TMF and hansen&al. This is the current stage of dev: https://github.com/12rambau/riskmapjnr/blob/main/riskmapjnr.ipynb

when I try to run it on SEPAL I get some small deprecation error (not very important at the moment) but I get a strange error when running rmj.makemap:

File ~/.local/lib/python3.8/site-packages/riskmapjnr/dist_edge_threshold.py:226, in dist_edge_threshold(fcc_file, defor_values, dist_file, dist_bins, tab_file_dist, fig_file_dist, figsize, dpi, blk_rows, verbose)
    222 res_df.to_csv(tab_file_dist, sep=",", header=True,
    223               index=False, index_label=False)
    225 # Distance and percentage for 99% threshold
--> 226 index_thresh = np.nonzero(res_df["perc"].values > 99)[0][0]
    227 dist_thresh = res_df.loc[index_thresh, "distance"]
    228 perc_thresh = np.around(res_df.loc[index_thresh, "perc"], 2)

IndexError: index 0 is out of bounds for axis 0 with size 0

Could you simply try to run my notebook from your side and let me know if you get the same error ? (I tried on your favorite AOI: guadeloupe). I think you just need to install sepal-ui.

Side note

I extracted the GADM interface from sepal-ui and created a small lib out of it. As you run many things out of GEE, you might be interested to get administrative geometries on the fly as a geodataframe:

https://pygadm.readthedocs.io/en/stable/

makemap is shutting down the interactive backend when launched in SEPAL

still in the same example (https://github.com/12rambau/riskmapjnr/blob/main/riskmapjnr.ipynb) I get a weird behavior from matplotlib.

In the first cells everything goes as expected but after a call to makemap I get the following warning:

No display found. Using non-interactive Agg backend.

Which of course prevents any display of matplotlib results downstream. I assume it's due to the SEPAL environment but I'm curious where do you use matplotlib in the computation steps ?

Recommend Projects

  • React photo React

    A declarative, efficient, and flexible JavaScript library for building user interfaces.

  • Vue.js photo Vue.js

    ๐Ÿ–– Vue.js is a progressive, incrementally-adoptable JavaScript framework for building UI on the web.

  • Typescript photo Typescript

    TypeScript is a superset of JavaScript that compiles to clean JavaScript output.

  • TensorFlow photo TensorFlow

    An Open Source Machine Learning Framework for Everyone

  • Django photo Django

    The Web framework for perfectionists with deadlines.

  • D3 photo D3

    Bring data to life with SVG, Canvas and HTML. ๐Ÿ“Š๐Ÿ“ˆ๐ŸŽ‰

Recommend Topics

  • javascript

    JavaScript (JS) is a lightweight interpreted programming language with first-class functions.

  • web

    Some thing interesting about web. New door for the world.

  • server

    A server is a program made to process requests and deliver data to clients.

  • Machine learning

    Machine learning is a way of modeling and interpreting data that allows a piece of software to respond intelligently.

  • Game

    Some thing interesting about game, make everyone happy.

Recommend Org

  • Facebook photo Facebook

    We are working to build community through open source technology. NB: members must have two-factor auth.

  • Microsoft photo Microsoft

    Open source projects and samples from Microsoft.

  • Google photo Google

    Google โค๏ธ Open Source for everyone.

  • D3 photo D3

    Data-Driven Documents codes.