Git Product home page Git Product logo

geoscienceaustralia / dea-notebooks Goto Github PK

View Code? Open in Web Editor NEW
442.0 59.0 128.0 3.24 GB

Repository for Digital Earth Australia Jupyter Notebooks: tools and workflows for geospatial analysis with Open Data Cube and Xarray

Home Page: https://docs.dea.ga.gov.au/notebooks/

License: Apache License 2.0

Jupyter Notebook 99.76% Python 0.23% Shell 0.01%
digitalearthaustralia opendatacube geoscienceaustralia jupyter-notebook python xarray earthobservation remotesensing documentation earth-observation remote-sensing geospatial-data satellite-imagery landsat sentinel-2

dea-notebooks's Introduction

Digital Earth Australia logo

DEA Notebooks

DOI Apache license PyPI Notebook testing Discord


This is the DEA Notebooks and DEA Tools repository of Digital Earth Australia. These can be viewed on the DEA Knowledge Hub or run on the DEA Sandbox or the National Computational Infrastructure (NCI).

Contribute — DEA Notebooks is open-source and we would love your contribution! Learn how to contribute below.

License — The code in this repository is licensed under the Apache License, Version 2.0. DEA data is licensed under the Creative Commons by Attribution 4.0 license.

Documentation — See the DEA Notebooks Wiki.

Contact — For assistance with any of these notebooks and tools, please ask a question on our Open Data Cube Discord chat or on the GIS Stack Exchange using the open-data-cube tag. You can also report an issue on this repository.

Citation — If you use this repository in your work, please reference it with the following citation.

Krause, C., Dunn, B., Bishop-Taylor, R., Adams, C., Burton, C., Alger, M., Chua, S., Phillips, C., Newey, V., Kouzoubov, K., Leith, A., Ayers, D., Hicks, A., DEA Notebooks contributors 2021. Digital Earth Australia notebooks and tools repository. Geoscience Australia, Canberra. https://doi.org/10.26186/145234

Introduction

The Jupyter Notebooks and Python tools in this repository are for analysing DEA's satellite data products. The notebooks are designed to demonstrate how to use the DEA data and tools to conduct a broad range of geospatial analyses. They also demonstrate how to integrate with other open-source software such as Open Data Cube and xarray. You can see examples of use cases on the USAGE page.

View on the DEA Knowledge Hub

The DEA Knowledge Hub is where you can easily view the notebooks and read DEA Tools documentation. You can browse the following sections.

  • Beginner’s guide — Introductory notebooks aimed at introducing Jupyter Notebooks and how to load, plot, and interact with DEA data.
  • DEA products — Notebooks introducing DEA's satellite datasets and derived products, including how to load each dataset and any special features of the data.
  • How-to guides — A recipe book of simple code examples demonstrating how to perform common geospatial analysis tasks using DEA and open-source software.
  • Interactive apps — Interactive apps and widgets that require little or no coding to run.
  • Real-world examples — More complex case study workflows demonstrating how DEA can be used to address real-world problems.
  • DEA Tools Package — An open-source Python package containing functions and algorithms to assist in analysing DEA data.

Run on the DEA Sandbox

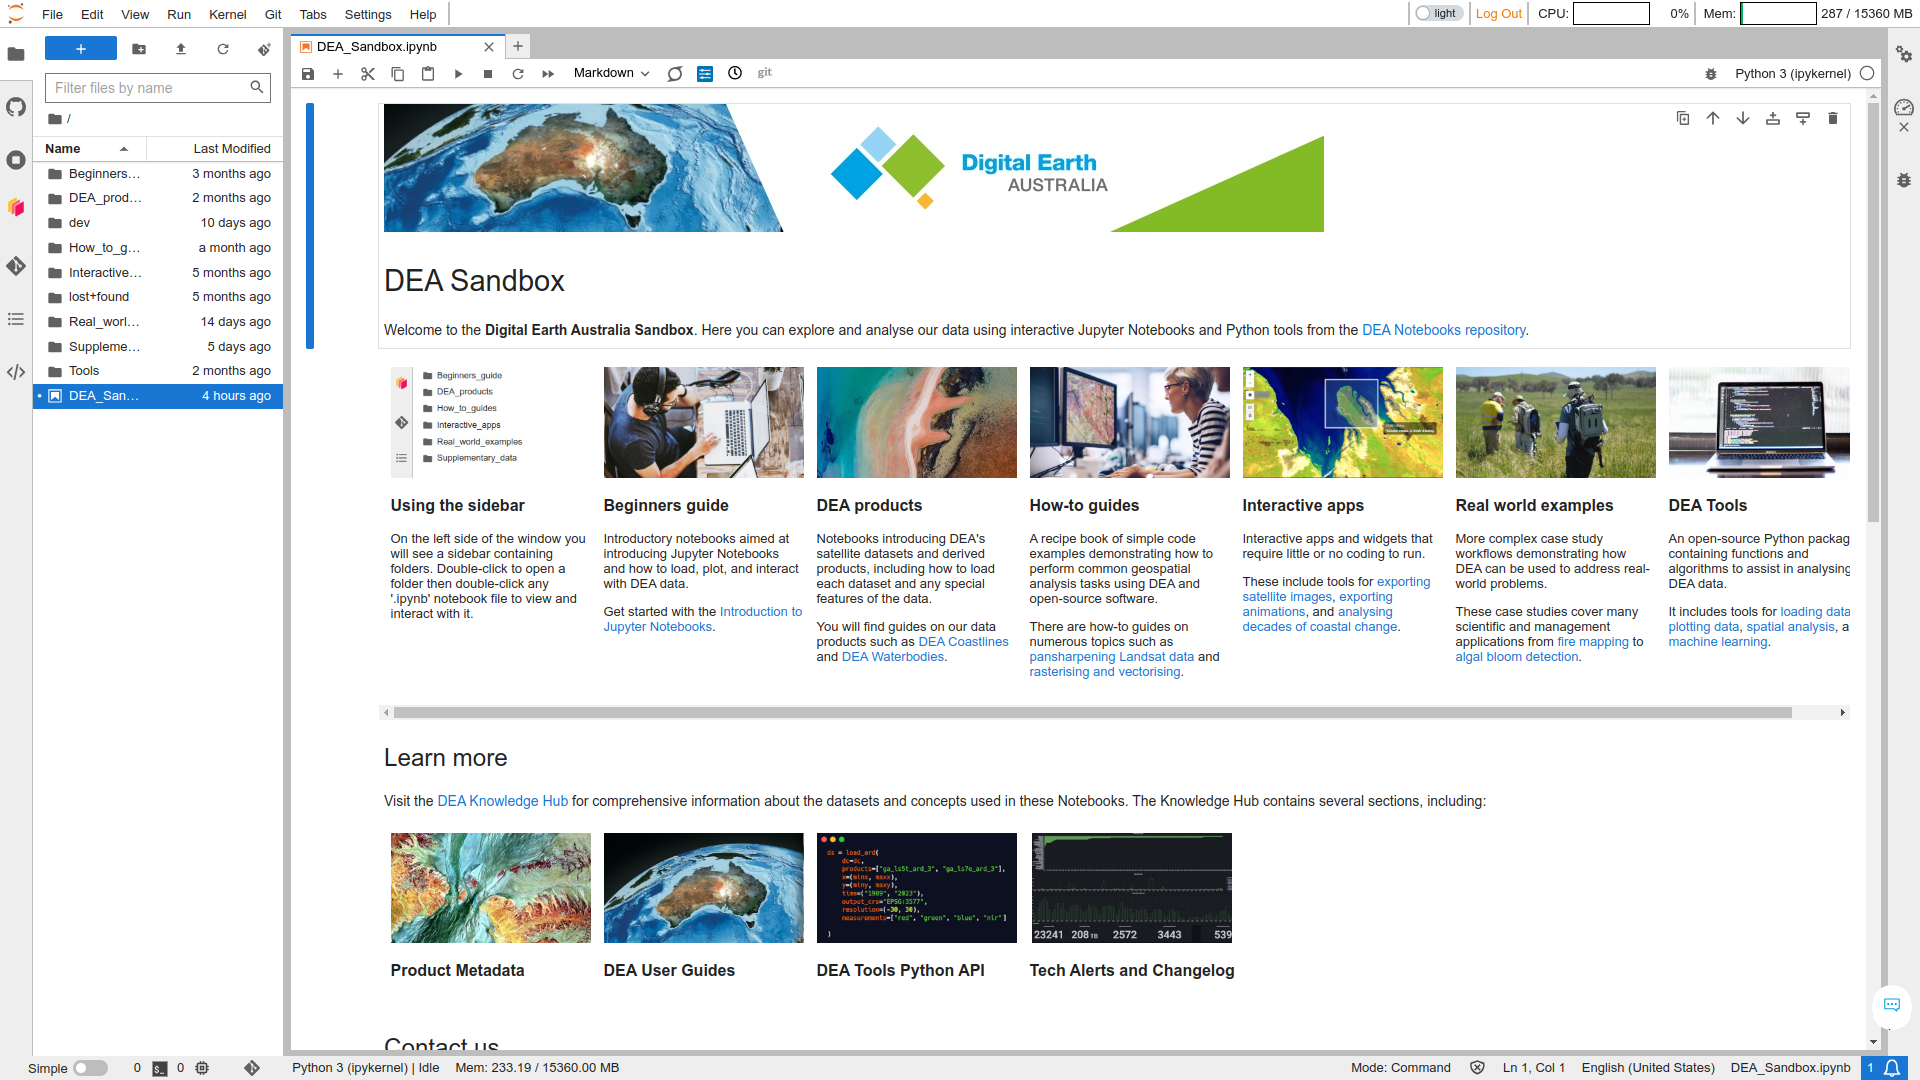
The DEA Sandbox is a free virtual environment for interacting with the notebooks and tools from your web browser. You can use the Sandbox to conduct geospatial analysis without installing anything on your computer. Learn how to use the DEA Sandbox.

The cover page of the DEA Sandbox.

Run on the NCI

The National Computational Infrastructure is a supercomputer environment available to Australian researchers, academics, and other users by negotiation. The NCI can be used for high-performance geospatial analysis. Learn how to use the NCI.

How to contribute

To get started, see these articles in the wiki.

We would also appreciate it if you could add your a citation to our USAGE page.

dea-notebooks's People

Contributors

alexgleith avatar andrewdhicks avatar asivapra avatar bellemae avatar benji-glitsos-ga avatar bexdunn avatar caitlinadams avatar cbur24 avatar cekrause avatar emmaai avatar erialc-p avatar gabzgit avatar geoscience-aman avatar gypsybojangles avatar jm-ga avatar katedugdale avatar kirill888 avatar kooie-cate avatar laurenschenk1 avatar matt-dea avatar matthewja avatar omad avatar pindge avatar pkilgour avatar richardscottoz avatar robbibt avatar s-m-t-c avatar sebfoe avatar tebadi avatar uchchwhash avatar

Stargazers

 avatar  avatar  avatar  avatar  avatar  avatar  avatar  avatar  avatar  avatar  avatar  avatar  avatar  avatar  avatar  avatar  avatar  avatar  avatar  avatar  avatar  avatar  avatar  avatar  avatar  avatar  avatar  avatar  avatar  avatar  avatar  avatar  avatar  avatar  avatar  avatar  avatar  avatar  avatar  avatar  avatar  avatar  avatar  avatar  avatar  avatar  avatar  avatar  avatar  avatar  avatar  avatar  avatar  avatar  avatar  avatar  avatar  avatar  avatar  avatar  avatar  avatar  avatar  avatar  avatar  avatar  avatar  avatar  avatar  avatar  avatar  avatar  avatar  avatar  avatar  avatar  avatar  avatar  avatar  avatar  avatar  avatar  avatar  avatar  avatar  avatar  avatar  avatar  avatar  avatar  avatar  avatar  avatar  avatar  avatar  avatar  avatar  avatar  avatar  avatar

Watchers

 avatar  avatar  avatar  avatar  avatar  avatar  avatar  avatar  avatar  avatar  avatar  avatar  avatar  avatar  avatar  avatar  avatar  avatar  avatar  avatar  avatar  avatar  avatar  avatar  avatar  avatar  avatar  avatar  avatar  avatar  avatar  avatar  avatar  avatar  avatar  avatar  avatar  avatar  avatar  avatar  avatar  avatar  avatar  avatar  avatar  avatar  avatar  avatar  avatar  avatar  avatar  avatar  avatar  avatar  avatar  avatar  avatar  avatar  avatar

dea-notebooks's Issues

uncomment zonal_timeseries

Please uncomment the zonal_timseries function once the rasterstats package has been added to the DEA-prod module

PolygonDrill path incorrect

In the first cell the path is:

sys.path.append(os.path.expanduser('~/dea-notebooks/10_Scripts'))

which doesn't work.

I have used:

sys.path.append('../10_Scripts/')

which does work.

Better organisation for loose images in dea-notebooks/DEA_datasets

The new Landsat notebooks come with some extra local images that are currently located at dea-notebooks/DEA_datasets. I can see that some of these "GettingStarted..." notebooks might need local files like this, but I think we might want to organise them a bit better. Perhaps they could all be stored in a folder in that directory? Something like:

dea-notebooks/DEA_datasets/images

@asivapra @CEKrause

Intro to Landsat webpage changes

http://geoscienceaustralia.github.io/digitalearthau/notebooks/DEA_datasets/Introduction_to_Landsat.html

The abbreviation "SR" is introduced in the NBAR-T section, but it is not defined (presumably 'surface reflectance'). SR can be defined on the first line of the document.

In the first notebook input cell (In [1]:), it says "Import dea-notebook functions. This assumes you are running this notebook from inside the dea-notebooks directory. If not, replace the relative ../Scripts link with a path to the dea-notebooks/Scripts directory.

It is not clear how to find the dea-notebooks/Scripts directory. I just tried it with a notebook started using the DEA desktop icon and it still didn't work. So an explanation of starting a notebook from a subdirectory inside a cloned version of dea-notebooks on GitHub is needed.

In the section "Creating a true-colour image using three bands", it is somewhat confusing to talk about making a true colour plot and then having a flag "contrast_enhance=True" that results in a "colour-enhanced image". It's not clear which one is the true colour image (with flag True or False?). Maybe clarifying this will help the user understand what's happening better?

missing step in docs for tags

For tags, you need to select 'Cell Type --> Raw NBConvert
Before you can select Raw NBConvert Format --> reST on the dropdown box that appears on the top right hand side of the cell.

Will do a pull request but this issue is for anyone else that runs into it before I have time to fix/ if anyone gets to it first that's also good :)
Bex

image

Referencing in dea-notebooks

Further to discussions today about making sure we reference any direct quotes from previously published material:

I've added a section in dea-notebooks documentation with a link to the GA referencing guide.

We need to please caption and reference any images used that have been previously published elsewhere.

For document references,
I've decided to include an internal and and external link for the first reference to any externally published content, followed by internal links for further references. These internal links go to a references cell at the end of the notebook, where references are formatted according to the GA style guide (now linked to in the dea notebooks getting started guide, or at http://www.ga.gov.au/copyright/how-to-cite-geoscience-australia-source-of-information )

Thoughts on this are requested - maybe there is a better way? I know it's hard to use internal links on github, but the external links work really well.

This is necessary if you have notebooks that consistently use directly copied and pasted information from elsewhere. Please don't use anything copied-and-pasted without enclosing it in quotes and referencing, as per usual scientific publication standards, particularly as these GA- published notebooks are within GeoscienceAustralia's repository and visible to external collaborators.

If you are able to, you can paraphrase external sources but please include a reference if you do so.

Please can we check any published notebooks for these issues.

Regards,
Bex

Pixel Drill With Widgets path incorrect

In the first cell the path is:

sys.path.append(os.path.expanduser('~/dea-notebooks/10_Scripts'))

which doesn't work.

I have used:

sys.path.append('../10_Scripts/')

which does work.

Bug in `load_clear` functions in DEADatahandling

If you set the output CRS to WGS84 when passing a query to the load_clear functions within DEADatahandling an error occurs in the calculation of data_perc as the x and y dimensions are returned as longitude and latitude and this breaks the line:
data_perc = good_quality.sum(dim=['x', 'y']) / (good_quality.shape[1] * good_quality.shape[2])

A change to make this dimension title agnostic should solve the problem.
eg. data_perc = good_quality.sum(axis=1).sum(axis=1) / (good_quality.shape[1] * good_quality.shape[2])

Something to implement after we return from break.

animated time series function cannot accept dimensions named other than x or y

The function :

DEAPlotting.animated_timeseries

requires the dimensions of the input xarray are called x and y when calculating the width ratio:

width_ratio = float(ds.sizes['x']) / float(ds.sizes['y'])

Not essential but would be good to allow for longitude / latitude, lon(g) / lat. More broadly this is an issue I find semi-regularly with functions and libraries related to spatial data so good to keep an eye out for.
@robbibt

multi-timestep masking - put this in a function somewhere

Use the following code from this notebook to update the Temporal analysis notebook / Scripts in order to add a function for multi- timestep polygon drill/masking

GWDEA_working/Development_Notebooks/TCW_WOfS_FC_stacked_plot_polygon_drill.ipynb#

import rasterio.mask
import rasterio.features

data = ls578_ds
mask = rasterio.features.geometry_mask([geom.to_crs(data.geobox.crs)for geoms in [geom]],
                                           out_shape=data.geobox.shape,
                                           transform=data.geobox.affine,
                                           all_touched=False,
                                           invert=False)
#for some reason xarray is not playing nicely with our old masking function
mask_xr = xr.DataArray(mask, dims = ('y','x'))
dataMasked = data.where(mask_xr==False)

Top level heading used as the title in the table of contents

On the folder listing page, any top level heading is pulled in, making it hard to distinguish between notebooks.
E.g. for Products: http://geoscienceaustralia.github.io/digitalearthau/notebooks/products/README.html
There are 2 notebooks:

  • Getting started with Sentinel 2 data
  • View Landsat 8 imagery for a chosen time period

but many headings are pulled in. If we can add another # to the other headings, they can still be used in the sidebar to navigate within the notebook:
http://geoscienceaustralia.github.io/digitalearthau/notebooks/products/GettingStartedWithSentinel2.html#See-what-Sentinel-2-products-are-currently-available

Need to add -999 as nodata for NBAR in GettingStartedWithLandsat5-7-8 notebook

The GettingStartedWithLandsat5-7-8.ipynb notebook currently includes "Note that the NBAR-T data inserts a missing value (-999) into the dataset to denote a terrain shadow. This should be converted to a NaN value before using this data to avoid treating it as a valid value."

However, NBAR also includes -999 values for nodata. This should be covered both in the dataset description and in the actual code examples.

Issue with bands_of_interest in load_nbarx

@CEKrause @BexDunn I've had some issues with the bands_of_interest parameter in load_nbarx: any time I try to specify a set of bands, the function crashes out with a key error KeyError: 'bands_of_interest'. It works fine when no bands are specified.

I think this is because the function wants bands_of_interest given to it as a **kwarg, which only works when expanding dictionaries. I was thinking I might edit the function to define bands_of_interest as a simple variable like this:

load_nbarx(dc, sensor, query, bands_of_interest, product = 'nbart', filter_cloud = True)

...but this will definitely break people's code if the current function works for them. Would anyone strongly object if I made this change? (just opening this up for discussion because it's probably the single most-used function in the repository at this stage)

Interactive_phenology_plot_tagged concatenate issue

"nbar_clean = xr.concat(sensor_clean.values(),dim='time')" returns the following error:

ValueError: The truth value of an array with more than one element is ambiguous. Use a.any() or a.all()

It is possible due to the use of a different version of xarray module.

Bug in Sentinel pq filtering in load_sentinel

If bands_of_interest are specified, then pixel_quality needs to be included, or else it will throw an error. Need to add a check that if bands are specified and filter_cloud = True, pixel quality is also grabbed.

DEADataHandling.py "write your netcdf" doco doesn't correctly reflect functionality

    This function turns an xarray dataarray into a dataset so we can write it to netcdf. 
    It adds on a crs definition from the original array. data = your xarray dataset, dataset_name 
    is a string describing your variable
    ```
Update to "dataset_name is a string chosen by you describing your dataset. This will be written to the netcdf as the name of the dataset"

Adding a list and description of Algorithm functions to readme file

One of the key issues discussed at the dea-notebooks meeting last week was the lack of a list of all functions in Algorithms.

I've created a pull request (#57) with a possible way to have some basic documentation of the growing list of functions in Algorithms: simply update the readme file with a list and basic descriptions of the functions. This could be an easy intermediate step until we work out a more automated function documentation.

I'm not sure if this will affect the existing automated .rst import, so this might be something to discuss.

(@CEKrause @andrewdhicks @BexDunn )

Scripts vs algorithms:

Hey friends,
Thoughts on creating a subfolder/an alternate folder for scripts vs algorithms? Because we have plenty of scripts to load, and they aren't necessarily notebook examples of using algorithms?
Bex

relative path name to 10_scripts

For example in first cell of Fractional Cover

Import external functions from dea-notebooks
sys.path.append('../10_Scripts/')
import DEAPlotting, DEADataHandling

code assumes clone of repo but not clear in instructions. may need update to remind user before first cell

Recommend Projects

  • React photo React

    A declarative, efficient, and flexible JavaScript library for building user interfaces.

  • Vue.js photo Vue.js

    🖖 Vue.js is a progressive, incrementally-adoptable JavaScript framework for building UI on the web.

  • Typescript photo Typescript

    TypeScript is a superset of JavaScript that compiles to clean JavaScript output.

  • TensorFlow photo TensorFlow

    An Open Source Machine Learning Framework for Everyone

  • Django photo Django

    The Web framework for perfectionists with deadlines.

  • D3 photo D3

    Bring data to life with SVG, Canvas and HTML. 📊📈🎉

Recommend Topics

  • javascript

    JavaScript (JS) is a lightweight interpreted programming language with first-class functions.

  • web

    Some thing interesting about web. New door for the world.

  • server

    A server is a program made to process requests and deliver data to clients.

  • Machine learning

    Machine learning is a way of modeling and interpreting data that allows a piece of software to respond intelligently.

  • Game

    Some thing interesting about game, make everyone happy.

Recommend Org

  • Facebook photo Facebook

    We are working to build community through open source technology. NB: members must have two-factor auth.

  • Microsoft photo Microsoft

    Open source projects and samples from Microsoft.

  • Google photo Google

    Google ❤️ Open Source for everyone.

  • D3 photo D3

    Data-Driven Documents codes.