Implementation of multivariate dissimilarity-based standard error estimates from:
Anderson, MJ and J Santanta-Garcon. 2015. "Measures of precision for dissimilarity-based multivariate
analysis of ecological communities." Ecology Letters 18(1): 66-73.
Version: 0.1.2 (2017-09-18)
Author: Jon Lefcheck ([email protected])
library(devtools)

# Functions from supplements
MSEgroup.d <- source_url("https://raw.githubusercontent.com/jslefche/multSE/master/R/MSEgroup_d.R")[[1]]

MSE.d <- source_url("https://raw.githubusercontent.com/jslefche/multSE/master/R/MSE_d.R")[[1]]

# New function using vectorization
multSE <- source_url("https://raw.githubusercontent.com/jslefche/multSE/master/R/multSE.R")[[1]]
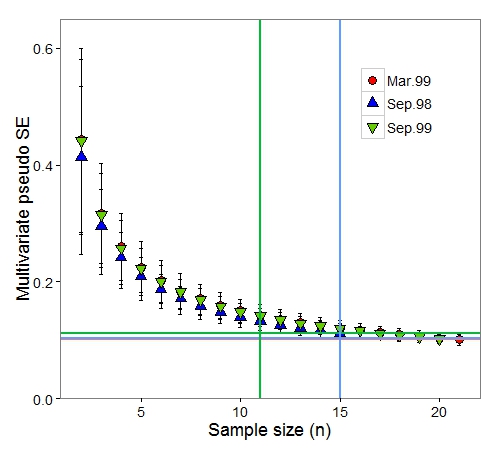
The example data represent fish survey data from Poor Knight's Island, and were collected using visual census along a 25 x 5 m transect at a depth of 8-20 m. Three time periods were sampled: September 1998 (n = 15), March 1999 (n = 21), and September 1999 (n = 20).
# Poor Knights fish survey data, from supplementary material
tf <- tempfile()

download.file("https://raw.githubusercontent.com/jslefche/multSE/master/data/PoorKnights.csv", tf)

pk <- read.csv(tf)
The function multSE takes the following inputs:
-D: a species-by-community distance matrix
-nresamp: the number of resamples to be performed
-group: a vector of grouping variables
-permanova: whether standard errors should be computed across all groups (permanova = T) or calculated separately for each group (F)
# Load vegan library
library(vegan)

# Create species-by-site distance matrix
D <- vegdist(pk[,3:49] + 1)

# Run optimized function to generate multivariate SE for each group
output <- multSE(D, group = factor(pk$Time)) #10000 resamples
And plot the output:
# Plot output
require(ggplot2)

(p <- ggplot(output, aes(x = n.samp, y = means, group = group)) +
  geom_errorbar(aes(ymax = upper.ci, ymin = lower.ci), width = 0.2) +
  geom_point(aes(shape = group, fill = group), size = 4) +
  scale_shape_manual(values = c(21, 24:25), name = "") +
  scale_fill_manual(values = c("red", "blue", "chartreuse3"), name = "") +
  coord_cartesian(ylim = c(0, 0.65)) +
  theme_bw(base_size = 18) +
  labs(x = "Sample size (n)", y = "Multivariate pseudo SE") +
  theme(legend.position = c(0.8, 0.8),
        panel.grid.major = element_blank(),
        panel.grid.minor = element_blank()) )

It appears that there is no appreciable gain in precision (i.e., decrease in SE) after about n = 15 samples, but we can quantitatively double-check this estimate using the minsamp function:
# Load function
minsamp <- source_url("https://raw.githubusercontent.com/jslefche/multSE/master/R/minsamp.R")[[1]]

# Calculate minimum sample size for each group
(minimum.sample.size <- minsamp(output, output$group))

#  group  min.mean min.lower.ci min.upper.ci min.n
# Sep.98 0.1123218   0.10133429    0.1213122    11
# Mar.99 0.1012409   0.09194648    0.1101552    15
# Sep.99 0.1026725   0.09383249    0.1097324    15

# Add to plot
p +
  geom_hline(data = minimum.sample.size, aes(yintercept = min.mean, col = group), lwd = 1) +
  geom_vline(data = minimum.sample.size, aes(xintercept = min.n, col = group), lwd = 1)
Now repeat, but integrate across groups using residuals from a PERMANOVA (instead of SS):
output2 <- multSE(D, group = factor(pk$Time), permanova = T) #10000 resamples

ggplot(output2, aes(x = n.samp, y = means)) +
  geom_errorbar(aes(ymax = upper.ci, ymin = lower.ci), width = 0.2)+
  geom_point(size = 4) +
  theme_bw(base_size = 18) +
  labs(x = "Sample size (n)", y = "Multivariate pseudo SE") +
  theme(legend.position = c(0.8, 0.8),
        panel.grid.major = element_blank(),
        panel.grid.minor = element_blank())

Similarly, there is no significant decrease in multSE after about n = 14 samples, but this is generalizable across all groups (sampling periods) in the design.
###Benchmarks vs. old function
Compare multSE to function included in the supplements of ELE paper MSEgroup.d:
# Calculate system time for old vs. new function for a variety of resample sizes
benchmarks.df <- do.call(rbind, lapply(c(10, 100, 1000, 10000), function(i)
  data.frame(
    nresamp = i,
    fn = c("old", "new"),
    time = c(system.time( MSEgroup.d(D, nresamp = i, group = factor(pk$Time)) )[3],
             system.time(multSE(D, nresamp = i, group = factor(pk$Time)) )[3] ) )
) )

# And plot
ggplot(benchmarks.df, aes(x = nresamp, y = time, group = fn, col = fn, shape = fn)) +
  geom_point(size = 10, shape = 2) +
  scale_color_manual(values = c("red", "black"), name = "") +
  labs(x = "Number of resamples", y = "System time (seconds)") +.
  theme_bw(base_size = 18) +
  theme(legend.position = c(0.2, 0.8),
        panel.grid.major = element_blank(),
        panel.grid.minor = element_blank())

As you can see, the new function multSE is much faster, particularly when the number of resamples is large.
Now repeat for permanova = T:
benchmarks.df2 <- do.call(rbind, lapply(c(10, 100, 1000, 10000), function(i)
  data.frame(
    nresamp = i,
    fn = c("old", "new"),
    time = c(system.time(MSE.d(D, nresamp = i, group = factor(pk$Time), permanova = T) )[3],
             system.time(multSE(D, nresamp = i, group = factor(pk$Time), permanova = T) )[3] ) )
) )

# And plot
ggplot(benchmarks.df2, aes(x = nresamp, y = time, group = fn, col = fn, shape = fn)) +
  geom_point(size = 10, shape = 2) +
  scale_color_manual(values = c("red", "black")) +
  labs(x = "Number of resamples", y = "System time (seconds)") +
  theme_bw(base_size = 18) +
  theme(legend.position = "none",
        panel.grid.major = element_blank(),
        panel.grid.minor = element_blank())

Again, multSE is much faster, although not by as large a margin when using the SS-based calculation.