GARY WHEELER
MAIA NGO
You have made it half way through the course work!
The goal of this project is to test your ability to gather information from a real-world database and use your knowledge of statistical analysis and hypothesis testing to generate analytical insights that are valuable.
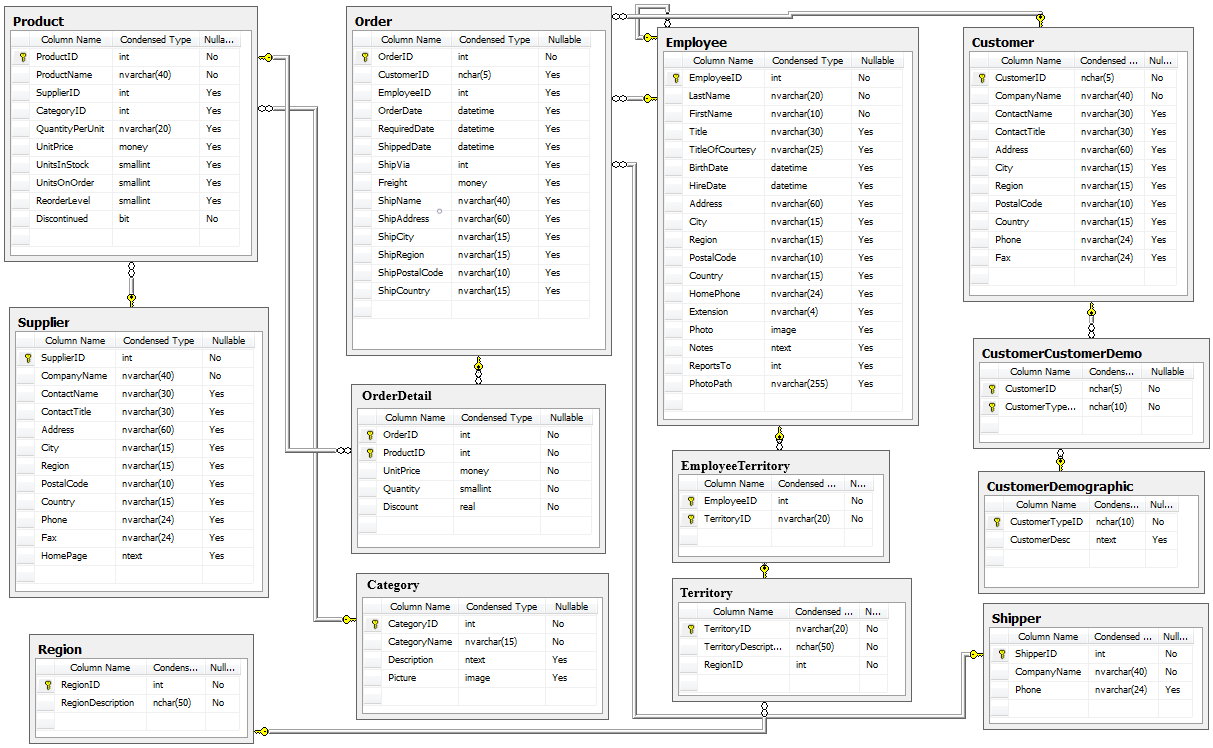
- For this project, you may work with the Northwind database--a free, open-source dataset created by Microsoft containing data from a fictional company. You probably remember the Northwind database from our section on Advanced SQL. Here's the schema for the Northwind database: Schema
- You can also use data of your own finding that is interesting. This should be in the form of a database if possible, but please find a data set that will lead to interesting hypotheses(questions).
- Your team must prepare a 5-10 minute presentation detailing the statistical analysis performed.
- Be sure to specify both the null hypothesis and the alternative hypothesis.
- You should also specify if your hypothesis is a one-tail or a two-tail test.
- Your presentation must provide at least three hypotheses(questions) and outline the process you went through to test the hypotheses.
- Use at least 4 meaningful data visualizations to help illustrate your findings.
- Any additional statistial analysis used to reach conclusions(Power, sample size, effect size, sampling, and other statistical analysis)
- No more than 8 slides.
Be prepared to answer questions such as:
- "why did you select your data?"
- "why did you pick the question(s)?"
- "why are these questions important?"
- "What are type I and II errors associated with your hypotheses?"
- "how did you decide on the statistical analysis carried out by your group and what did you learn from them?"
- "how did you decide on the data cleaning options you performed?"
- "why did you choose a given method or library?"
- "why did you select those visualizations and what did you learn from each of them?"
- Use the data provided or one of your own
- Establish naming conventions for variables and datasets
- Clean dataset
- You may use Pandas or Python functions
- Document your data cleaning process
- Use Scipy and/or Statsmodels perform meaningful statistial analysis on your data set. You may also use your own or prewritten functions.
- Carry out at least three hypothesis test using the statistical test from lectures and learn.co (ANOVA, t-test, etc).
- Carry out any further statistical analysis such as power analysis, sampling, effect size, etc.
- Posted to git repository:
- A README.md listing project members, goals, responsibilities, and a summary of the files in the repository
- At least 10 commits
- Must include short, descriptive commit messages
- Each project member should commit at least once
- A Jupyter notebook targeted to a technical audience that contains
- Clean and commented code so an independent party can replicate your analysis and justify your analytical choices
- Your final joined and cleaned dataset that was used for analysis.
- The packages or methods used to perform stastistical analysis.
- A narrative Jupyter notebook targeted to a non-technical audience that provides:
- The purpose of your analysis and why it matters
- 4 well annotated visualizations
- Statement of your hypotheses and conclusions
- A pdf of 8 - 10 slides used in a presentation targeting non-technical audience
- Apply consistent and effective formatting to create a “professional” appearance
- Write an abbreviated high-level overview of methodology and statistical analysis performed
- Present at least 3 hypotheses and concrete recommendations from conclusions drawn from hypothesis testing
- include exported visualizations from analysis
- Target the presentation to a non-technical audience, avoid jargon
- Take 5 - 10 minutes to present
- Group A: Gary Wheeler + Maia Ngo
- Group B: Thoa Shook + Christiaan Defaux
- Group C: Princess Otusanya + Patrick Kim
- Groups are to work independently without outside consulting
07/31 Wednesday - Project Assignment
- schedule Thursday check in with coach
08/01 Thurday - Check in with coach
- review data cleaning
- provide url of project repository
- review at least one table/chart
- one hypothesis and how you plan to test it.
- review work plan created for how teammates will approach and divide work
08/02 Friday - Demo presentation with feedback from instructors
- have polished draft completed
- have polished version of jupyter notebook completed
08/5 Monday
- afternoon project presentation
If any requirements are missing or if significant gaps in understanding are uncovered, be prepared to do one or all of the following:
- Perform additional data cleanup, data visualization, and statistical analysis
- Submit an improved version
- Meet again for another Project Presentation
What won't happen:
- You won't be yelled at, belittled, or scolded
- You won't be put on the spot without support
- There's nothing you can do to instantly blow it


