Git Product home page Git Product logo

reactjs-calendar-heatmap's Introduction

React component for D3.js Calendar Heatmap

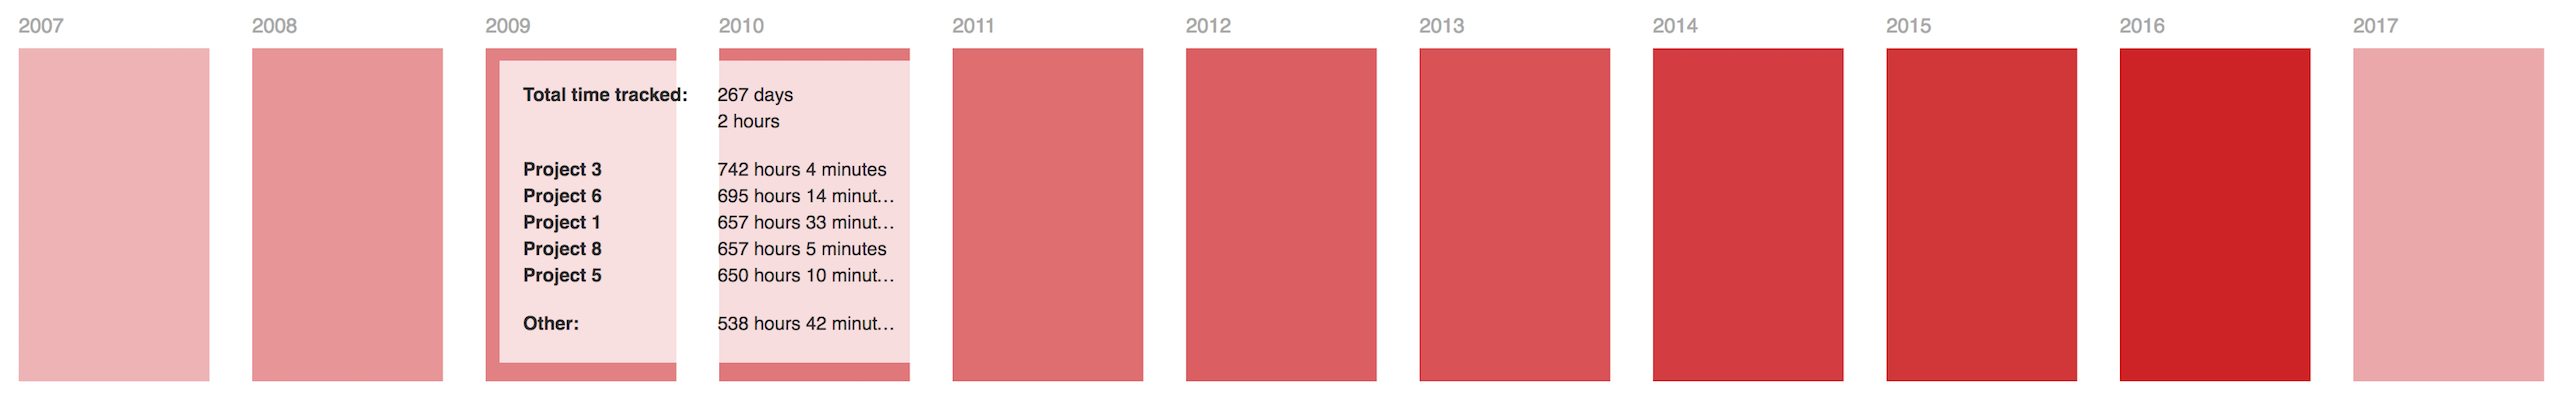
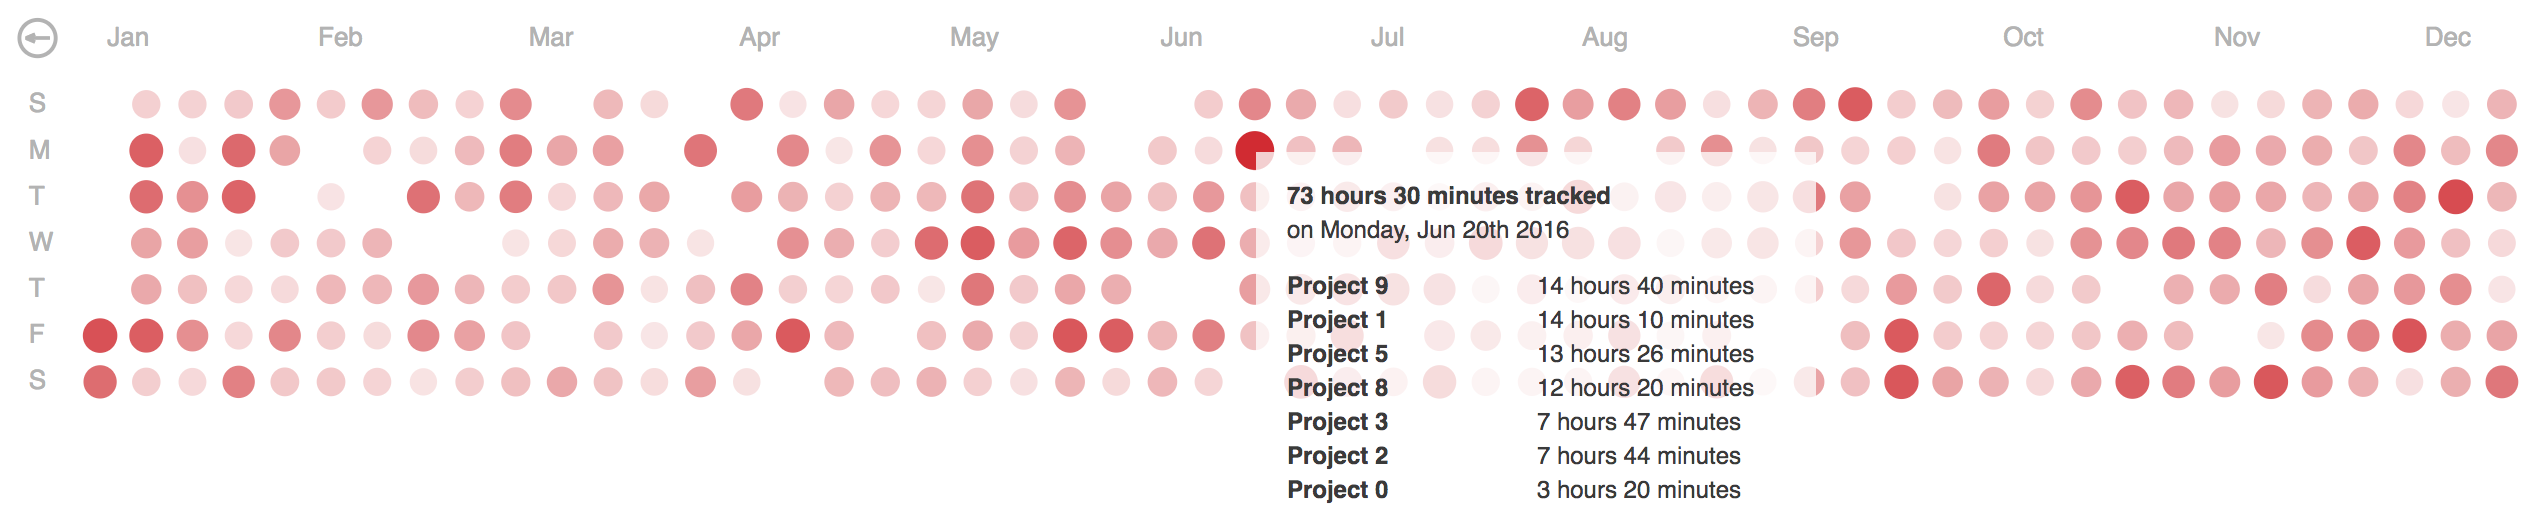
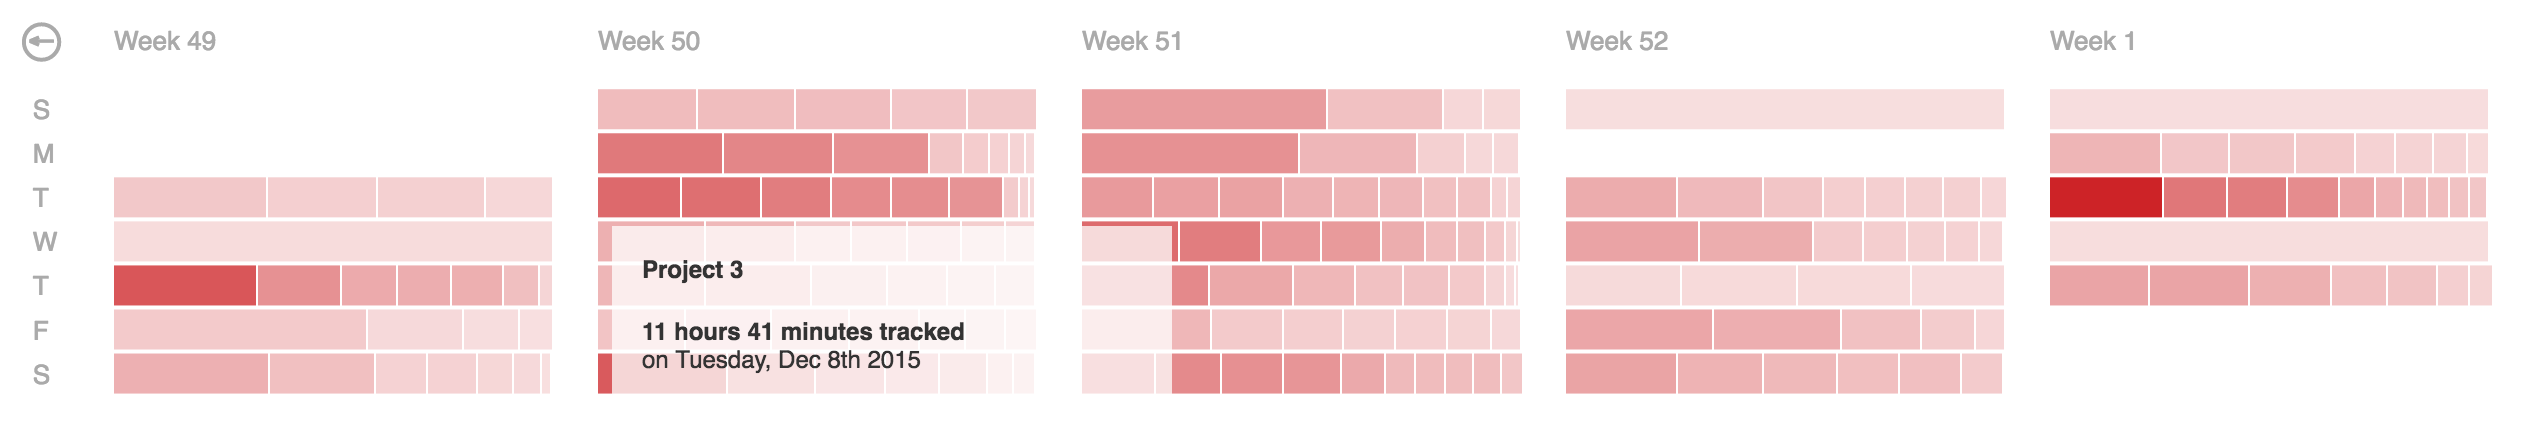
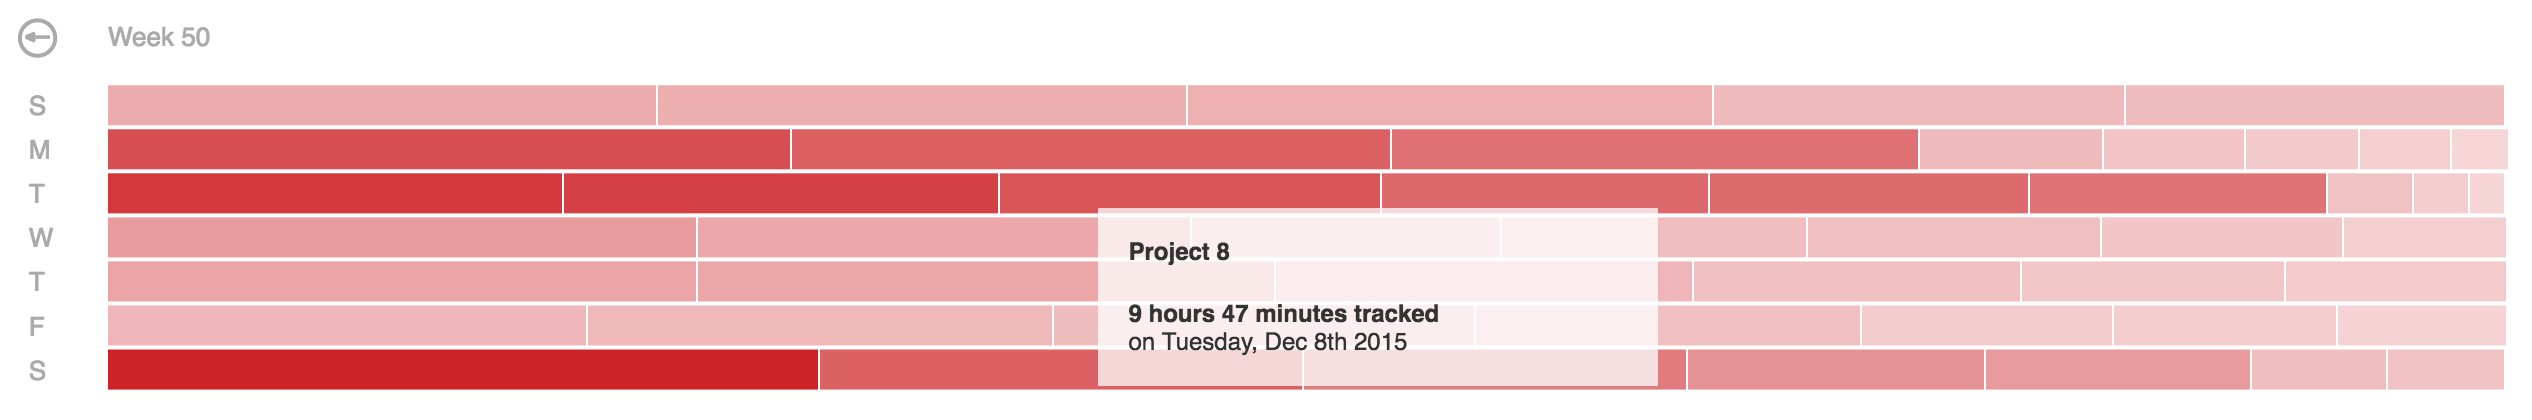
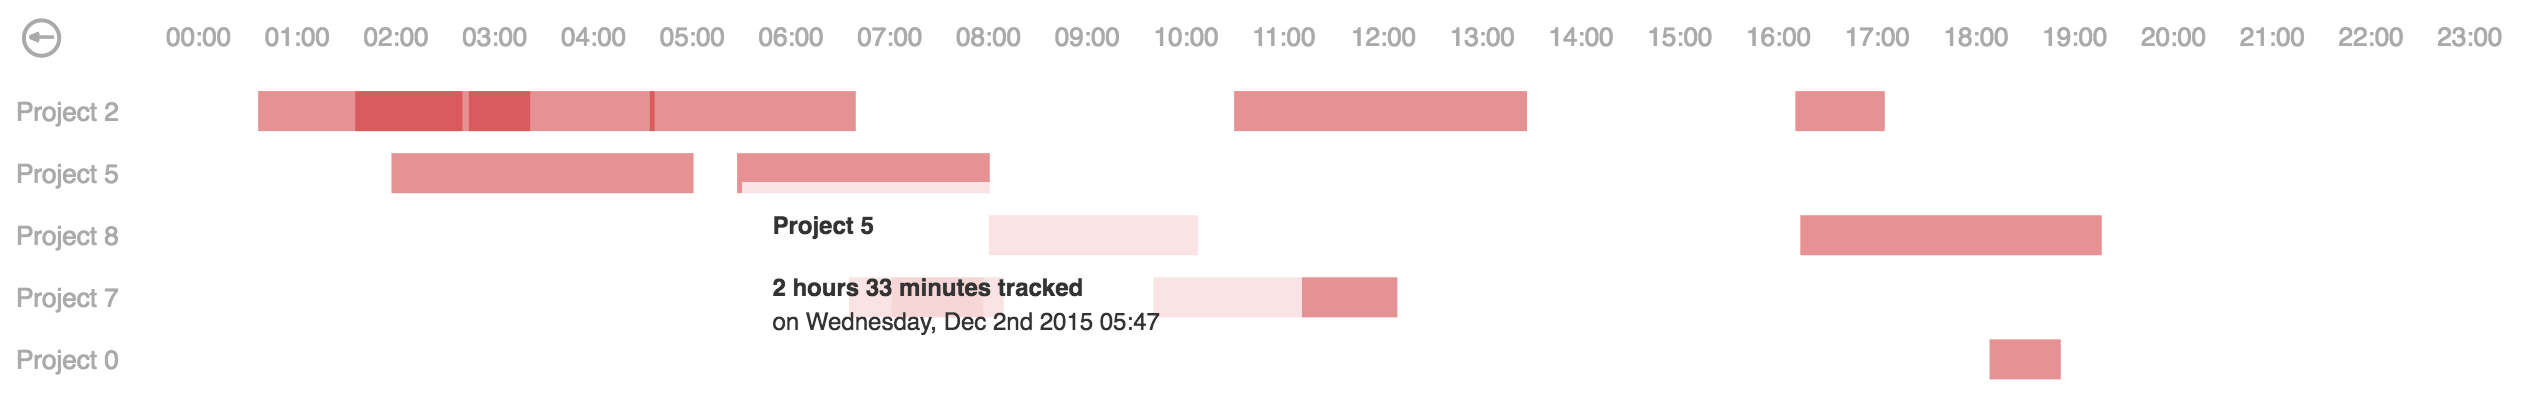
This d3.js heatmap representing time series data is used to visualize tracked time over the past year, showing details for each of the days on demand.

Includes a global overview of multiple years and visualizations of year, month, week and day overview with zoom for details-on-demand.

Inspired by Github's contribution graph

Based on Calendar View by Mike Bostock
Aaand D3.js Calendar Heatmap by Darragh Kirwan

Demo

Click here for a live demo.

Global overview

calendar heatmap - global overview

Year overview

calendar heatmap - year overview

Month overview

calendar heatmap - month overview

Week overview

calendar heatmap - week overview

Day overview

calendar heatmap - day overview

Install

  1. Install 'reactjs-calendar-heatmap' with npm
npm install reactjs-calendar-heatmap
  1. Import CalendarHeatmap in your component
import CalendarHeatmap from 'reactjs-calendar-heatmap'
  1. Render CalendarHeatmap component
<CalendarHeatmap
  data={data}
  color={color}
  overview={overview}
  handler={print}>
</CalendarHeatmap>

Properties

Property Usage Default Required
data Time series data from max a year back none yes
color Theme hex color #45ff00 no
overview Initial overview type (choices are: year, month, day) year no
handler Handler function is fired on click of a time entry in daily overview none no

Example data

Time series data where each day has a total time tracked (in seconds).
Details, if provided, are shown in a tooltip on mouseover in different overviews.

var data = [{
  "date": "2016-01-01",
  "total": 17164,
  "details": [{
    "name": "Project 1",
    "date": "2016-01-01 12:30:45",
    "value": 9192
  }, {
    "name": "Project 2",
    "date": "2016-01-01 13:37:00",
    "value": 6753
  },
  .....
  {
    "name": "Project N",
    "date": "2016-01-01 17:52:41",
    "value": 1219
  }]
}]

Optimization

In some cases details array could be large and in order to fit the data into the tooltip a short summary is generated with distinct projects and their total tracked time for that date. In terms of optimization, summary data can be computed server-side and passed in using the ``summary'' attribute. And in addition to the data structure described above this would result in a summary dictionary with distinct project names and total values of tracked time in seconds, e.g.:

var data = [{
  "date": "2016-01-01",
  "total": 17164,
  "details": [.....],
  "summary": [{
    "name": "Project 1",
    "value": 9192
  }, {
    "name": "Project 2",
    "value": 6753
  },
  .....
  {
    "name": "Project N",
    "value": 1219
  }]
}]

See index.html for an example implementation with random data or click here for a live demo.

Vanilla.js version

If you are looking for a plain vanilla javascript version of the heatmap, check out calendar-heatmap-graph

AngularJS

If you want to use this heatmap as an AngularJS directive (version 1.x), see angular-calendar-heatmap

Or as an Angular component (version 2.x), see angular2-calendar-heatmap

Dependencies

reactjs-calendar-heatmap's People

Contributors

ayantram-amitsharma avatar dependabot[bot] avatar dhvanipa avatar g1eb avatar qur786 avatar

Stargazers

 avatar  avatar  avatar  avatar  avatar  avatar  avatar  avatar  avatar  avatar  avatar  avatar  avatar  avatar  avatar  avatar  avatar  avatar  avatar  avatar  avatar  avatar  avatar  avatar  avatar  avatar  avatar  avatar  avatar  avatar  avatar  avatar  avatar  avatar  avatar  avatar  avatar  avatar  avatar  avatar  avatar  avatar  avatar  avatar  avatar  avatar  avatar  avatar  avatar  avatar  avatar  avatar  avatar  avatar  avatar  avatar  avatar  avatar  avatar  avatar  avatar  avatar  avatar  avatar  avatar  avatar  avatar  avatar  avatar  avatar  avatar  avatar  avatar  avatar  avatar  avatar  avatar  avatar  avatar  avatar  avatar  avatar  avatar  avatar  avatar  avatar  avatar  avatar  avatar  avatar  avatar  avatar  avatar  avatar  avatar  avatar  avatar  avatar  avatar  avatar

Watchers

 avatar  avatar  avatar  avatar  avatar  avatar

reactjs-calendar-heatmap's Issues

Rendering as individual components

Hi have used this component inside a React card component and this card has been looped through a map. This is how it is rendered

image

Any reason why it is rendered in a stacked manner?. Here is the card component

import React from "react";
import CalendarHeatmap from "reactjs-calendar-heatmap";

let chekc = [
  {
    date: "2016-01-01",
    total: 17164,
    details: [
      {
        name: "Project 1",
        date: "2016-01-01 12:30:45",
        value: 9192,
      },
      {
        name: "Project 2",
        date: "2016-01-01 13:37:00",
        value: 6753,
      },
      {
        name: "Project N",
        date: "2016-01-01 17:52:41",
        value: 1219,
      },
    ],
  },
];

function CheckCard({ name, runs, period, type, regions, data }) {
  return (
    <div className="raven-card raven-check">
      <div className="row">
        <div className="col-1 col-md-1"></div>
        <div className="col-5 col-md-5">
          <h4>{name}</h4>
        </div>
        <div className="col-1 col-md-1"></div>
        <div className="col-5  col-md-5"></div>
      </div>
      <div className="row">
        <div className="col-1 col-md-1"></div>
        <div className="col-5 col-md-5">
          <h6>{period}</h6>
        </div>
        <div className="col-1 col-md-1"></div>
        <div className="col-5  col-md-5"></div>
      </div>
      <hr />
      <div className="row">
        <div className="col-1  col-md-1"></div>
        <div className="col-10  col-md-10">
          <CalendarHeatmap data={chekc} overview="day"></CalendarHeatmap>
        </div>
        <div className="col-1  col-md-1"></div>
      </div>
    </div>
  );
}

export default CheckCard;

Getting a summary.length error and trouble displaying data in year mode

Hello,

While running my webapplication, it works initially. When clicking about, I run into the error below:
image

Also, I cannot see data displayed when showcasing the year (much like the other issue posted half a year ago).

This is how my code looks like:
image

I'm a bit new to React, so it might be a stupid problem on my end, but I can't seem to debug it. If you want to attempt to recreate the issue, the repo is here:
https://github.com/SoerenToennesen/Website
where I the calendar heat map is created under CalendarHeatMap.js

There is also another error, which I'm not sure why is created, as seen in the gif provided below (year_label.year is not a function).
ezgif com-gif-maker

Trouble to display data in the year mode

Hi,
I really like your chart and wanted to reuse it. I just have a problem when I put overview={'year'} . The data aren't displayed when the page is done loading, I have to go on global mode before going back to the year one in order for my data to be displayed. I didn't have the problem when I tried to put overview={'day'} or overview={'global'} . But I really wished to be able to display the year mode first.
thanks :)

p.scaleLinear is not a function

Hi, I am getting a error when I use your heatmap!

app.8afff0433bef2cc43286.js:138753 Uncaught TypeError: p.scaleLinear is not a function
at e.value (app.8afff0433bef2cc43286.js:138753)
at app.8afff0433bef2cc43286.js:58828
at measureLifeCyclePerf (app.8afff0433bef2cc43286.js:58639)
at app.8afff0433bef2cc43286.js:58827
at CallbackQueue.notifyAll (app.8afff0433bef2cc43286.js:26305)
at ReactReconcileTransaction.close (app.8afff0433bef2cc43286.js:60755)
at ReactReconcileTransaction.closeAll (app.8afff0433bef2cc43286.js:15364)
at ReactReconcileTransaction.perform (app.8afff0433bef2cc43286.js:15311)

Usage:

export default class PostHeatMap extends Component {

	constructor(props) {
		super(props)

		var data = [{
			"date": "2016-01-01",
			"total": 17164,
			"details": [{
				"name": "Project 1",
				"date": "2016-01-01 12:30:45",
				"value": 9192
			},
			{
				"name": "Project 2",
				"date": "2016-01-01 13:37:00",
				"value": 6753
			},
			{
				"name": "Project N",
				"date": "2016-01-01 17:52:41",
				"value": 1219
			}]
		}]

		this.state = {
			data: data,
		}

	}

	render() {
		return (
			<div>
				<CalendarHeatmap
					data={this.state.data}
					color='#45ff00'
				>
				</CalendarHeatmap>
			</div>
		)
	}
}

Can you please fix it? Thank you, it's amazing heat map.. :-)

Height Adjust With Many Projects

How would you go about increasing the default height, so that more "Projects" could be shown in an expanding-height fashion rather than being smushed together.

Tooltip doesn't take parent element into account

Hi @g1eb, I think this is a known issue, wonder why it's not reflecting in reactjs-calendar-heatmap even though a release with this fix was made on calendar-heatmap. I'm using the latest version.

    "reactjs-calendar-heatmap": "^0.2.0",

Use min_value as the lower boundary domain value

@g1eb Can we use minimum value calculated from the data that we process and use them to generate color code generator instead of passing (-0.15 * max_value) as the lower value for the domain.

.attr('fill', d => {
        let color = d3.scaleLinear()
          .range(['#ffffff', this.props.color])
          .domain([-0.15 * max_value, max_value])
        return color(d.total) || '#ff4500'
      })

And can you explain the reason, if any, behind using (-0.15 * max_value) as the lower value in the domain.

Error mousing over days

Cool library, I want to use it, but I'm getting some errors:

image

Was also curious of there was any chance to pass through some props to set the height and width?

Thanks!

Responsiveness of heatmap

Hi,

Is there anyway to change the size of the heatmap? I really love it but unfortunately it doesn't seem to be mobile responsive.

Thanks

Licence

Hi, Can you specify if this code is available under a licence such as MIT?

Thank you.

p.scaleLinear is not a function again

I was trying to find an answer from the closed issue but there was no answer...so I post my react+jsx code here to see why it happens.

import CalendarHeatmap from 'reactjs-calendar-heatmap';
import React from 'react';

function HeatMap() {
    let data = [{
        "date": "2016-01-01",
        "total": 17164,
        "details": [{
            "name": "Project 1",
            "date": "2016-01-01 12:30:45",
            "value": 9192
        }, {
            "name": "Project 2",
            "date": "2016-01-01 13:37:00",
            "value": 6753
        },

            {
                "name": "Project N",
                "date": "2016-01-01 17:52:41",
                "value": 1219
            }]
    }];

    let print = (value) => {
        console.log(value);
    };

    let overview = {
        year:'year',
        month:'month',
        day:'day'
    };


    return (
        <CalendarHeatmap
            data={data}
            color={'#45ff00'}
            overview={overview.year}
            handler={print.bind(this)}>
        </CalendarHeatmap>
    )

};

export default HeatMap;

I have installed d3 and moment via npm.

Recommend Projects

  • React photo React

    A declarative, efficient, and flexible JavaScript library for building user interfaces.

  • Vue.js photo Vue.js

    ๐Ÿ–– Vue.js is a progressive, incrementally-adoptable JavaScript framework for building UI on the web.

  • Typescript photo Typescript

    TypeScript is a superset of JavaScript that compiles to clean JavaScript output.

  • TensorFlow photo TensorFlow

    An Open Source Machine Learning Framework for Everyone

  • Django photo Django

    The Web framework for perfectionists with deadlines.

  • D3 photo D3

    Bring data to life with SVG, Canvas and HTML. ๐Ÿ“Š๐Ÿ“ˆ๐ŸŽ‰

Recommend Topics

  • javascript

    JavaScript (JS) is a lightweight interpreted programming language with first-class functions.

  • web

    Some thing interesting about web. New door for the world.

  • server

    A server is a program made to process requests and deliver data to clients.

  • Machine learning

    Machine learning is a way of modeling and interpreting data that allows a piece of software to respond intelligently.

  • Game

    Some thing interesting about game, make everyone happy.

Recommend Org

  • Facebook photo Facebook

    We are working to build community through open source technology. NB: members must have two-factor auth.

  • Microsoft photo Microsoft

    Open source projects and samples from Microsoft.

  • Google photo Google

    Google โค๏ธ Open Source for everyone.

  • D3 photo D3

    Data-Driven Documents codes.