Git Product home page Git Product logo

shinyjstutorials's Introduction

shiny-js-tutorials

this repo contains the code and documentation for the shiny javascript tutorials at the Shiny Development Center offered by RSTUDIO. The series consist of 6 in depth lessons for the intermediate shiny enthusiast with limited experience in HTML, CSS and/or JavaScript, who wants to learn how to extend shiny.

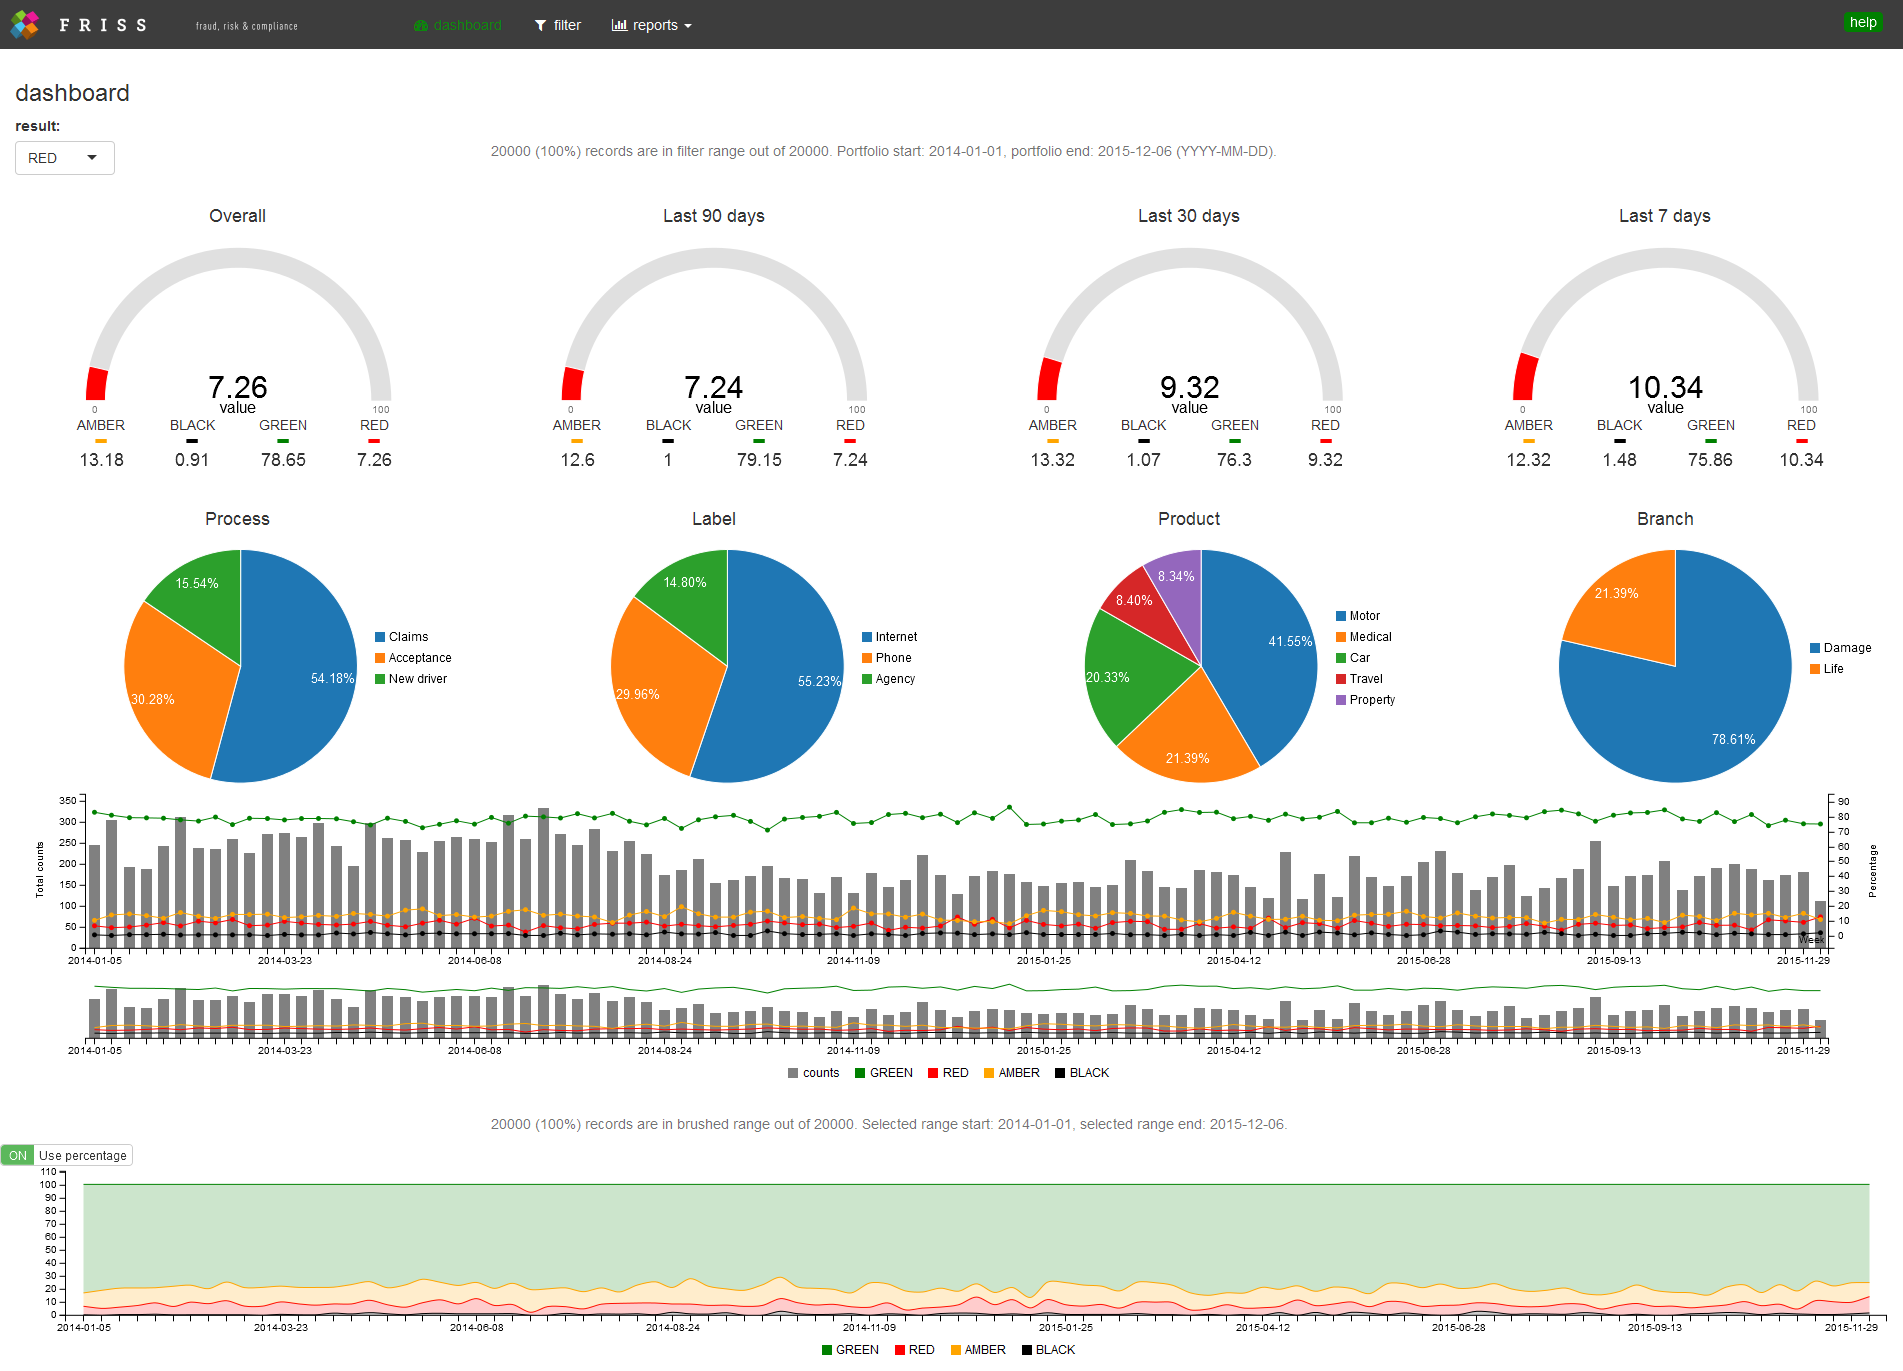
In order to master the techniques of extending shiny through these frameworks we'll construct a fully functional dashboard application. During the course of the tutorials we'll develop a number of HTMLWidgets based on c3.js. In addition, we'll create input bindings, a brushable timeline and an interactive help system, based on intro.js.

tutorial 1: In this tutorial we'll build our first htmlwidget, based on c3.js, a popular chart library build on d3.js. In addition, we'll take a deeper look in the tasks related to HTML, CSS and JavaScript a widget has to perform such that we can render JavaScript based interactive charts from R. Here we only create a single gauge chart, with limited functionality.

tutorial 2: In this tutorial we expand the functionality of the gauge widget and elaborate on related JavaScript concepts such as closures, events, objects and methods. In addition, we’ll create widgets for a c3 pie chart, line bar chart and stacked area chart;

tutorial 3: In this tutorial we take a closer look at JavaScript events and see how we can send messages from R to JavaScript and back. In addition, we show how you can create proxy objects, via which you can send updates to already existing charts. You'll also learn how to create chainable functions via the pipe (%>%) operator.

tutorial 4: In this tutorial we'll learn how to develop an interactive, dynamic help system for our dashboard, based on intro.js. This library allows you to easily create a step-by-step guide for your application. It will draw a nice box around elements of your choice, combined with an annotation layer and a navigation system.

tutorial 5: In this tutorial we'll learn how to create shiny input bindings, which capture events from the browser and send them back to shiny. We learn how to create an interactive toggle switch, as well as an interactive button group, which we'll use in a latter tutorial to create a filter system for our dashboard application.

tutorial 6: In the last tutorial in this series we'll put everything together we learned in the previous tutorials and create a fully functional dashboard. Here we learn how we can set up an interactive filter system that uses a brushable timeline component, as well as the interactive button groups developed in tutorial 5. In addition, we learn how to send events from JavaScript to R at different rates such that we don't overflow R with computations when we slide our brush over the timeline.

shinyjstutorials's People

Contributors

erwinschuijtvlotfriss avatar garrettgman avatar mine-cetinkaya-rundel avatar

Stargazers

 avatar  avatar  avatar  avatar  avatar  avatar  avatar  avatar  avatar  avatar  avatar  avatar  avatar  avatar  avatar  avatar  avatar  avatar  avatar  avatar  avatar  avatar  avatar  avatar  avatar  avatar  avatar  avatar  avatar  avatar  avatar  avatar  avatar  avatar  avatar  avatar  avatar  avatar  avatar  avatar  avatar  avatar  avatar  avatar  avatar  avatar  avatar  avatar  avatar  avatar  avatar  avatar  avatar  avatar  avatar  avatar  avatar  avatar  avatar  avatar  avatar  avatar  avatar  avatar  avatar  avatar  avatar  avatar  avatar  avatar  avatar  avatar  avatar  avatar  avatar  avatar  avatar  avatar  avatar  avatar  avatar  avatar  avatar  avatar  avatar  avatar  avatar  avatar  avatar  avatar  avatar  avatar  avatar  avatar  avatar  avatar  avatar  avatar  avatar  avatar

Watchers

 avatar  avatar  avatar  avatar  avatar  avatar  avatar  avatar  avatar  avatar  avatar  avatar  avatar  avatar  avatar  avatar  avatar  avatar  avatar  avatar  avatar  avatar  avatar  avatar  avatar  avatar  avatar  avatar  avatar  avatar  avatar

shinyjstutorials's Issues

C3 and scatterD3 incompatibility?

The following minimal reproducible example works fine, but when I uncomment scatterD3Output("scatterPlot", height = "700px") it stops working: no error is given, but no output is shown.

Are the C3 and scatterD3 libraries incompatible? Thanks much in advance for any help.

library(shiny)
library(C3)
library(scatterD3)

server = function(input, output) {
  my_df = reactive({
    input$button
    my_df = list(a=runif(1,0,100),b=runif(1,0,100),c=runif(1,0,100))
    list(my_df=my_df)
  })
  output$my_pie = renderC3Pie({
    C3Pie(value = my_df()$my_df)
  })
  output$scatterPlot <- renderScatterD3({
    scatterD3(x=1,y=1)
  })
}
    
ui = shinyUI(
  fluidPage(
    fluidRow(
      actionButton('button', "Draw!"),
      C3PieOutput('my_pie')
    ),
    fluidRow(
      br()#,scatterD3Output("scatterPlot", height = "700px")
    )
  )
)
shinyApp(ui = ui, server = server)

install bower

bower has to be installed separately. bower requires node to be installed. The article should mention that.
Also Rstudio allows you to create an R package via it's "New Project" dialog box. Is that the same as using devtools::create("C3").

C3Gauge R File

On the tutorial, the last block of code for C3Gauge.R has package = 'C3Gauge'.
This should be package = 'C3'.

Incorrect reference to package name

The foo addIntroJS at the file shinyJsTutorials/tutorials/materials4/FrissIntroJSBasic/R/FrissIntroJS.R should reference to:

package='FrissIntroJSBasic') instead of
package='FrissIntroJS')

The name of the package install from shinyJsTutorials/tutorials/materials4/FrissIntroJSBasic contains the suffix *Basic. So either change the name of the package or the reference.

Great tutorial!

suggestion about debug

What a nice tutorial, thanks a million. I am wondering do you have any suggestions about debug?
Sometime when I make something wrong, the result is just not rendered, but there is no error message. It's really hard to target the error. Thanks :)
BTW, I use Rstudio IDE.

Consider using rintrojs

Hello,

Thanks for the wonderful, and informative tutorials. This is sort of a shameless plug, but I think you could greatly simplify the intro.js code in the 4th tutorial, using the rintrojs package.

For example, you can do a multi-tab introduction, similar to what you have in the advanced example, with substantially less javascript:

library(shiny)
devtools::install_github("carlganz/rintrojs")
library(rintrojs)

ui <- shinyUI(fluidPage(
  introjsUI(),
  navbarPage("Test",id="nav",
             tabPanel("one",
                      actionButton("btn","Press me for intro")),
             tabPanel("two",
                      p("Here is some text",id="someText")
             )
  )
)
)

server <- shinyServer(function(input, output, session) {

  steps <- reactive({
    req(input$nav)
    if (input$nav=='one') {
      data.frame(element=c(NA,"#btn"),
                 intro=c("Welcome","This is a button"))
    } else {
      data.frame(element=c(NA,"#someText"),
                 intro=c("Welcome to second tab",
                         "This is some text"))
    }

  })

  options <- reactive({
    req(input$nav)
    if (input$nav=='one') {
      list(doneLabel="Next page",steps=steps())      
    } else {
      list(steps=steps())
    }
  })

  events <- reactive({
    req(input$nav)
    if (input$nav=='one') {
      list(oncomplete=paste0(
        "$('[data-value=' + ","\"two\""," + ']').tab('show');
           Shiny.onInputChange('btn',Math.random())"
      ))      
    } else {
      list()
    }
  })

  observeEvent(input$btn,{

    introjs(session, options=options(), events=events())

  })

})

# Run the application 
shinyApp(ui = ui, server = server)

Would you consider a pull request that reworked the examples from the 4th tutorial using rintrojs?

Kind Regards,
Carl

Uncaught TypeError: instance.resize is not a function

Minimal reproducible example:

library(shiny)
library(C3) # install via devtools::install_github("tixierae/shinyJsTutorials/tutorials/materials2/C3")

server = function(input,output) {
    my_df = reactive({
        input$button
        my_df = list(a=runif(1,0,100),b=runif(1,0,100),c=runif(1,0,100))
        list(my_df=my_df)
    })
    output$my_pie1 = renderC3Pie({
        C3Pie(value = my_df()$my_df)
    })
}
ui = shinyUI(
    navbarPage(id="main", position = "fixed-top", title=NULL, inverse=T, selected="tab1",
        tabPanel("tab1",
            fluidRow(br(),br(),br(),
                actionButton("button", "Draw!"),
                C3PieOutput("my_pie1")
            )
        ),
        tabPanel("tab2",
            fluidRow(br(),br(),br(),
            )
        )
    )
)
shinyApp(ui=ui, server=server)

Procedure to reproduce the error (happens at least on Chrome and Firefox):

  • go to 'tab2'
  • generously zoom in or out
  • go back to 'tab1'. The app is now frozen.

Inspect on Chrome shows:

Uncaught TypeError: instance.resize is not a function
    at Object.resize (htmlwidgets.js:822)
    at exports.OutputBinding.shinyBinding.resize (htmlwidgets.js:526)
    at output_binding_adapter.js:12
    at OutputBindingAdapter.onResize (utils.js:114)
    at HTMLDivElement.<anonymous> (init_shiny.js:305)
    at Function.each (jquery.min.js:2)
    at n.fn.init.each (jquery.min.js:2)
    at j (init_shiny.js:298)
    at Debouncer.$invoke (input_rate.js:56)
    at Debouncer.immediateCall (input_rate.js:44)

I'm working with the dev version of htmlwidgets (installed from GitHub).
In my fork of C3, I just modified the colors of the pie chart.

I'm not sure whether this has to do with the htmlwidgets package or C3.

Gauge-Example 2; Syntax

There might be a typo in the Example of the second Gauge in the setInterval-function.
According to the Website and the Example code, it should be newData = {'data', newValue } which raises a Syntax error in my case. I guess it should be newData = {'data': newValue } right ?

tutorial is gone from Rstudio website?

Hi,

I am a big fan of this tutorial series and curious if anyone knew why the tutorial series have been taken down from Rstudio websites.

Thanks,
Derek

Creating my own widget

I followed the exact template of your Gauge widget to try to create a histogram widget (.js and .R files below).

The core of the .js file works. If you just paste the whole var chart = c3.generate({...}) statement into http://c3js.org/samples/chart_bar.html, adding the lines

var x = {
"x1":[0, 50, 100, 150, 200, 250],
"prob":[0.3, 0.2, 0.1, 0.05, 0.04, 0.01],
"my_th":2
};

at the top, the histogram shows as expected. However, when executing

C3Hist(x1=c(0, 50, 100, 150, 200, 250),prob=c(0.3, 0.2, 0.1, 0.05, 0.04, 0.01),my_th=2)

in RStudio, nothing shows. So, I believe that my bindings are at fault, but I couldn't find what's wrong. Could you please have a quick look? Your help would be much appreciated.

If you need to reproduce the error, you can install my fork of C3 with devtools::install_github("tixierae/shinyJsTutorials/tutorials/materials2/C3"). Note that I created a C3Hist.yaml file, and added export(C3Hist);export(C3HistOutput) to the NAMESPACE file.

C3Hist.R

C3Hist <- function(prob,x1,my_th,width=NULL,height=NULL) {
  # forward options using x
  x = list(
    prob = prob,
    x1 = x1,
    my_th = my_th
  )
  # create widget
  htmlwidgets::createWidget(
    name = 'C3Hist',
    x,
    width = width,
    height = height,
    package = 'C3'
  )
}
C3HistOutput <- function(outputId, width = '100%', height = '400px'){
  htmlwidgets::shinyWidgetOutput(outputId, 'C3Hist', width, height, package = 'C3')
}
renderC3Hist <- function(expr, env = parent.frame(), quoted = FALSE) {
  if (!quoted) { expr <- substitute(expr) } # force quoted
  htmlwidgets::shinyRenderWidget(expr, C3HistOutput, env, quoted = TRUE)
}

C3Hist.js

HTMLWidgets.widget({
    name: 'C3Hist',
    type: 'output',
    factory: function(el, width, height) {
        // create an empty chart
        var chart = null;
        return {
            renderValue: function(x) {
                // check if the chart exists
                if(chart === null){
                    // the chart did not exist and we want to create a new chart via c3.generate
                    var chart = c3.generate({  
                        bindto : el,
                        data: {
                            columns: [
                                ['x1'].concat(x.x1),
                                ['prob'].concat(x.prob)
                            ],
                            type: 'bar',
                            xs: {
                                'prob': 'x1', 
                            },
                            colors: {
                                prob: function(d) {
                                    return (x.prob.indexOf(d.value) >= x.my_th) ? '#aec7e8':'#1f77b4';
                                }
                            },
                            onclick:  function (d, element) {Shiny.onInputChange(el.id,d)}
                        },
                        bar: {
                            width: {
                                ratio: 1 // this makes bar width 100% of length between ticks
                            }
                        },
                        legend: {
                            show: false
                        },
                        // take care of color in tooltip
                        tooltip: {
                            contents: function (d, defaultTitleFormat, defaultValueFormat, color) {
                                color = function() {
                                    return (x.prob.indexOf(d[0].value) >= x.my_th) ? '#aec7e8':'#1f77b4';
                                };
                                return chart.internal.getTooltipContent.call(this, d, defaultTitleFormat, defaultValueFormat, color)
                            }
                        }
                    });
                    // store the chart on el so we can get it latter
                    el.chart = chart;
                }
                // at this stage the chart always exists
                // load the new data
                chart.load({
                    columns: [
                        ['x1'].concat(x.x1),
                        ['prob'].concat(x.prob)
                    ]
                });
            },
            resize: function(width, height) {
                // this will vary based on the JavaScript library
                // in the case of C3 we are fortunate that there is a resize method
                //  http://c3js.org/samples/api_resize.html
                chart.resize({height:height, width:width})
            }
        };
    }
});

barchart library

First of all, thanks for this fantastic resource and tutorial -- your hard work on this is highly appreciated and looking forward to the next articles.

A quick question though: did you already publish the widget or demo Shiny app with source code generating the stacked bar chart below the gauges?

Invitation to the satRday conference @ Budapest 2016

Hello Herman,

sorry to bother you here -- I tried to reach you on LinkedIn as well, but unfortunately, without any success.

To keep it short, we are organizing the first satRday conference around the world, which will happen to be at Budapest, Hungary in this September -- and it would be great to have you there: http://budapest.satrdays.org/#cfp

I would love to see a 1.5 hrs long workshop on Shiny from you, but of course, it would be great to hear a regular talk on your R related projects at Friss Analytics too.

Please let me know if you are interested at my [email protected] or [email protected] e-mail address, and of course, feel free to close/delete this issue.

Thanks,
Gergely

error with C3Guage hello world

running the C3Guage("hello, world") command results in an error

Error in (function (name, version, src, meta = NULL, script = NULL, stylesheet = NULL,  : 
  argument "version" is missing, with no default

Also why does the hello world even work. Is it because of

el.innerText = x.message;

in the C3Guage.js default template

Using Microsoft R Open 3.2.3 on windows 10
devtools 1.11.1
htmlwidgets 0.6

Recommend Projects

  • React photo React

    A declarative, efficient, and flexible JavaScript library for building user interfaces.

  • Vue.js photo Vue.js

    🖖 Vue.js is a progressive, incrementally-adoptable JavaScript framework for building UI on the web.

  • Typescript photo Typescript

    TypeScript is a superset of JavaScript that compiles to clean JavaScript output.

  • TensorFlow photo TensorFlow

    An Open Source Machine Learning Framework for Everyone

  • Django photo Django

    The Web framework for perfectionists with deadlines.

  • D3 photo D3

    Bring data to life with SVG, Canvas and HTML. 📊📈🎉

Recommend Topics

  • javascript

    JavaScript (JS) is a lightweight interpreted programming language with first-class functions.

  • web

    Some thing interesting about web. New door for the world.

  • server

    A server is a program made to process requests and deliver data to clients.

  • Machine learning

    Machine learning is a way of modeling and interpreting data that allows a piece of software to respond intelligently.

  • Game

    Some thing interesting about game, make everyone happy.

Recommend Org

  • Facebook photo Facebook

    We are working to build community through open source technology. NB: members must have two-factor auth.

  • Microsoft photo Microsoft

    Open source projects and samples from Microsoft.

  • Google photo Google

    Google ❤️ Open Source for everyone.

  • D3 photo D3

    Data-Driven Documents codes.