Git Product home page Git Product logo

automated-fundamental-analysis's Introduction

Automated Fundamental Analysis via Python

This python program rates stocks out of 100 based on valuation, profitability, growth, and price performance metrics, relative to sector.

View the file StockRatings-04.05.22.csv as an example of the output of this program

How to Run the Code

  1. Clone the repository git clone https://github.com/faizancodes/Automated-Fundamental-Analysis.git
  2. Run cd Automated-Fundamental-Analysis
  3. Download all the dependencies pip install -r requirements.txt
  4. Run stockgrader.py, this will scrape data from all 8300+ stocks on Finviz.com and grade each of them out of 100
    • The program will also generate the CSV files you can use for analysis
  5. Open the csv file created from the program through Excel and analyze!

How to Run the Web App

  1. Run cd WebApp
  2. Run streamlit run app.py
    • If that does not work, run py -m streamlit run app.py
  3. Open the web app in your browser, it will be on localhost

Web App Screenshots

Grading System

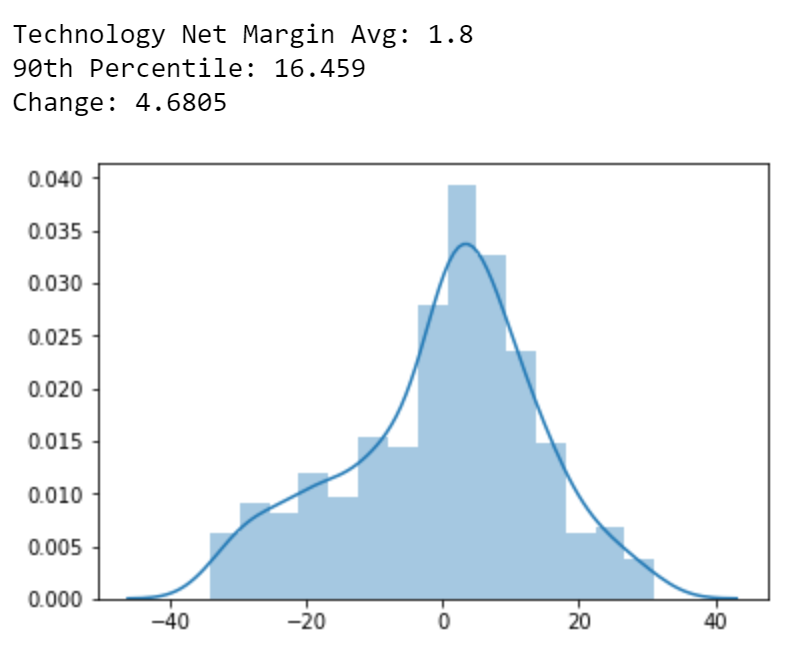
The grading system used in this program is based on the normal distribution of values for a certain metric for a specified sector. For example, if I want to grade the Net Margin of a stock in the Technology sector, I look at the net margins of all the stocks in the technology sector and grade the stock's net margin based on its percentile in the distribution of values.

In the figure below, we see that the average net margin for a stock in technology sector is 1.8% and the 90th percentile is 16.45%. The grading system utilized in the program takes the standard deviation of the set of values after removing outliers and divides that number by 3, which is represented by the 'Change' value shown in the figure, equaling 4.68. This is the value that is used to grade each metric for each stock.

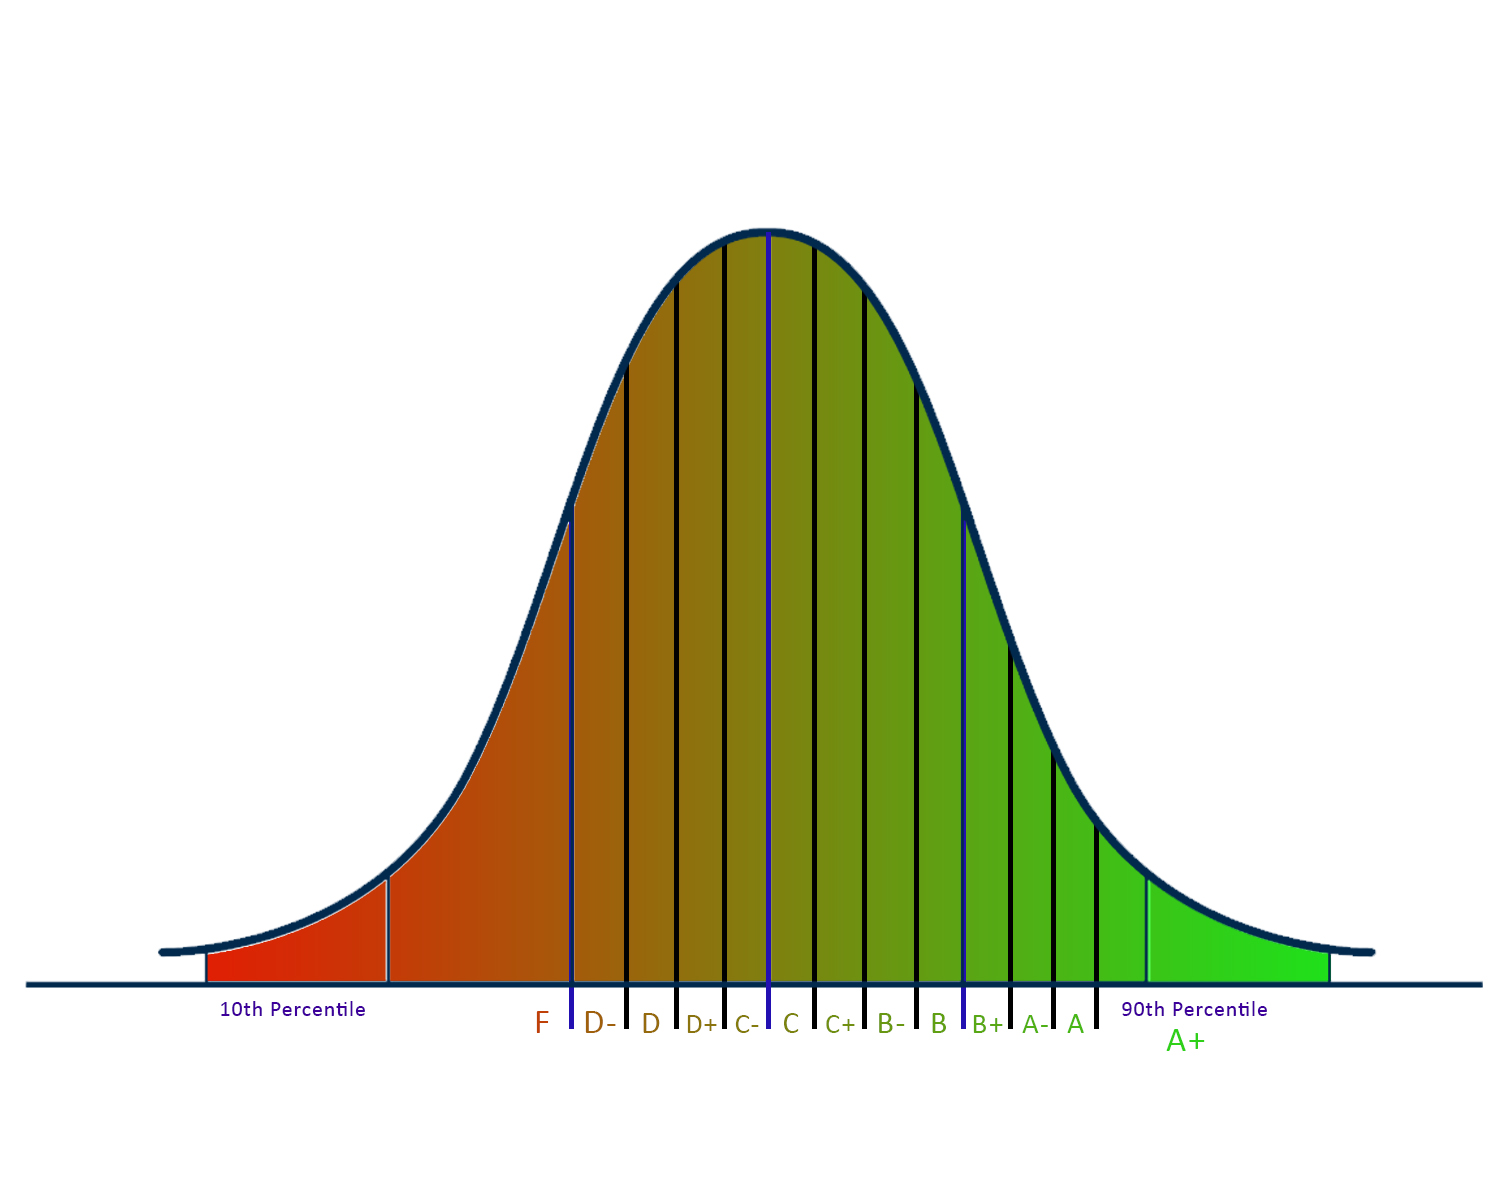
The figure shown below represents exactly how each metric is graded, where each bar in the graph is representative of 1 increment of the 'Change' value. Based on this figure and the 'Change' value, a stock in the technology sector with a net margin of:

  • 17% is rated A+
  • 15% is rated A
  • 11% is rated A-

After all the metrics in each category of valuation, profitability, growth, and price performance are graded, the grades are then converted to numbers and then the average of the values is computed. To get the overall rating of a stock, these numerical ratings for each category are added together and multiplied to get a score out of 100.

For metrics where a lower value is considered better, such as P/E ratios, the algorithm will use the 10th percentile as the basis for grading. So if a stock in the Technology sector has a P/E ratio of 10 and that is in the 10th percentile of all P/E ratios for Technology stocks, it will be rated A+.

automated-fundamental-analysis's People

Contributors

faizancodes avatar

Stargazers

 avatar  avatar  avatar  avatar  avatar  avatar  avatar  avatar  avatar  avatar  avatar  avatar  avatar  avatar  avatar  avatar  avatar  avatar  avatar  avatar  avatar  avatar  avatar  avatar  avatar  avatar  avatar  avatar  avatar  avatar  avatar  avatar  avatar  avatar  avatar  avatar  avatar  avatar  avatar  avatar  avatar  avatar  avatar  avatar  avatar  avatar  avatar  avatar  avatar  avatar  avatar  avatar  avatar  avatar  avatar  avatar  avatar  avatar  avatar  avatar  avatar  avatar  avatar  avatar  avatar  avatar  avatar  avatar  avatar  avatar  avatar  avatar  avatar  avatar  avatar  avatar  avatar  avatar  avatar  avatar  avatar  avatar  avatar  avatar  avatar  avatar  avatar  avatar  avatar  avatar  avatar  avatar  avatar  avatar  avatar  avatar  avatar  avatar  avatar  avatar

Watchers

 avatar  avatar  avatar  avatar  avatar  avatar  avatar  avatar

automated-fundamental-analysis's Issues

getsectordata.py creates empty files

Hi there,
thanks for the great code. However, with the new version, the getsectordata.py is creating empty files. It ends with the error message:

Exception has occurred: ZeroDivisionError
division by zero
File "/home/Documents/Python/Automated-Fundamental-Analysis-github/getsectordata.py", line 237, in getAverage
metricAvg = avg validCells
File "/home/Documents/Python/Automated-Fundamental-Analysis-github/getsectordata.py", line 283, in
smoothAvg, start, change = getAverage(sector, metric, lessThan)

I run it with Python3.6 as otherwise I wasn't able to install numpy 1.18.4. With the old version a few months back it took some time to retrieve the sector data, but now the empty files are created within a minute.

The files look similar to me. Tough, I could not find what is causing the problem.

All the Best.

Problem to run the Automated Fundamental Analysis

Hi.
First of all, congratulation on the amazing job here.
I download the repository through the git command a couple of months ago and work properly without any trouble. Now I would like to run again the analysis after quarterly results, but it is not working anymore for some reason. There is something that could change maybe? I am not an expert, to be honest, but if one time run, I don't understand why the second not. I clone everything again but still not working. Could be related to the getsectordata.py file because is writing the sectors but left them empty.
Please find below the code in order to see if there is any clue of what could be wrong. Thank you in advance

C:\Users\ejlam\Documents\Automated-Fundamental-Analysis>py getsectordata.py

Gathering data from basicmaterials sector...
Saved: SectorData\SectorData - basicmaterials.csv

Gathering data from communicationservices sector...
Saved: SectorData\SectorData - communicationservices.csv

Gathering data from consumercyclical sector...
Saved: SectorData\SectorData - consumercyclical.csv

Gathering data from consumerdefensive sector...
Saved: SectorData\SectorData - consumerdefensive.csv

Gathering data from energy sector...
Saved: SectorData\SectorData - energy.csv

Gathering data from financial sector...
Saved: SectorData\SectorData - financial.csv

Gathering data from healthcare sector...
Saved: SectorData\SectorData - healthcare.csv

Gathering data from industrials sector...
Saved: SectorData\SectorData - industrials.csv

Gathering data from realestate sector...
Saved: SectorData\SectorData - realestate.csv

Gathering data from technology sector...
Saved: SectorData\SectorData - technology.csv

Gathering data from utilities sector...
Saved: SectorData\SectorData - utilities.csv
Saved: SectorData\SectorData - AllSectors.csv
C:\Users\ejlam\AppData\Local\Programs\Python\Python37\lib\site-packages\numpy\core\fromnumeric.py:3335: RuntimeWarning: Mean of empty slice.
out=out, **kwargs)
C:\Users\ejlam\AppData\Local\Programs\Python\Python37\lib\site-packages\numpy\core_methods.py:161: RuntimeWarning: invalid value encountered in double_scalars
ret = ret.dtype.type(ret / rcount)
C:\Users\ejlam\AppData\Local\Programs\Python\Python37\lib\site-packages\numpy\core_methods.py:217: RuntimeWarning: Degrees of freedom <= 0 for slice
keepdims=keepdims)
C:\Users\ejlam\AppData\Local\Programs\Python\Python37\lib\site-packages\numpy\core_methods.py:186: RuntimeWarning: invalid value encountered in true_divide
arrmean, rcount, out=arrmean, casting='unsafe', subok=False)
C:\Users\ejlam\AppData\Local\Programs\Python\Python37\lib\site-packages\numpy\core_methods.py:209: RuntimeWarning: invalid value encountered in double_scalars
ret = ret.dtype.type(ret / rcount)
Traceback (most recent call last):
File "getsectordata.py", line 283, in
smoothAvg, start, change = getAverage(sector, metric, lessThan)
File "getsectordata.py", line 237, in getAverage
metricAvg = avg / validCells
ZeroDivisionError: division by zero

C:\Users\ejlam\Documents\Automated-Fundamental-Analysis>py stockratings.py
Which set of stocks do you want to get the ratings for?
Enter 1 for S&P500 stocks
Enter 2 for Mid Cap stocks over $2B Market Cap
Enter 3 for stocks over $300 Mln Market Cap
Enter 4 for stocks under $2B Market Cap
1

Loading data from SymbolData\S&P500Symbols.csv
0%| | 0/505 [00:00<?, ?it/s]C:\Users\ejlam\AppData\Local\Programs\Python\Python37\lib\site-packages\numpy\core\fromnumeric.py:3335: RuntimeWarning: Mean of empty slice.
out=out, **kwargs)
C:\Users\ejlam\AppData\Local\Programs\Python\Python37\lib\site-packages\numpy\core_methods.py:161: RuntimeWarning: invalid value encountered in double_scalars
ret = ret.dtype.type(ret / rcount)
C:\Users\ejlam\AppData\Local\Programs\Python\Python37\lib\site-packages\numpy\core_methods.py:217: RuntimeWarning: Degrees of freedom <= 0 for slice
keepdims=keepdims)
C:\Users\ejlam\AppData\Local\Programs\Python\Python37\lib\site-packages\numpy\core_methods.py:186: RuntimeWarning: invalid value encountered in true_divide
arrmean, rcount, out=arrmean, casting='unsafe', subok=False)
C:\Users\ejlam\AppData\Local\Programs\Python\Python37\lib\site-packages\numpy\core_methods.py:209: RuntimeWarning: invalid value encountered in double_scalars
ret = ret.dtype.type(ret / rcount)
0%| | 0/505 [00:01<?, ?it/s]
Traceback (most recent call last):
File "stockratings.py", line 875, in
getStockStats()
File "stockratings.py", line 853, in getStockStats
getStockData(stock)
File "stockratings.py", line 574, in getStockData
valuationGrade = getCategoryGrade(sector.lower(), valuationStats)
File "stockratings.py", line 467, in getCategoryGrade
output.append(getGrade(arr[x][0], arr[x][1], sector))
File "stockratings.py", line 269, in getGrade
start, change = getSectorStats(sector, mtrc, lessThan)
File "stockratings.py", line 176, in getSectorStats
metricAvg = avg / validCells
ZeroDivisionError: division by zero

C:\Users\ejlam\Documents\Automated-Fundamental-Analysis>

The source website data has changed

It looks like the finviz website has changed its data format, because the table is not found anymore.
I prepared a fix on a feature branch. If you give me access, I can push it.

Best Rgds,
Filip

Recommend Projects

  • React photo React

    A declarative, efficient, and flexible JavaScript library for building user interfaces.

  • Vue.js photo Vue.js

    ๐Ÿ–– Vue.js is a progressive, incrementally-adoptable JavaScript framework for building UI on the web.

  • Typescript photo Typescript

    TypeScript is a superset of JavaScript that compiles to clean JavaScript output.

  • TensorFlow photo TensorFlow

    An Open Source Machine Learning Framework for Everyone

  • Django photo Django

    The Web framework for perfectionists with deadlines.

  • D3 photo D3

    Bring data to life with SVG, Canvas and HTML. ๐Ÿ“Š๐Ÿ“ˆ๐ŸŽ‰

Recommend Topics

  • javascript

    JavaScript (JS) is a lightweight interpreted programming language with first-class functions.

  • web

    Some thing interesting about web. New door for the world.

  • server

    A server is a program made to process requests and deliver data to clients.

  • Machine learning

    Machine learning is a way of modeling and interpreting data that allows a piece of software to respond intelligently.

  • Game

    Some thing interesting about game, make everyone happy.

Recommend Org

  • Facebook photo Facebook

    We are working to build community through open source technology. NB: members must have two-factor auth.

  • Microsoft photo Microsoft

    Open source projects and samples from Microsoft.

  • Google photo Google

    Google โค๏ธ Open Source for everyone.

  • D3 photo D3

    Data-Driven Documents codes.