Git Product home page Git Product logo

protractor-beautiful-reporter's Introduction

npm Total Downloads CI

🕵️‍♂️ Looking for new project maintainers!

Hello, I no longer have time to maintain this repository, but i see that there are people here that would like to use this tool. Feel free to reach out to me if you want to become new maintainer - email on the bottom of this page :)


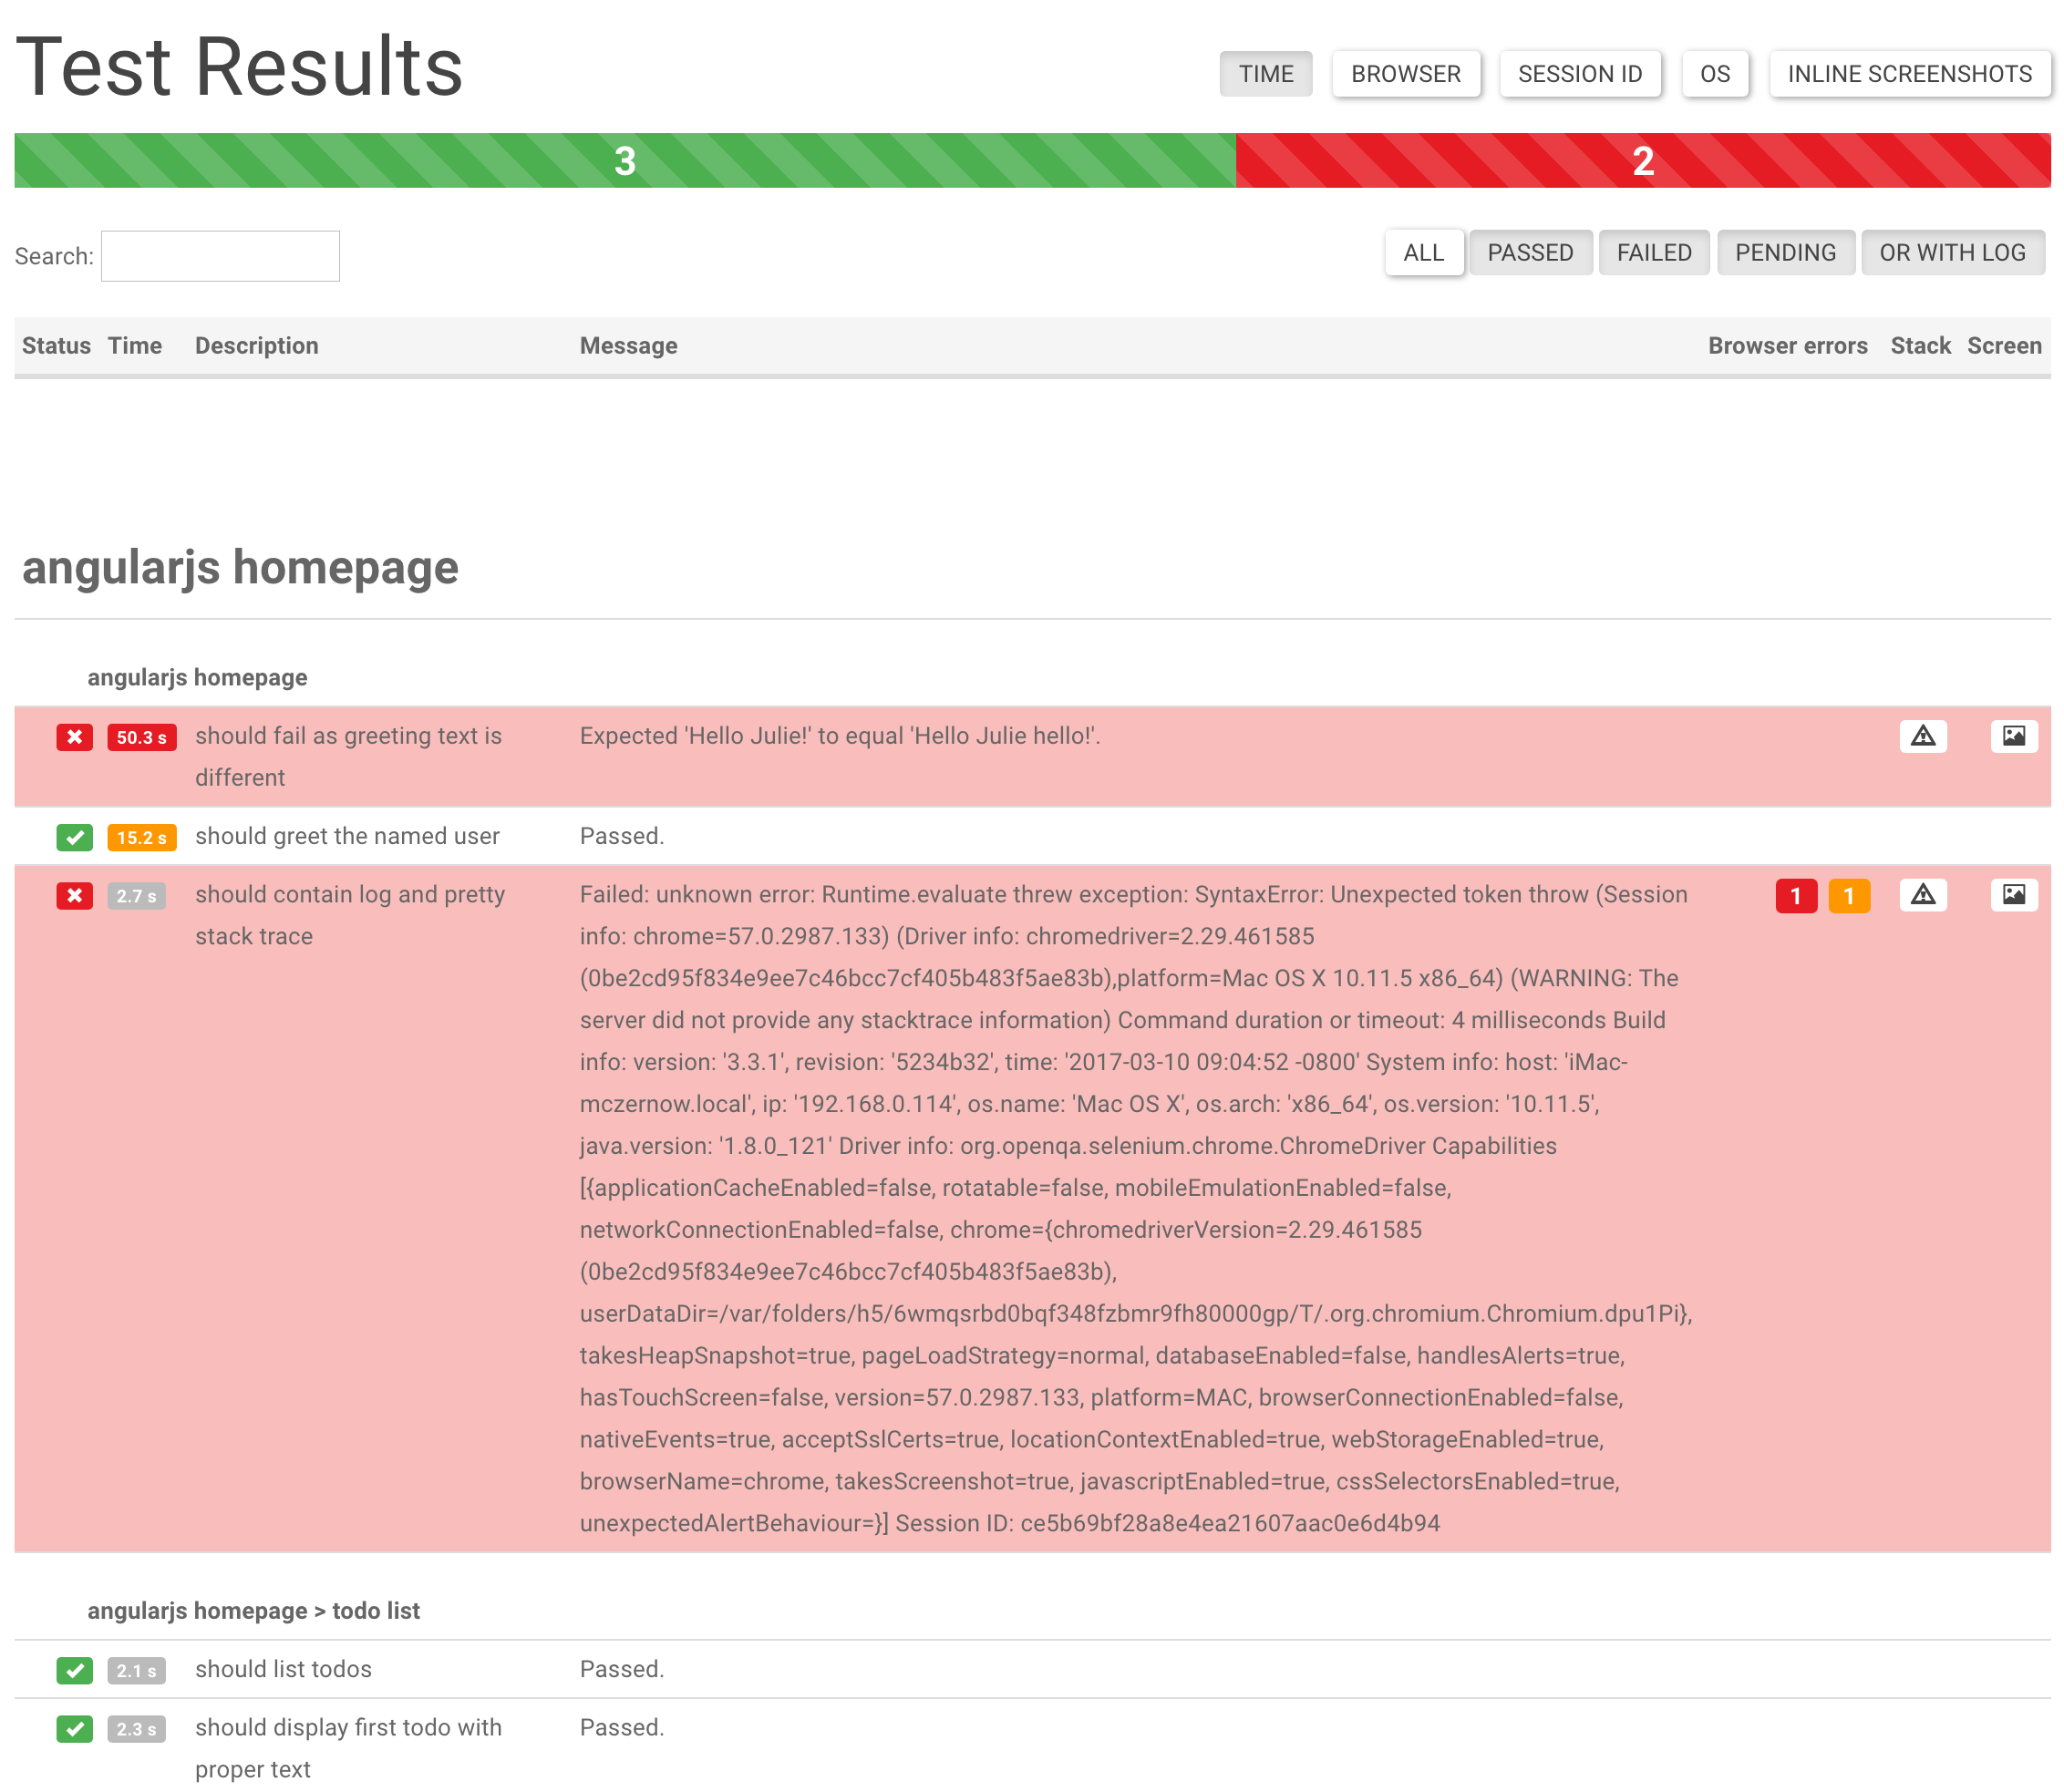
Angularized HTML Reporter with Screenshots for Protractor

HTML / Angular Test Report

IMPORTANT !

  • Jasmine 1 is no longer supported
  • If you get Error: TypeError: Cannot set property 'searchSettings' of undefined use at least version 1.2.7, where this bug has been fixed

Features

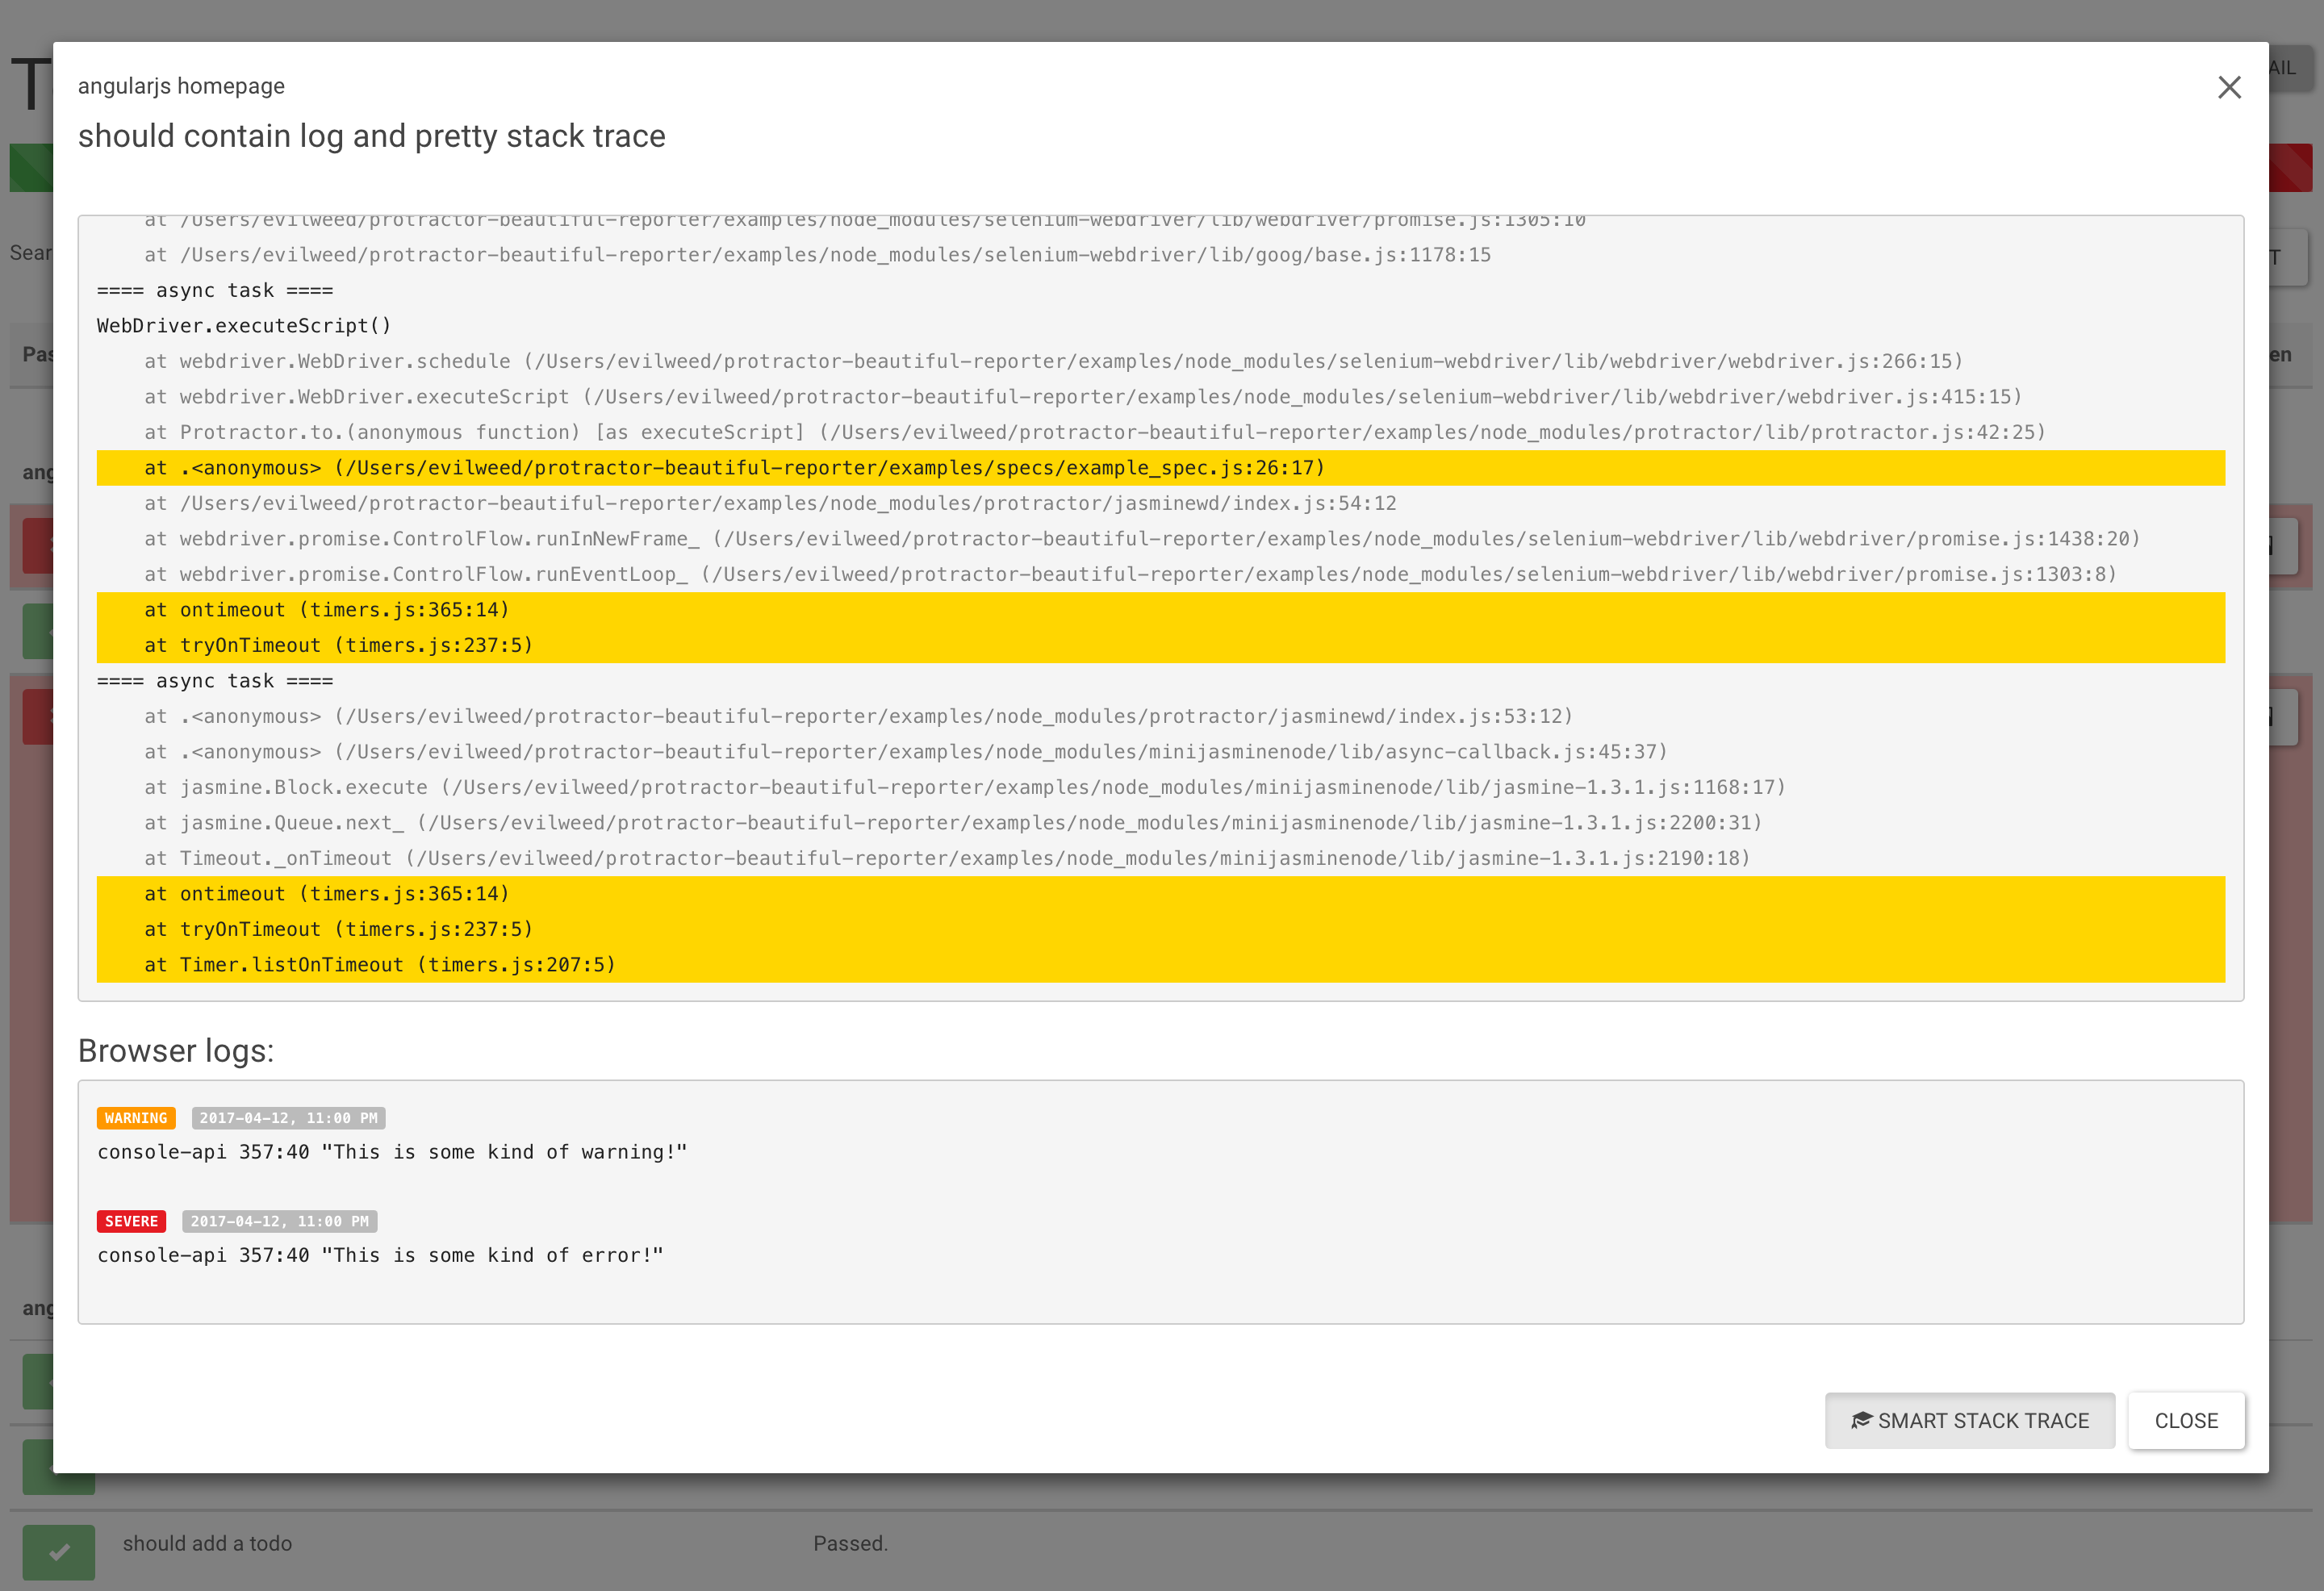
  • Browser's Logs (only for Chrome)
  • Stack Trace (with suspected line highlight)
  • Screenshot
  • Screenshot only on failed spec
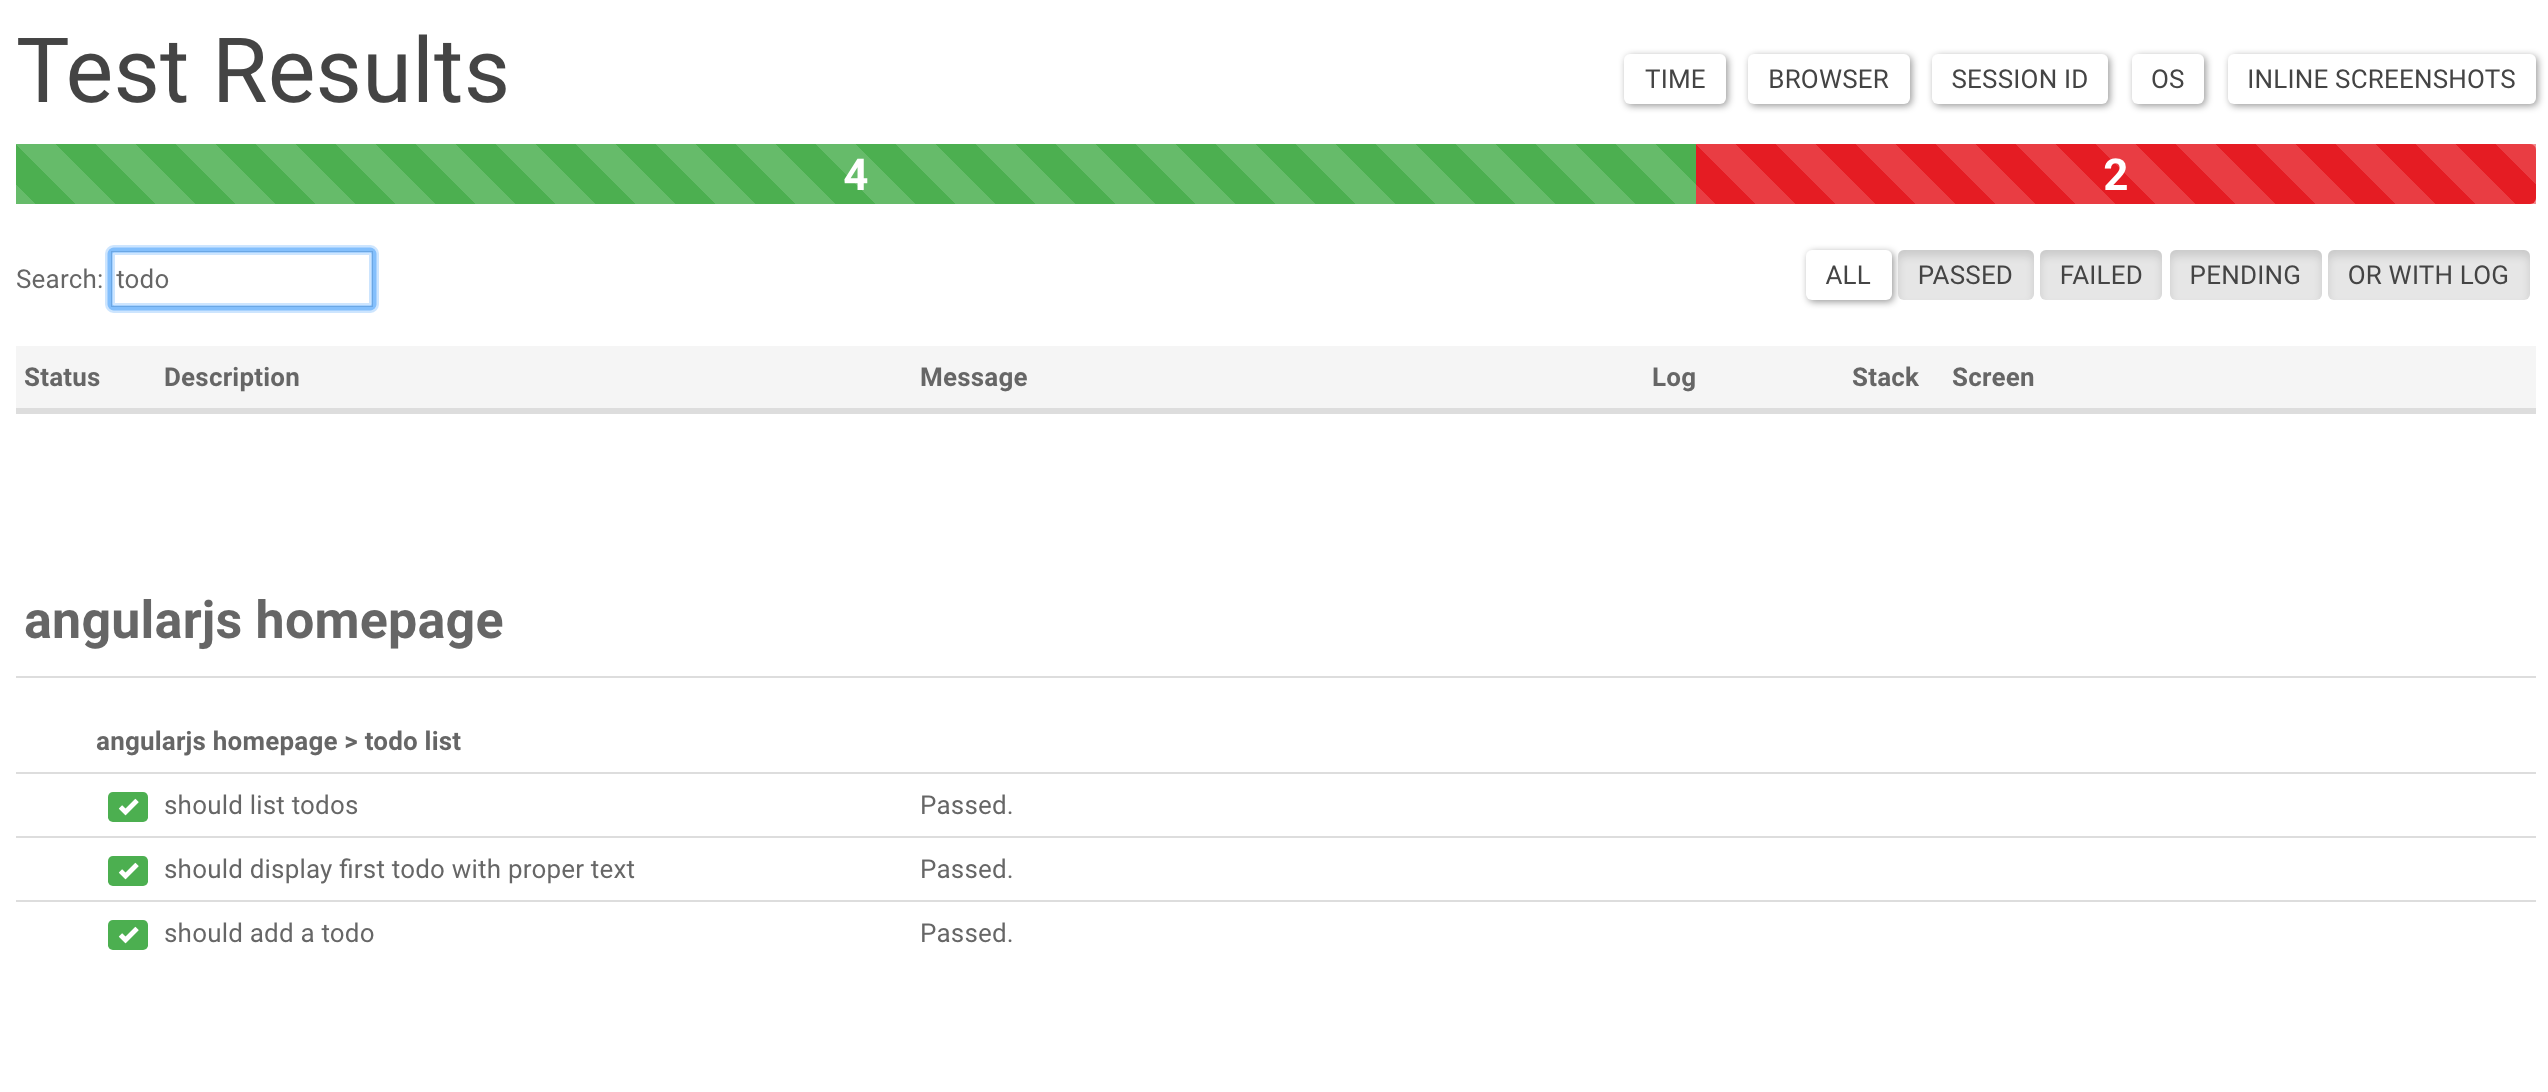
  • Search
  • Filters (can display only Passed/Failed/Pending/Has Browser Logs)
  • Inline Screenshots
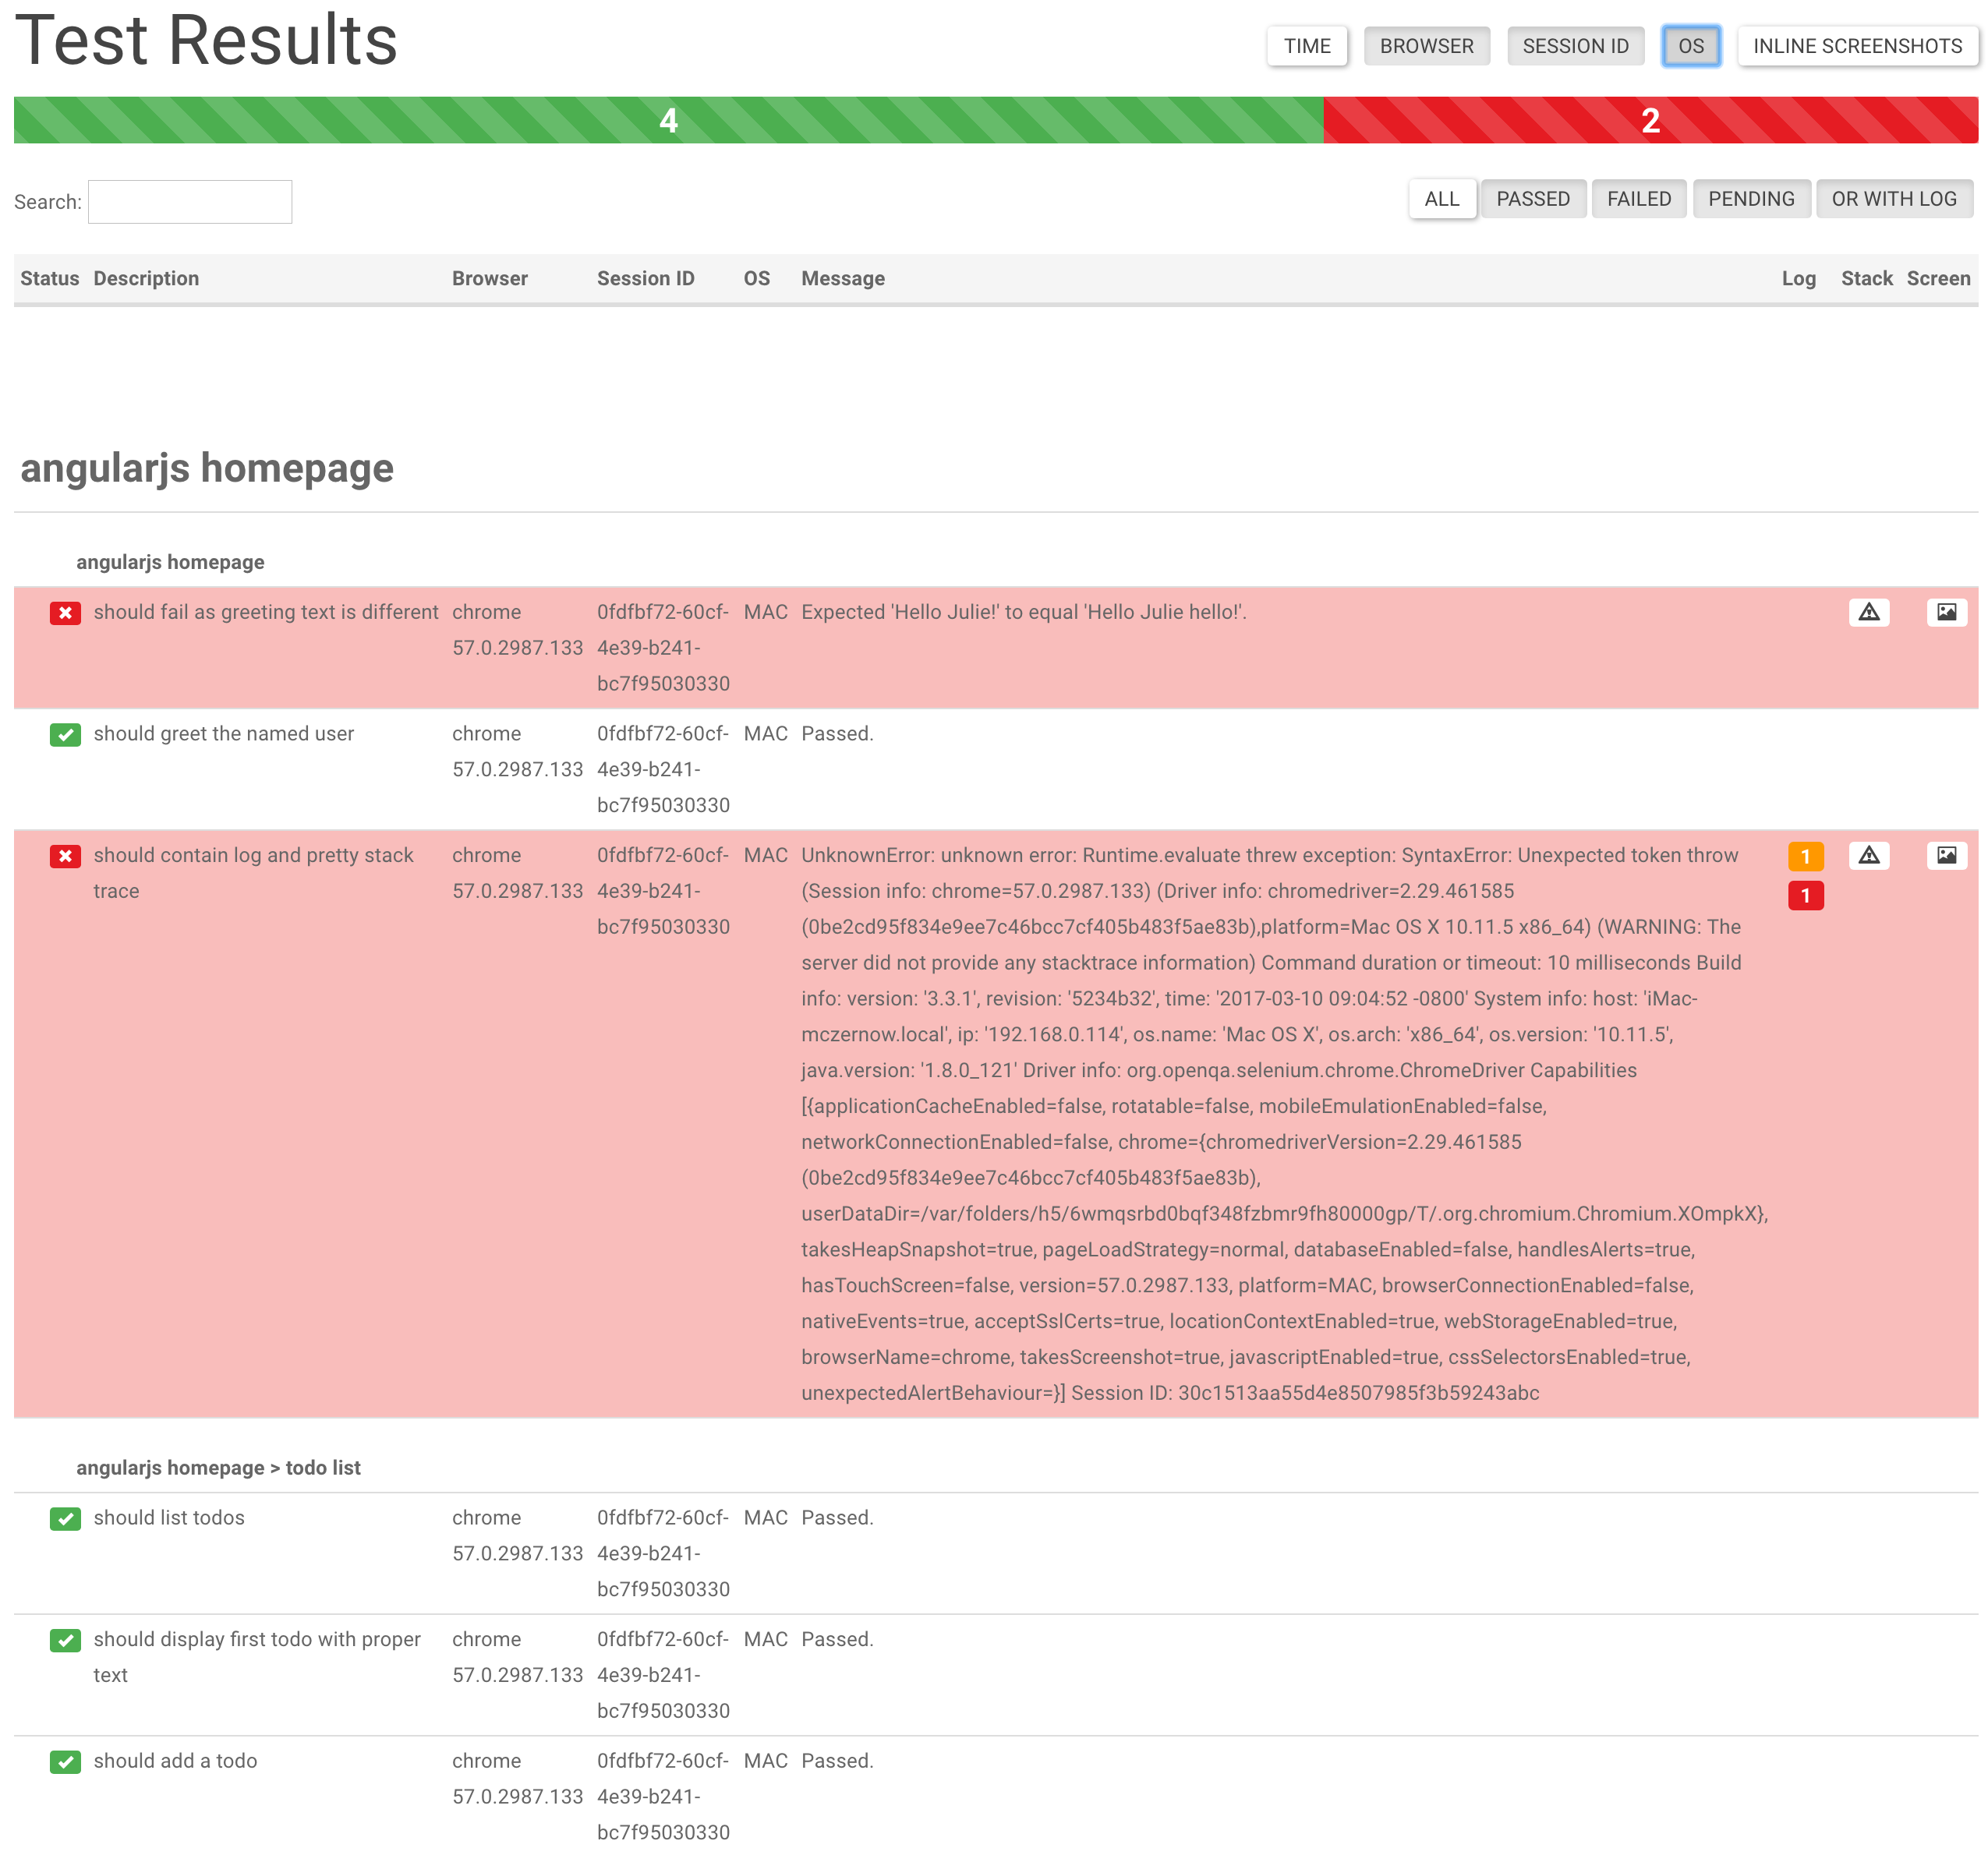
  • Details (Browser/Session ID/OS)
  • Duration time for test cases (only Jasmine2)

Wish list

  • HTML Dump

Need some feature? Let me know or code it and propose Pull Request :) But you might also look in our WIKI/FAQ where we present some solutions how you can enhance the reporter by yourself.

Known Limits

Does not work with protractor-retry or protractor-flake. The collection of results currently assumes only one continuous run.

Props

This is built on top of protractor-angular-screenshot-reporter, which is built on top of protractor-html-screenshot-reporter, which is built on top of protractor-screenshot-reporter.

protractor-beautiful-reporter still generates a HTML report, but it is Angular-based and improves on the original formatting.

Usage

The protractor-beautiful-reporter module is available via npm:

$ npm install protractor-beautiful-reporter --save-dev

In your Protractor configuration file, register protractor-beautiful-reporter in Jasmine.

Jasmine 1.x:

No longer supported

Jasmine 2.x:

Jasmine 2.x introduced changes to reporting that are not backwards compatible. To use protractor-beautiful-reporter with Jasmine 2, please make sure to use the getJasmine2Reporter() compatibility method introduced in [email protected].

var HtmlReporter = require('protractor-beautiful-reporter');

exports.config = {
   // your config here ...

   onPrepare: function() {
      // Add a screenshot reporter and store screenshots to `/tmp/screenshots`:
      jasmine.getEnv().addReporter(new HtmlReporter({
         baseDirectory: 'tmp/screenshots'
      }).getJasmine2Reporter());
   }
}

Configuration

Base Directory (mandatory)

You have to pass a directory path as parameter when creating a new instance of the screenshot reporter:

var reporter = new HtmlReporter({
   baseDirectory: 'tmp/screenshots'
});

If the given directory does not exists, it is created automatically as soon as a screenshot needs to be stored.

Path Builder (optional)

The function passed as second argument to the constructor is used to build up paths for screenshot files:

var path = require('path');

new HtmlReporter({
   baseDirectory: 'tmp/screenshots'
   , pathBuilder: function pathBuilder(spec, descriptions, results, capabilities) {
      // Return '<browser>/<specname>' as path for screenshots:
      // Example: 'firefox/list-should work'.
      return path.join(capabilities.caps_.browser, descriptions.join('-'));
   }
});

If you omit the path builder, a GUID is used by default instead.

Caution: The format/structure of these parameters (spec, descriptions, results, capabilities) differs between Jasmine 2.x and Jasmine 1.x.

Meta Data Builder (optional)

(removed because was only used in jasmine 1.x)

Jasmine2 Meta Data Builder (optional)

You can modify the contents of the JSON meta data file by passing a function jasmine2MetaDataBuilder as part of the options parameter. Note: We have to store and call the original jasmine2MetaDataBuilder also, else we break the "whole" reporter.

The example is a workaround for the jasmine quirk angular/jasminewd#32 which reports pending() as failed.

var originalJasmine2MetaDataBuilder = new HtmlReporter({'baseDirectory': './'})["jasmine2MetaDataBuilder"];
jasmine.getEnv().addReporter(new HtmlReporter({
    baseDirectory: 'tmp/screenshots'
    jasmine2MetaDataBuilder: function (spec, descriptions, results, capabilities) {
        //filter for pendings with pending() function and "unfail" them
        if (results && results.failedExpectations && results.failedExpectations.length>0 && "Failed: => marked Pending" === results.failedExpectations[0].message) {
            results.pendingReason = "Marked Pending with pending()";
            results.status = "pending";
            results.failedExpectations = [];
        }
        //call the original method after my own mods
        return originalJasmine2MetaDataBuilder(spec, descriptions, results, capabilities);
    },
    preserveDirectory: false
}).getJasmine2Reporter());

Screenshots Subfolder (optional)

You can store all images in subfolder by using screenshotsSubfolder option:

new HtmlReporter({
   baseDirectory: 'tmp/screenshots'
   , screenshotsSubfolder: 'images'
});

If you omit this, all images will be stored in main folder.

JSONs Subfolder (optional)

You can store all JSONs in subfolder by using jsonsSubfolder option:

new HtmlReporter({
   baseDirectory: 'tmp/screenshots'
   , jsonsSubfolder: 'jsons'
});

If you omit this, all images will be stored in main folder.

Sort function (optional)

You can change default sortFunction option:

new HtmlReporter({
   baseDirectory: 'tmp/screenshots'
   , sortFunction: function sortFunction(a, b) {
         if (a.cachedBase === undefined) {
             var aTemp = a.description.split('|').reverse();
             a.cachedBase = aTemp.slice(0).slice(0,-1);
             a.cachedName = aTemp.slice(0).join('');
         };
         if (b.cachedBase === undefined) {
             var bTemp = b.description.split('|').reverse();
             b.cachedBase = bTemp.slice(0).slice(0,-1);
             b.cachedName = bTemp.slice(0).join('');
         };
    
         var firstBase = a.cachedBase;
         var secondBase = b.cachedBase;
    
         for (var i = 0; i < firstBase.length || i < secondBase.length; i++) {
    
             if (firstBase[i] === undefined) { return -1; }
             if (secondBase[i] === undefined) { return 1; }
             if (firstBase[i].localeCompare(secondBase[i]) === 0) { continue; }
             return firstBase[i].localeCompare(secondBase[i]);
         }
    
         var firstTimestamp = a.timestamp;
         var secondTimestamp = b.timestamp;
    
         if(firstTimestamp < secondTimestamp) return -1;
         else return 1;
     }
});

If you omit this, all specs will be sorted by timestamp (please be aware that sharded runs look ugly when sorted by default sort).

Alternatively if the result is not good enough in sharded test you can try and sort by instanceId (for now it's process.pid) first:

function sortFunction(a, b) {
    if (a.instanceId < b.instanceId) return -1;
    else if (a.instanceId > b.instanceId) return 1;

    if (a.timestamp < b.timestamp) return -1;
    else if (a.timestamp > b.timestamp) return 1;

    return 0;
}

Exclude report for skipped test cases (optional)

You can set excludeSkippedSpecs to true to exclude reporting skipped test cases entirely.

new HtmlReporter({
  baseDirectory: `tmp/screenshots`
  , excludeSkippedSpecs: true
});

Default is false.

Screenshots for skipped test cases (optional)

You can define if you want report screenshots from skipped test cases using the takeScreenShotsForSkippedSpecs option:

new HtmlReporter({
   baseDirectory: 'tmp/screenshots'
   , takeScreenShotsForSkippedSpecs: true
});

Default is false.

Screenshots only for failed test cases (optional)

Also you can define if you want capture screenshots only from failed test cases using the takeScreenShotsOnlyForFailedSpecs: option:

new HtmlReporter({
   baseDirectory: 'tmp/screenshots'
   , takeScreenShotsOnlyForFailedSpecs: true
});

If you set the value to true, the reporter for the passed test will still be generated, but, there will be no screenshot.

Default is false.

Disable all screenshots

If you want no screenshots at all, set the disableScreenshots option to true.

new HtmlReporter({
   baseDirectory: 'tmp/reports'    
   , disableScreenshots: true
});

Default is false.

Add title for the html report (optional)

Also you can define a document title for the html report generated using the docTitle: option:

new HtmlReporter({
   baseDirectory: 'tmp/screenshots'
   , docTitle: 'my reporter'
});

Default is Test results.

Change html report file name (optional)

Also you can change document name for the html report generated using the docName: option:

new HtmlReporter({
   baseDirectory: 'tmp/screenshots'
   , docName: 'index.html'
});

Default is report.html.

Option to override CSS file used in reporter (optional)

You can change stylesheet used for the html report generated using the cssOverrideFile: option:

new HtmlReporter({
   baseDirectory: 'tmp/screenshots'
   , cssOverrideFile: 'css/style.css'
});

Add custom css inline

If you want to add small customizations without replaceing the whole css file:

new HtmlReporter({
   baseDirectory: 'tmp/screenshots'
   customCssInline:`
.mediumColumn:not([ng-class]) {
   white-space: pre-wrap;
}
`
});

This example will enable line-wrapping if the tests spec contains newline characters

Preserve base directory (optional)

You can preserve (or clear) the base directory using preserveDirectory: option:

new HtmlReporter({
   baseDirectory: 'tmp/screenshots'
   , preserveDirectory: false
});

Default is true.

Store Browser logs (optional)

You can gather browser logs using gatherBrowserLogs: option:

new HtmlReporter({
   baseDirectory: 'tmp/screenshots'
   , gatherBrowserLogs: false
});

Default is true.

Customize default search settings

If you do not want all buttons in the search filter pressed by default you can modify the default state via searchSettings: option:

For example: We filter out all passed tests when report page is opened

new HtmlReporter({
   baseDirectory: 'tmp/screenshots'
   , clientDefaults:{
       searchSettings:{
           allselected: false,
           passed: false,
           failed: true,
           pending: true,
           withLog: true
       }
   }
});

Default is every option is set to true

Customize default column settings

If you do not want to show all columns by default you can modify the default choice via columnSettings: option:

For example: We only want the time column by default

new HtmlReporter({
   baseDirectory: 'tmp/screenshots'
   , clientDefaults:{
      columnSettings:{
          displayTime:true,
          displayBrowser:false,
          displaySessionId:false,
          displayOS:false,
          inlineScreenshots:false
      }
   }     
});

Default is every option except inlineScreenshots is set to true

Additionally you can customize the time values for coloring the time column. For example if you want to mark the time orange when the test took longer than 1 second and red when the test took longer than 1.5 seconds add the following to columnSettings (values are in milliseconds scale):

   new HtmlReporter({
      baseDirectory: 'tmp/screenshots'
      , clientDefaults:{
         columnSettings:{
            warningTime: 1000,
            dangerTime: 1500
         }
      }     
   });

Show total duration of test execution

If you want to show the total duration in the header or footer area...

  new HtmlReporter({
     baseDirectory: 'reports'
     , clientDefaults:{
         showTotalDurationIn: "header",                  
         totalDurationFormat: "hms"            
     }     
  });

For all possible values for showTotalDurationIn and totalDurationFormat refer to the wiki entry Options for showing total duration of e2e test

Load spec results via ajax

By default the raw data of all tests results from the e2e session are embedded in the main javascript file (array results in app.js). If you add useAjax:true to clientDefaults the data is not embedded in the app.js but is loaded from the file combined.json which contains all the raw test results.

Currently the reason for this feature is a better testability in unit tests. But you could benefit from ajax loading, if you want to polish/postprocess tests results (e.g. filter duplicated test results). This would not be possible if the data is embedded in the app.js file.

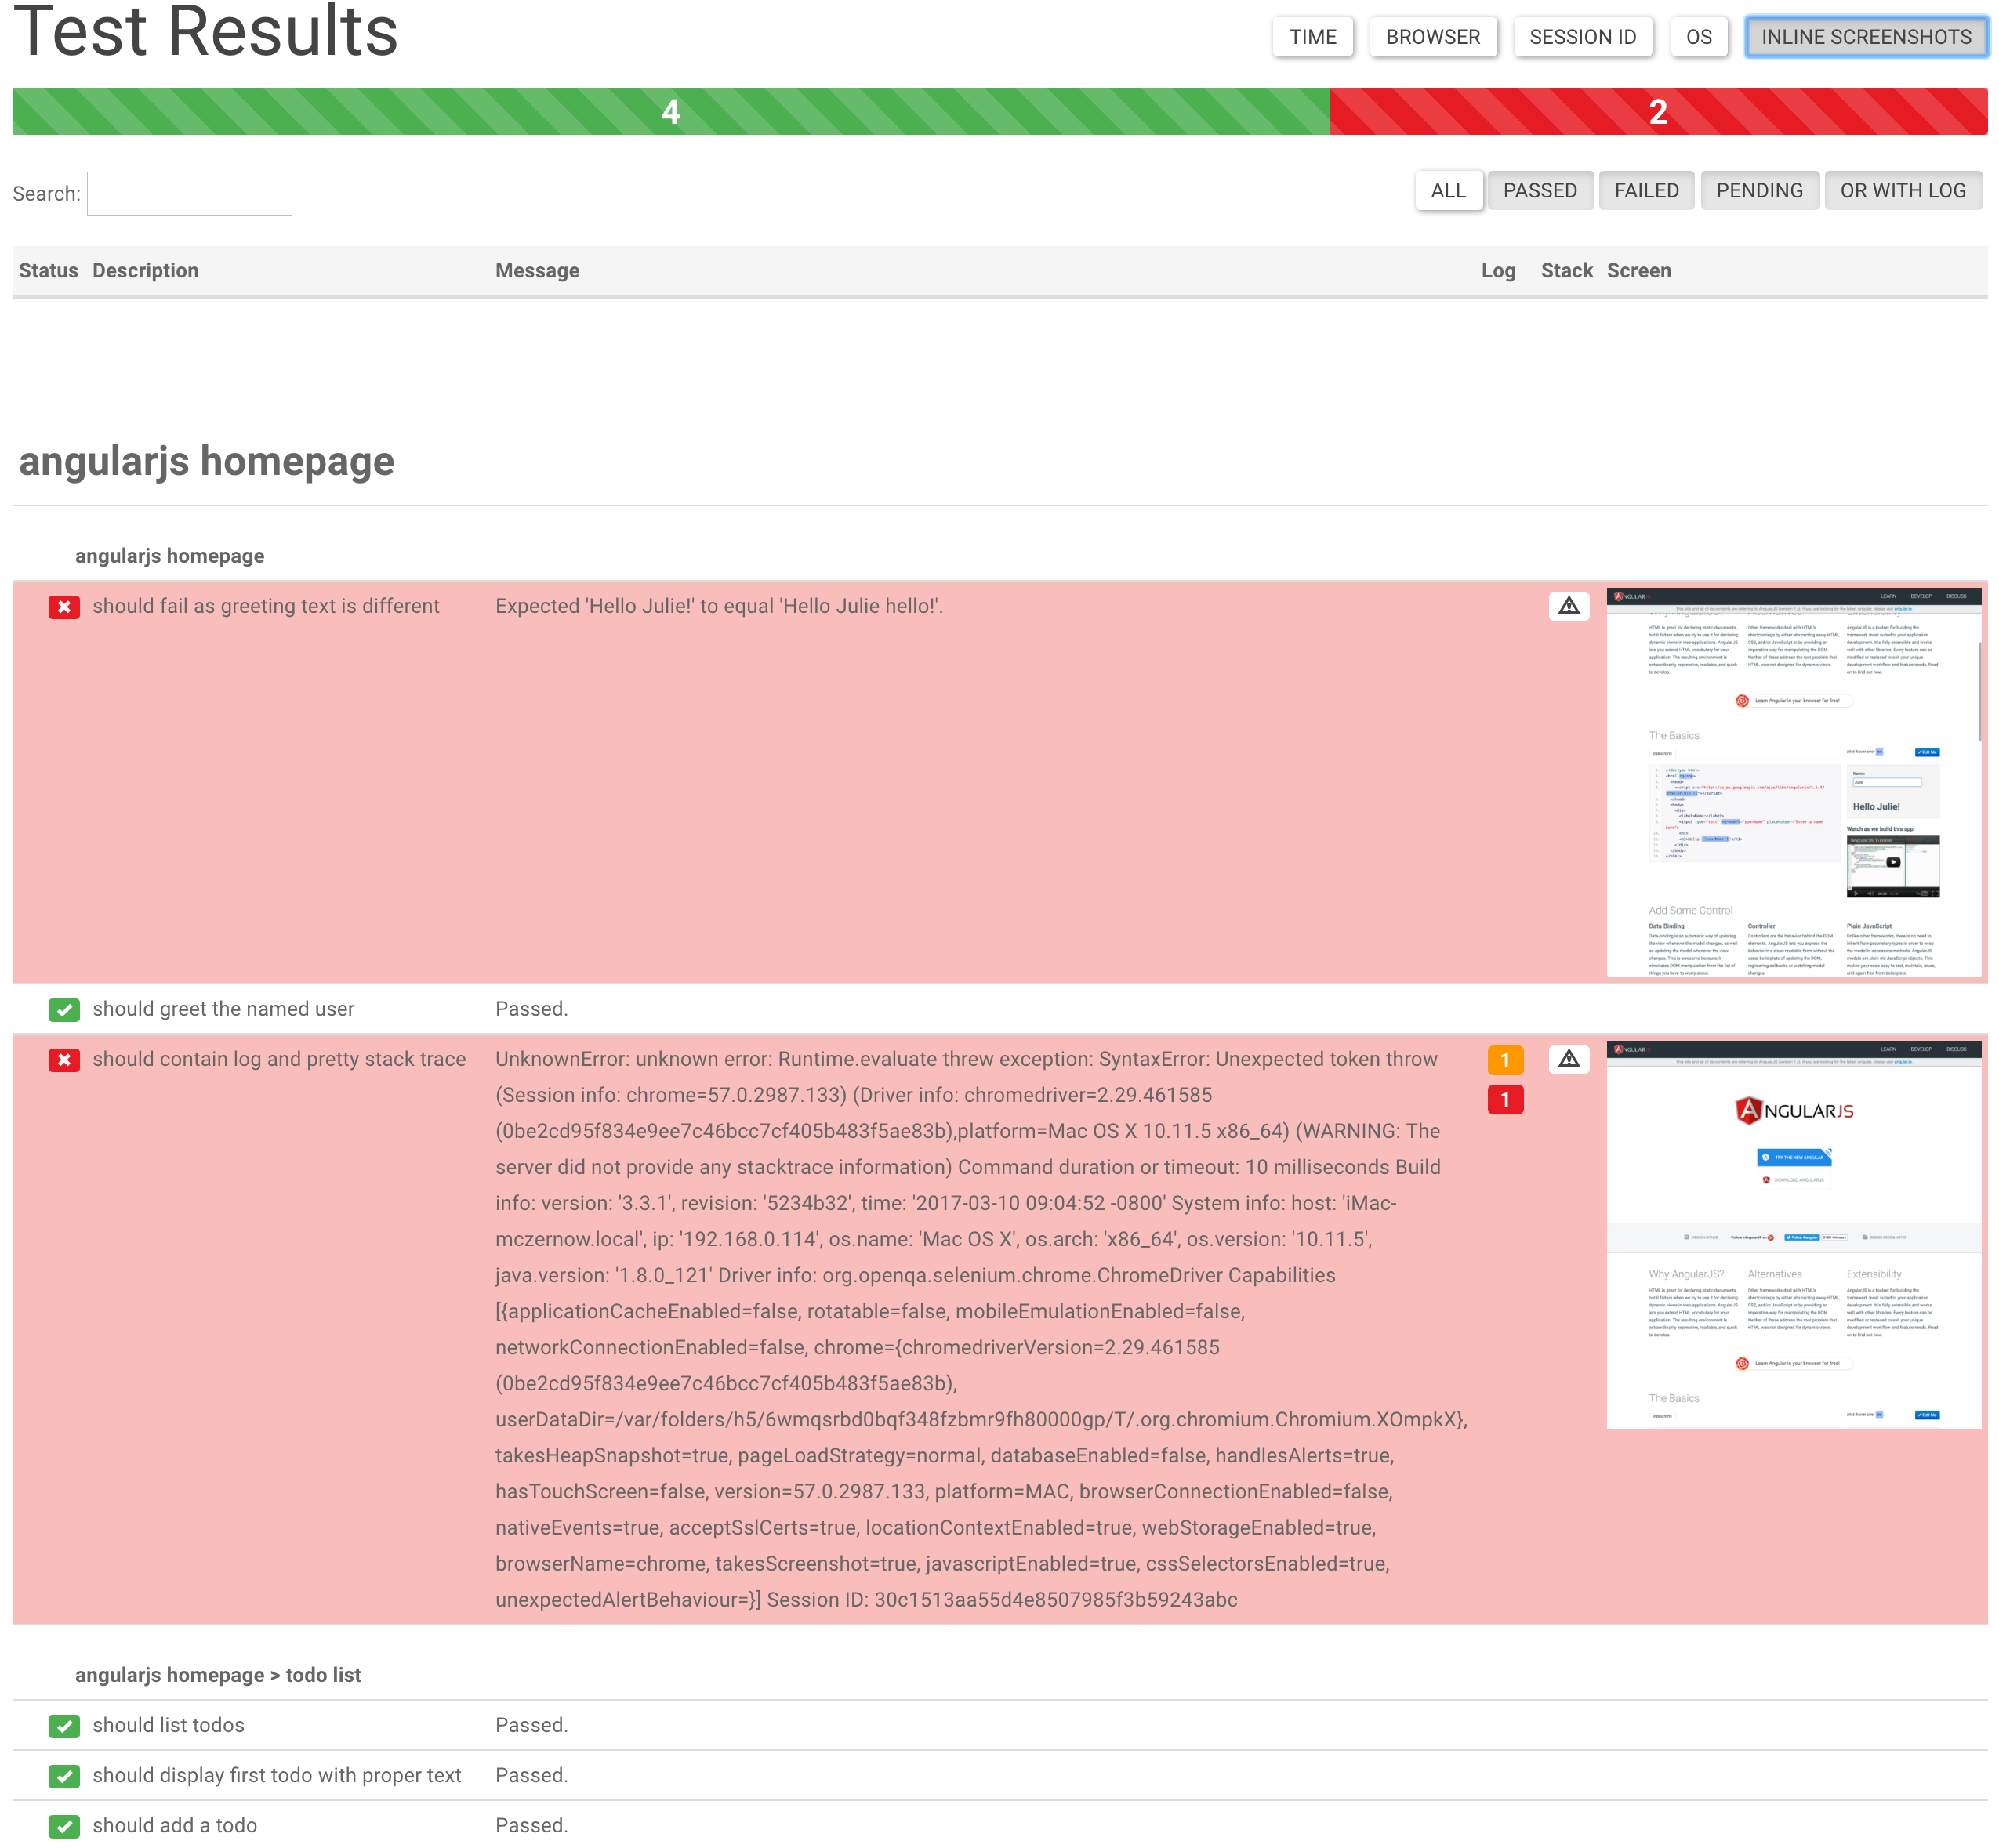
HTML Reporter

Upon running Protractor tests with the above config, the screenshot reporter will generate JSON and PNG files for each test.

In addition, a small HTML/Angular app is copied to the output directory, which cleanly lists the test results, any errors (with stacktraces), and screenshots.

HTML / Angular Test Report

Click More Details to see more information about the test runs.

Click More Details

Use Search Input Field to narrow down test list.

View Search

Click View Stacktrace to see details of the error (if the test failed). Suspected line is highlighted.

Click View Browser Log to see Browser Log (collects browser logs also from passed tests)

View Stacktrace

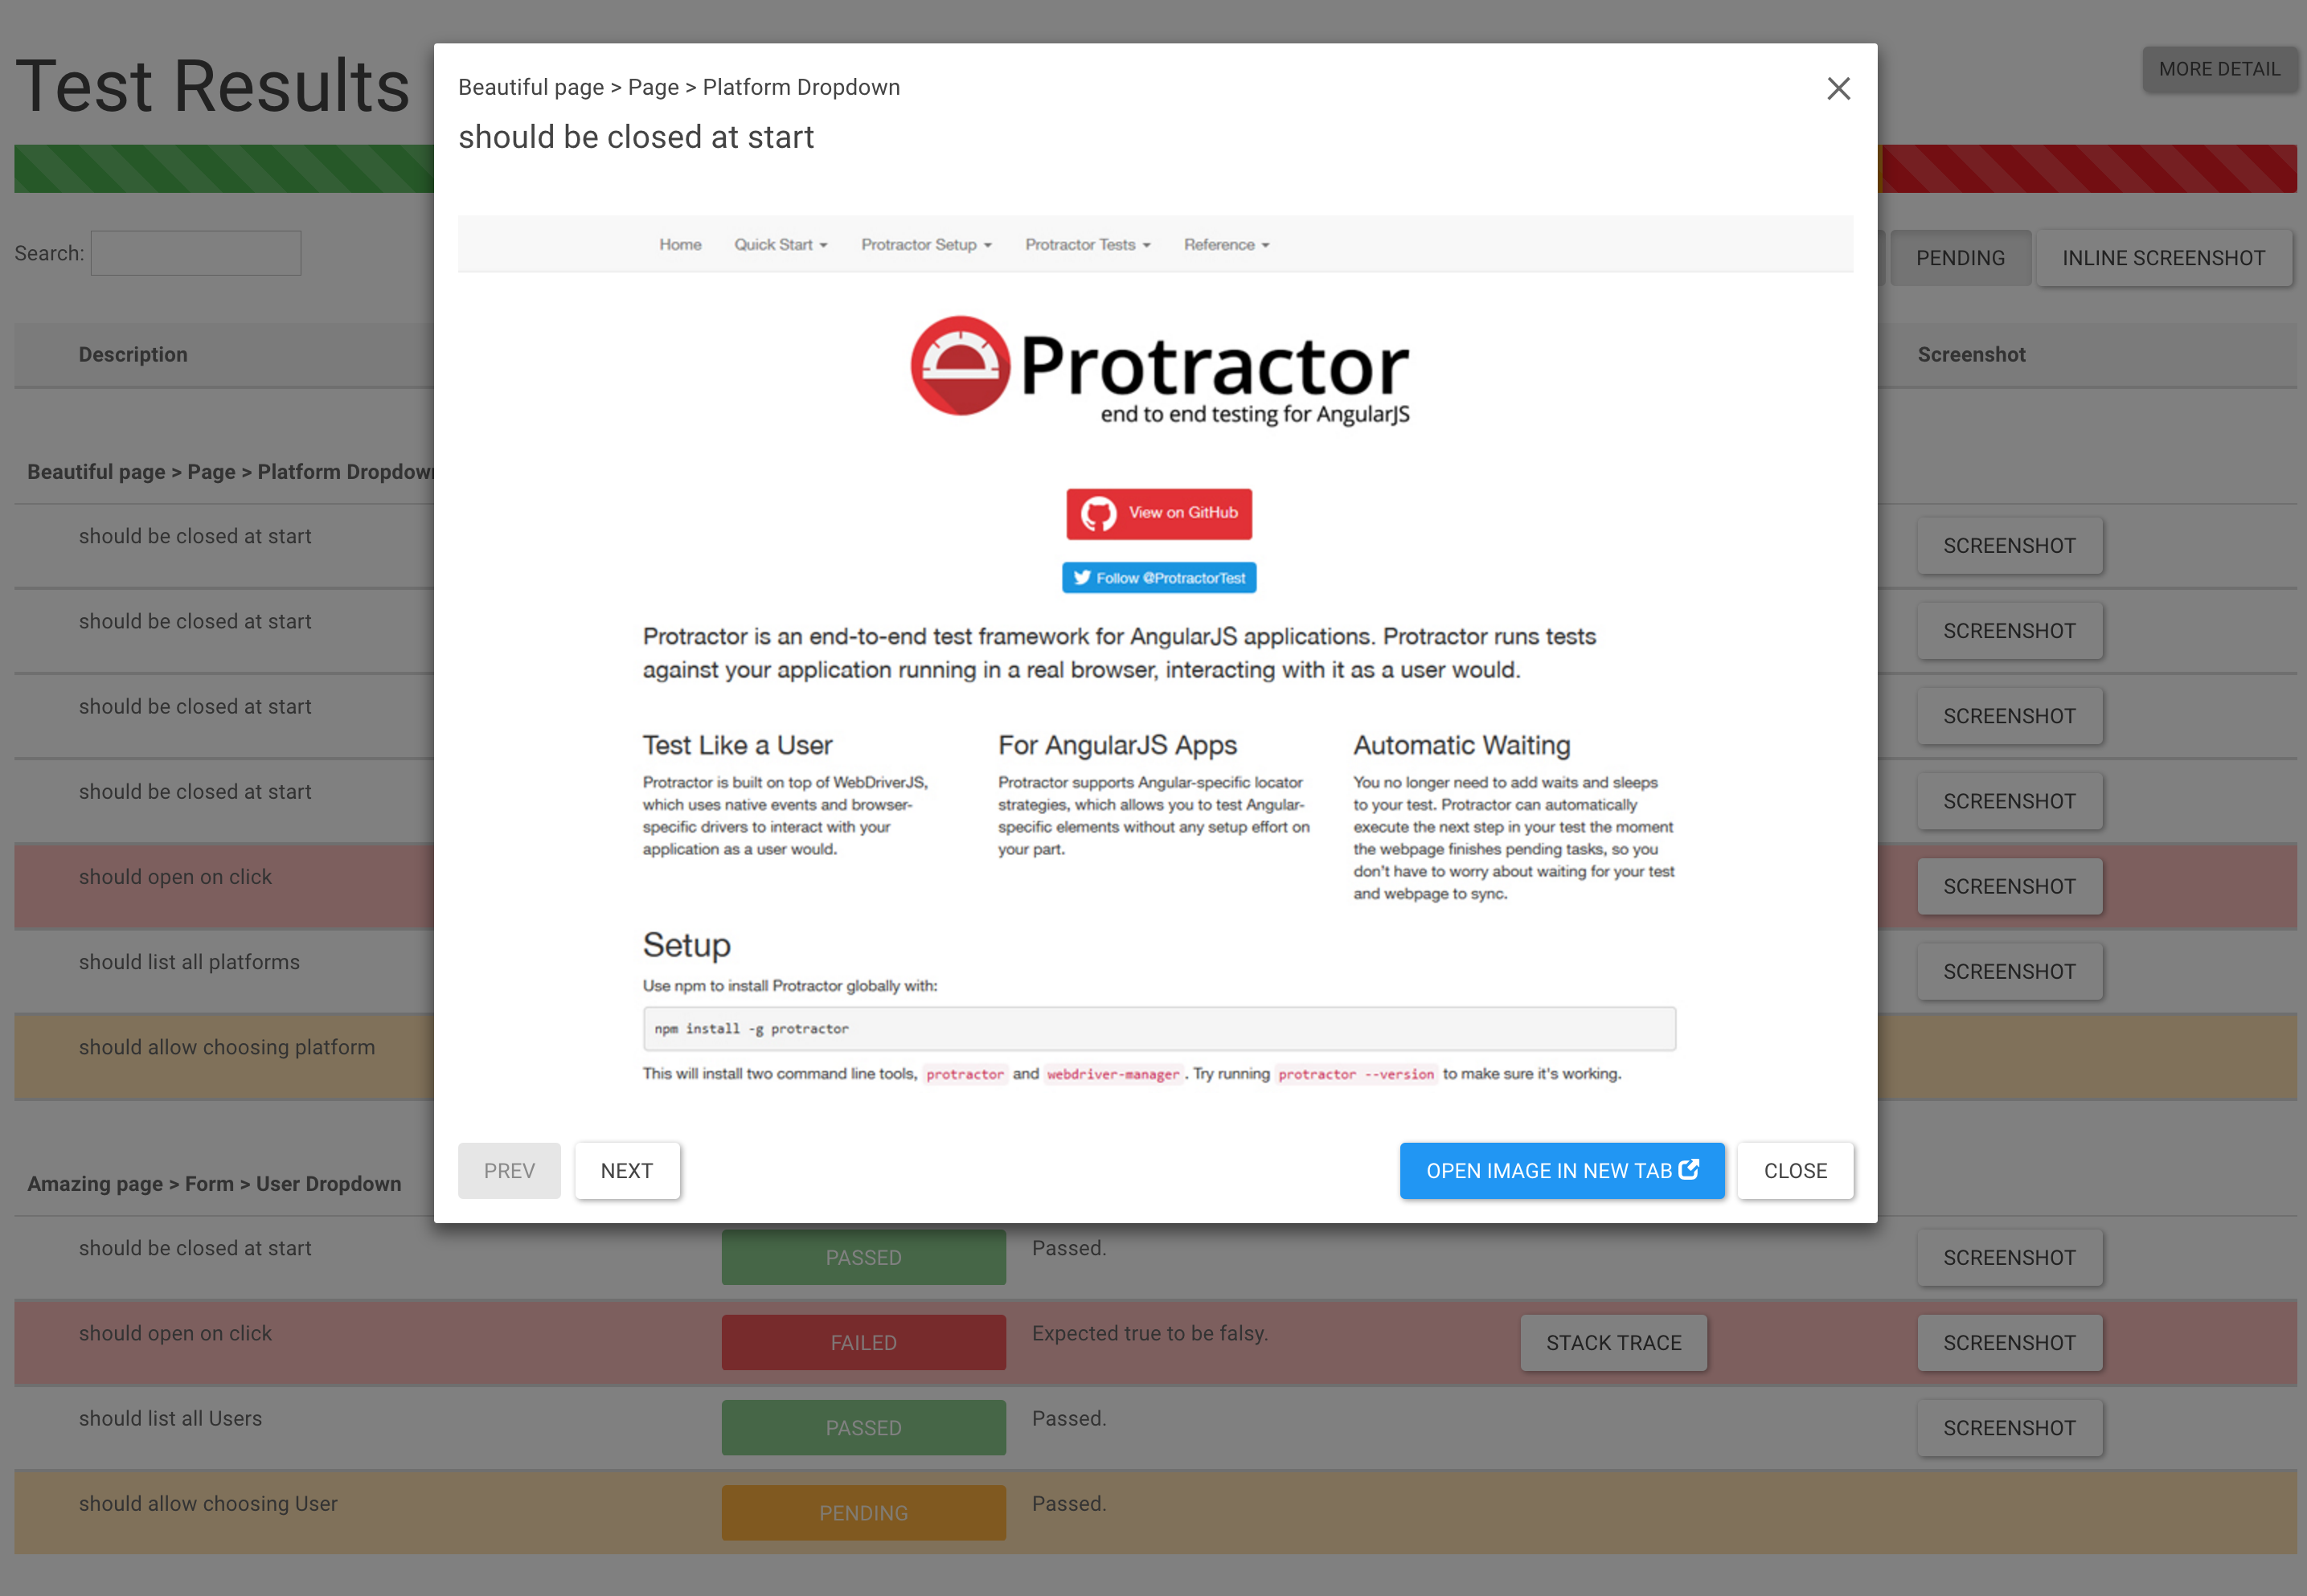
Click View Screenshot to see an image of the webpage at the end of the test.

View Inline Screenshot

Click Inline Screenshots to see an inline screenshots in HTML report.

View Inline Screenshot

Please see the examples folder for sample usage.

To run the sample, execute the following commands in the examples folder

$ npm install
$ protractor protractor.conf.js

After the test run, you can see that, a screenshots folder will be created with all the reports generated.

Donate

You like it? You can buy me a cup of coffee/glass of beer :)

paypal

License

Copyright (c) 2017 Marcin Cierpicki [email protected]

Permission is hereby granted, free of charge, to any person obtaining a copy of this software and associated documentation files (the "Software"), to deal in the Software without restriction, including without limitation the rights to use, copy, modify, merge, publish, distribute, sublicense, and/or sell copies of the Software, and to permit persons to whom the Software is furnished to do so, subject to the following conditions:

The above copyright notice and this permission notice shall be included in all copies or substantial portions of the Software.

Cross-browser Testing <3 Provided by Supported by Sauce

protractor-beautiful-reporter's People

Contributors

alecxe avatar bbridges avatar bcole avatar bertrandom avatar brian-dawson-nerdery avatar elgalu avatar evilweed avatar fdim avatar fencim avatar glae avatar jbeef710 avatar jintoppy avatar jitinsharma avatar keymandll avatar laurentgoudet avatar miller45 avatar prayerslayer avatar salgadob avatar sdohle avatar terrymooreii avatar toupeira avatar underscorebrody avatar voodoo-chile avatar

Stargazers

 avatar  avatar  avatar  avatar  avatar  avatar  avatar  avatar  avatar  avatar  avatar  avatar  avatar  avatar  avatar  avatar  avatar  avatar  avatar  avatar  avatar  avatar  avatar  avatar  avatar  avatar  avatar  avatar  avatar  avatar  avatar  avatar  avatar  avatar  avatar  avatar  avatar  avatar  avatar  avatar  avatar  avatar  avatar  avatar  avatar  avatar  avatar  avatar  avatar  avatar  avatar  avatar  avatar  avatar  avatar  avatar  avatar  avatar  avatar  avatar  avatar  avatar  avatar  avatar  avatar  avatar  avatar  avatar  avatar  avatar  avatar  avatar  avatar  avatar  avatar  avatar  avatar  avatar  avatar  avatar  avatar  avatar  avatar  avatar  avatar  avatar  avatar  avatar  avatar  avatar  avatar  avatar  avatar  avatar  avatar  avatar  avatar  avatar  avatar  avatar

Watchers

 avatar  avatar  avatar  avatar  avatar  avatar  avatar  avatar  avatar  avatar  avatar  avatar  avatar

protractor-beautiful-reporter's Issues

With many fails in test much are not reported

test structure to reproduce:

describe() {
  beforeAll()
    it()
    it()
}
describe() {
  beforeAll()
    it()
    it()
}
... // same after

error in logs:

Error: EADDRINUSE connect EADDRINUSE 127.0.0.1:28226
....
From: Task: WebDriver.manage().logs().get(browser)
    at Driver.schedule (D:\tc\ba2\work\a5d9398c7ec5eb82\node_modules\selenium-webdriver\lib\webdriver.js:807:17)
    at Logs.get (D:\tc\ba2\work\a5d9398c7ec5eb82\node_modules\selenium-webdriver\lib\webdriver.js:1731:25)
    at Jasmine2Reporter._callee7$ (D:\tc\ba2\work\a5d9398c7ec5eb82\node_modules\protractor-beautiful-reporter\index.js:4897:64)
    at tryCatch (D:\tc\ba2\work\a5d9398c7ec5eb82\node_modules\protractor-beautiful-reporter\index.js:5377:40)
    at Generator.invoke [as _invoke] (D:\tc\ba2\work\a5d9398c7ec5eb82\node_modules\protractor-beautiful-reporter\index.js:5651:22)
    at Generator.prototype.(anonymous function) [as next] (D:\tc\ba2\work\a5d9398c7ec5eb82\node_modules\protractor-beautiful-reporter\index.js:5410:21)
    at step (D:\tc\ba2\work\a5d9398c7ec5eb82\node_modules\protractor-beautiful-reporter\index.js:4481:191)
    at D:\tc\ba2\work\a5d9398c7ec5eb82\node_modules\protractor-beautiful-reporter\index.js:4481:361

...
Error
    at Jasmine2Reporter.jasmineStarted (D:\tc\ba2\work\a5d9398c7ec5eb82\node_modules\protractor-beautiful-reporter\index.js:4691:13)
    at dispatch (D:\tc\ba2\work\a5d9398c7ec5eb82\node_modules\jasmine-core\lib\jasmine-core\jasmine.js:4366:28)
...

Missing paranthesis.

I get this error when running ng e2e after installation of protractor-beautiful-reporter.

node_modules\protractor-beautiful-reporter\index.js:205
        this._addTaskToFlow(async () => this._suiteNames.push(result.description));
                                  ^
SyntaxError: Unexpected token (
    at createScript (vm.js:56:10)

Not fully e2e tested

Pass/Fail counts reported as 24 - should be 30

Example code

/* protractor.conf.js */

multiCapabilities: [
  {
    browserName: 'chrome',
    count: 5
  },
  {
    browserName: 'firefox',
    count: 5
  }
]
Specs: 3

The runner process is reported as "24" and not "30" as it should. How to fix it?

I get an error

I/runnerCli - ENOENT: no such file or directory, stat 'C:\**\dist\report\assets\bootstrap.css'
E/launcher - Runner process exited unexpectedly with error code: 1

System

protractor-beautiful-reporter: 1.2.0
protractor: 5.3.0
standalone: 3.9.1
platform: win10

Empty Report on Jenkins

Hi @Evilweed ,

Locally the html report works correctly.
In Jenkins app.js file the this.results was empty array.
combined.json has the test run data inside.

When loading the file from Jenkins HTML publish that the report loads but does not fetch correctly
http://<domain-name>/jenkins/view/<view-name>/job/<job-name>/HTML_Report/%7B%7Bresult.screenShotFile%7D%7D
Request Method:GET
Status Code:404 Not Found

I am using:

   jasmine.getEnv().addReporter(new HtmlReporter({
      baseDirectory: 'e2e/screenShots',
      takeScreenShotsForSkippedSpecs: true,
      docName: 'index.html'
    }).getJasmine2Reporter());

how to take screenshot on failure step, not in afterEach method

I am always getting screentshot of the page which is defind in afterEach method.

how to take screenshot on failure step, not in afterEach method. below is my sample code

  beforeAll(function () {
    jasmine.DEFAULT_TIMEOUT_INTERVAL = protractorConf.timeouts.extendedDefaultTimeoutInterval;
  });

  beforeEach(function (done) {
    setTimeout(function () {
      browser.waitForAngular();

      expect(browser.getCurrentUrl()).toContain('/login');
      done();
    }, protractorConf.timeouts.pageResolveTimeout);
  });

  afterEach(function (done) {
    setTimeout(function () {
      browser.waitForAngular();
      page.main.doAccountAction('logout');//always screenshot of this page is stored, doesn't matter whether test is pass or fail
      done();
    }, protractorConf.timeouts.pageResolveTimeout);
  });

  afterAll(function () {
    browser.executeScript('window.ss.clear();');
    browser.executeScript('window.ss.clear();');
  });

  using(dataProvider, function (data, description) {
    it('should check ' + description, () => {
        loginPage.loginAs(data.user);
        navigateToDefaultSubCategory();

        // Validate presence of Create Button
        element(page.analysisElems.addAnalysisBtn.isDisplayed().then(function (isVisible) {
          expect(isVisible).toBe(data.create,
            "Create button expected to be " + data.create + " on Analyze Page, but was " + !data.create);
        }));
})
});

IE issue with progressbar

Internet Explorer does not render the progress-bar on top of the page correctly.
As you can see in the screenshot below, 500+ Tests were executed successfully, but the progress-bar is 100% red. Overall, the progress-bar is not as beautiful as in other browsers.

I figured out, that IE does not support the following code:

<div style="width: {{someAngularExpression()}}"></div>

instead one must use

<div ng-style="{'width': someAngularExpression()}"></div>
<!-- OR -->
<div ng-attr-style="width: {{someAngularExpression()}}"></div>

as described in github angularjs issue and demonstrated in this plunker

I'm planning to submit a PR later this day

protractor-beautiful-reporter ie11-error

For loop breaks reporter to duplicate view.

code:

describe("header", () => {
   for (let i = 1; i < 4; i++) {
      describe("step", () =>...
   }
}

Report result:

header
step
header
step
header
step

Expected result:

header
step
step
step

Changing HTML Report Template

How can I use a custom HTML template? For example, I want to remove the GitHub link/icon shown at the end of the report.

Takes a long time to generate report with lots of pending specs

Hello,

In this case, with about 950 tests not running (because one suite was focused with an fdescribe) it takes nearly 30 seconds at the end of the run to generate the report. It appears a json file is being made for each one.

I'd imagine the way to make this faster is either an option to not report on pending specs at all, or to not have to do so much I/O when going through a lot of pending specs.

Sowing inconsistent specs count intermittently

I have two test1-spec.js and test2-spec.js file. I have spotted wrong specs count showing on the report When I ran them .

Issue1# I ran both file and it showing the less count by 1. It showing all spec-1 count into the report as compared to the console count.

Issue2: When I disabled some test suite(xdescribe) and reran the test suite. Then showing very strange count. It does not match with the previous report . Again I ran the test suite then it shows the same result as show very first time (less by 1).

for second issue - Is it not cleaning the directory or the test report before generating the new one ?

Step to reproduce the issue

1.Run the test from multiple test-specs.js files and see the test spec count
2.Now disable some test suite specs (xdescribe).
3.Re run the test (All specs file).
4.See the specs count into the newly generated report. It shows the wrong count.
5.Again re run it. It shows the different count.

Expected behavior : It should clean the previous report data and generate the clean report with correct count.It think it should be the default behavior .

Do you want any data for this issue ,As It does not generate any error or console message for this ?

performance / amount of write operations to disk

Quite a few times I see failures when reporter attempts to write combined data to disk with shardTestFiles: true option. After quick lookup it appears that all files (including fonts) are written to report dir after each spec.

Isn't this a bit excessive ? Wouldn't it be possible to 'bundle' everything up when the test is done using data in jsons folder?

The last test case is ignored in the report

After test run the result (PASS) of the last it within describe is absent in the report. In case when there is only one it then no report will be generated.

The environment is:

  • java version "1.8.0_151"
  • node version 8.8.1 (also was checked under 9.3.0)
  • protractor version 5.2.2 (also was checked against 5.1.2 and 5.2.0)
  • protractor-beautiful-reporter version is 0.5.6 (also was checked against 0.5.1 and 0.5.3)

The package.json is:

{
  "name": "prsample",
  "version": "0.0.1",
  "dependencies": {
    "protractor": "^5.2.2",
    "protractor-beautiful-reporter": "^0.5.6"
  }
}

The conf.js is:

exports.config = {
    framework: 'jasmine',
    seleniumAddress: 'http://localhost:4444/wd/hub',
    specs: ['spec.js'],
    onPrepare: function() {
        const HtmlReporter = require('protractor-beautiful-reporter');
        // Add a screenshot reporter and store screenshots to `/tmp/screenshots`:
        jasmine.getEnv().addReporter(new HtmlReporter({
            baseDirectory: 'tmp/screenshots'
        }).getJasmine2Reporter());
    }

};

The spec.js is:

describe('Protractor Demo App', function() {
    it('should have a title - 1', function() {
        browser.get('http://juliemr.github.io/protractor-demo/');

        expect(browser.getTitle()).toEqual('Super Calculator');
    });

    it('should have a title - 2', function() {
        browser.get('http://juliemr.github.io/protractor-demo/');

        expect(browser.getTitle()).toEqual('Super Calculator');
    });
});

Report not generating intermittently

I am seeing some times report does not generate even though all test case are passed.
It generated the combined.json file which has all the specs detail but index.html is empty. It did not throw any error while test were running, but still report not generated.

Please let me know how to get the log while running the test so that i can provide all error details for debugging.

I think this issue must be fixed as soon as possible, because report itself does not get generated

Environment details

Jasmine: 2.X - default version from protractor
Browser: Chrome
protractor-beautiful-reporter: 0.4.6

report not generated

Hello,

Sometimes, the report.html is empty and I do not understand why. It seems to be random.
Here is my protractor.conf.js :

var SpecReporter = require('jasmine-spec-reporter').SpecReporter;
var HtmlReporter = require('protractor-beautiful-reporter');

exports.config = {
  allScriptsTimeout: 11000,
  specs: [
  './e2e/**/*.e2e-spec.ts'
  ],
  capabilities: {
    'browserName': 'chrome'
  },
  directConnect: true,
  baseUrl: 'http://localhost:8080/',
  framework: 'jasmine2',
  jasmineNodeOpts: {
    showColors: true
  },
  suites: {
    login: 'e2e/login/**/*.e2e-spec.ts',
    servicesList: 'e2e/services/services-list/**/*.e2e-spec.ts',
    serviceOverview: 'e2e/services/service-overview/**/*.e2e-spec.ts',
    serviceDetail: 'e2e/services/service-detail/**/*.e2e-spec.ts',
    planning: 'e2e/services/**/*.e2e-spec.ts',
    signup: 'e2e/signup/**/*.e2e-spec.ts',
    newPermuteRequest: 'e2e/requests/new-request/new-permute-request/**/*.e2e-spec.ts',
  },
  useAllAngular2AppRoots: true,
  beforeLaunch: function() {
    require('ts-node').register({
      project: 'e2e'
    });
  },
  onPrepare: function() {
    jasmine.getEnv().addReporter(new SpecReporter());
    var protractorImageComparison = require('protractor-image-comparison');
    browser.driver.manage().window().setSize(375, 668);
    browser.driver.manage().window().setPosition(0, 0);
    browser.protractorImageComparison = new protractorImageComparison(
    {
      baselineFolder: 'e2e/screenshots_baseline',
      screenshotPath: 'e2e/screenshots_from_tests',
      autoSaveBaseline: true
    }
    );
    jasmine.getEnv().addReporter(new HtmlReporter({
      baseDirectory: 'reports/testsE2E',
      preserveDirectory: false
    }).getJasmine2Reporter());
  }
};

Thanks ! (I really like this package! ;) )

Query: Is it possible to override the screenshot in the report?

Not sure if this is possible, so thought I'd ask the question.

I have a situation where I am running an image comparison using "protractor-image-comparison" - if the comparison fails, then the other package will generate a diff image at a known location. Is there anyway to override this report so that I can tell it which image to include?

Add compatibility for UTF-8

Hi,
thanks for your work !
I encounter an issue where I need to have accented characters in my it description but the reports is failing with them :

image

Is there a way to fix this ?

Thanks in advance

sharded / parallel tests and sort order

First of all thanks for the reporter!

I think I've found a nice way to guarantee correct sort order even with shardTestFiles set to true. It was still a bit off with the one provided in the readme file.

What I do is patch jasmine2MetaDataBuilder and add instanceId to each spec which happens to be process.pid:

var org = { jasmine2MetaDataBuilder: htmlReporter.jasmine2MetaDataBuilder };
htmlReporter.jasmine2MetaDataBuilder = function () {
    var metadata = org.jasmine2MetaDataBuilder.apply(this, arguments);
    metadata.instanceId = process.pid;
    return metadata;
};

Sort function:

module.exports = function sort(a, b) {

    var valueA = a.instanceId * a.timestamp;
    var valueB = b.instanceId * b.timestamp;

    if (valueA < valueB) {
        return -1;
    }
    return 1;
}

It would be nice if something like this could be incorporated.

Error message not displaying for failed tests

Hi there, in our Jasmine2 test we have the following code:

expect(viewVideoPg.unpublishVideoBtn.isPresent(), 'Video publish/unpublish button is not found').toBe(false);

However, when this expectation fails, the output in your plugin reads:
Expected true to be false, instead of "Video publish/unpublish button is not found"

Why is this?

How can I fix?

Report multiple failed expects in one it()?

I'm running tests with multiple expects in one it(). When they fail, only the first failed expect ist reported, the rest is ignored.

Is there a way to get all failed expects?

Question: blocked scripts

Question - so I am deploying the reports via Jenkins. And so far I can see the report is being produced along with a bunch of screenshots. However when I try to load the report, I get the following:

report

I firstly copied the report off the machine and put it on my own to test. This worked as expected.

So opened up the console and saw the following:

Content Security Policy: The page’s settings blocked the loading of a resource at https://ajax.googleapis.com/ajax/libs/angularjs/1.4.8/angular.min.js (“script-src http://dskvm4981-iis:8080 'unsafe-inline' 'unsafe-eval'”).

a quick google shows there is some html which can be added to the meta to get round this:

No problem, I thought I could go to the index.html page located in appdata/roaming/npm/node_modules/protractor-beautiful-reporter/lib and modify the html file and any new reports would have this line. However it isn't. Is there any place else I can do the above - or is there an option when generating the report to override content security policy?

Definition of Pending

When tests are marked pending programmatically in Jasmine, the pending status doesn't get set. They are considered fails but many would like to see them in the Pending list. After searching for solutions to report these the "right" way when run, the best I came up with was extending a jasmine spec reporter to report out to the console that these items should be reported as pending. Can similar logic be applied with this report?

This is a code snippet from this work around. The failedExpectation messages are all prefixed with "Failed: => marked Pending" and then whatever message is supplied by the pending('Pending reason') call.

jasmine.getEnv().addReporter(new SpecReporter({ spec: { displayStacktrace: true } }));
let PendingSpecReporter = SpecReporter;

PendingSpecReporter.prototype.specDone = function (spec) {
    this.metrics.stopSpec(spec);
    var pending = false;
    for (var i = 0; i < spec.failedExpectations.length; i++) {
        if (spec.failedExpectations[i].message.toLowerCase().indexOf('pending') >= 0) {
            pending = true;
            spec.pendingReason = spec.failedExpectations[i].message;
        }
    }
    if (spec.status === 'pending' || pending) {
        this.metrics.pendingSpecs++;
        this.display.pending(spec);
    } else if (spec.status === 'passed') {
        this.metrics.successfulSpecs++;
        this.display.successful(spec);
    } else if (spec.status === 'failed') {
        this.metrics.failedSpecs++;
        this.display.failed(spec);
    }
};

module.exports = PendingSpecReporter;

bootstrap.css missing

Hi,

the referenced bootstrap.css results in a 404 error.
Perhaps this is a good time to switch to bundeled assets?

Report compatibility for browsers

Hi,
thank you for the last major update !
You seem to have changed the way you import the .css file (localy)

It doesn't seem to work for my chrome.
Additionaly and FYI only, it does not work at all for ie.
Here's a little look around win10 basic browsers
Screenshots to see what happens

OS : Win10
Chrome up to date
IE up to date
Firefox up to date
Edge up to date

Chrome : apparently we can force the browser to ignore some security locks, but I wont do that...
image
error log :
image

FYI ie : not working at all...
image

Edge : works as fine as firefox does

cheers,
PF

Reporter cause stop test execution when using XIT

Example of code to reproduce

				xit("message", async () => {
					expect(true)
						.toBe(true);
				});

When i enable beautiful-reporter it just hangs with "*" in console. After removing beautiful-reporter execution restoring correctly.

PS Nice reporter!

Include specname in the description of the report?

Sorry if this is already available. I thought it was achievable by the metaDataBuilder function but I can't even seem to get that to work unless I have misunderstood it's use.

I tried the below as a test to see if it would change the description to Testing. My goal is to keep the current description which I believe is based of the name of the describe block but add the specfilename to that description so I can know which filename it belonged to. any help is appreciated.

screen shot 2017-11-29 at 5 13 48 pm

    var path = require('path');
    var reporter = new HtmlReporter({
      baseDirectory: 'tmp/screenshots',
      pathBuilder: function pathBuilder(spec, descriptions, results, capabilities) {
        // Return '<browser>/<specname>' as path for screenshots:
        // Example: 'firefox/list-should work'
        return path.join(browser.browserName + process.env.TAG, descriptions.join('-'));
      },
      metaDataBuilder: function metaDataBuilder(spec, descriptions, results, capabilities) {
          // Return the description of the spec and if it has passed or not:
          return {
             description: 'Testing',
             passed: results.passed()
          };
      },
      takeScreenShotsOnlyForFailedSpecs: true,

    });
    // Add a screenshot reporter and store screenshots to `/tmp/screenshots`:
    jasmine.getEnv().addReporter(reporter.getJasmine2Reporter());

Improvment : Allow offline consultation

Hello, me again.

As a proposal, it should be cool if you include a flag to generate offline report ( with angular / jquery / bootstrap ) not included with cdn but with local files.

Regards.

Require line reports error on launching protractor

Hey,

I updated my webdriver-manager and now when I try to launch any protractor tests I get the following:

SyntaxError: Unexpected token (
...
..
..
  at Object.<anonymous> (C:\Users\a\Desktop\protractor\batshit.js:1:82)

Line 1 is showing:
var HtmlReporter = require('protractor-beautiful-reporter');

I can't see what is wrong with it

If I change the line and comment it use the standard HTML report it all works fine.

Anyone got any additional ideas?

docTitle option not setting title of the report

When I use
docTitle: 'SG Alpha 2',
I am not seeing the name of the report change. The title still shows as "Protractor Screenshot Report" and the heading in the document says "Test Results" - am I mistaken as I would have expected one of those to change?

Fetching browser logs throws exception in Firefox

Because browser.manage().logs().get('browser').then(function(browserLog) { ... }));
is not part of the webdriver spec, attempting to fetch browser logs from Firefox will cause webdriver to throw this error:

WebDriverError: POST /session/36718c58-6808-4ba0-9600-3d33fffc0d30/log did not match a known command

You may want to consider disabling this feature if the browser is non-Chrome?

failed loading configuration file

I'm getting following error when running the test.

[13:04:38] E/configParser - Error code: 105
[exec] [13:04:38] E/configParser - Error message: failed loading configuration file /Users/click/Git/clickhq-v2/frontend/test/e2e/conf.js
[exec] [13:04:38] E/configParser - /Users/click/Git/clickhq-v2/frontend/node_modules/protractor-beautiful-reporter/index.js:205
[exec] this._addTaskToFlow(async () => this._suiteNames.push(result.description));

Please kindly fix ASAP. Thanks

CSS not loaded: I have fix, please read

Website bootswatch have update their "repository" and now themes for bootstrap 3.x.x are found under different URL. Right now test report has no css because of wrong stylesheet href.
Please change it to:
<link rel="stylesheet" href="https://bootswatch.com/3/paper/bootstrap.css" crossorigin="anonymous">

TImestamped report

Loving the format on this report. Best i have seen for protractor! Is there a way to created a results folder with a timestamp as well?

Not able to create a dynamic reporting path(which will include browser name ,Date time etc) for multi-capabilities

Observation:
In the onPrepare() function when we define path for report in the baseDirectory , i am not able get the value of browser name . Refer the below code

onPrepare: function() {
browser.getCapabilities().then(function(caps){
console.log('THe browser name '+ browser.browserName);
browser.browserName= caps.get('browserName');
});
jasmine.getEnv().addReporter(new HtmlReporter({
baseDirectory: '../../../../../../Test/'+browser.browserName,
pathBuilder: function pathBuilder(spec, descriptions, results) {
// Return '/' as path for screenshots:
// Example: 'firefox/list-should work'.
return path.join( descriptions) ;},
screenshotsSubfolder: 'ScreenShots',
jsonsSubfolder: 'Jsons',
docTitle: 'Report',
docName: 'Report.html',
preserveDirectory: false
}).getJasmine2Reporter());
}

We require to create a dynamic path because multicapabilities launches on different browser . So different browser will require different path .

In the above code ,
"browser.browserName" in console log is returning a promise .
"browser.browserName" in the baseDirectory is returning a string "undefined".

tried using path builder property , but this property builds path only for screen shot .

Expected Result :
Generate a dynamic reporting path based on browser name
So that when we use this plugin for multi-capabilities , different browser will have different report

Thanks in Advance :)

PreserveDirectory false cause sometimes test fail to start

look like "removeDirectory(filePath);" fails sometimes and .....

[05:21:00][Step 4/4] [chrome #01-27] [05:21:00] E/configParser - Error code: 105
[05:21:00][Step 4/4] [chrome #01-27] [05:21:00] E/configParser - Error message: failed loading configuration file ..........
[05:21:00][Step 4/4] [chrome #01-27] [05:21:00] E/configParser - Error: ENOENT: no such file or directory, unlink '.........\reports\test\assets\angular.min.js'
[05:21:00][Step 4/4] [chrome #01-27]     at Object.fs.unlinkSync (fs.js:1061:18)
[05:21:00][Step 4/4] [chrome #01-27]     at removeDirectory (D:\tc\ba0\work\a5d9398c7ec5eb82\node_modules\protractor-beautiful-reporter\index.js:5294:20)
[05:21:00][Step 4/4] [chrome #01-27]     at Object.removeDirectory (D:\tc\ba0\work\a5d9398c7ec5eb82\node_modules\protractor-beautiful-reporter\index.js:5296:17)
[05:21:00][Step 4/4] [chrome #01-27]     at new ScreenshotReporter (D:\tc\ba0\work\a5d9398c7ec5eb82\node_modules\protractor-beautiful-reporter\index.js:4665:14)

Multiple describe blocks are not supported for IE11 browser report.html

Observation:
Multiple describe blocks are not supported for IE11 browser report.html

The browser works fine till the second describe , after 2nd describe block it becomes unresponsive and give Error 404 or it gives 'could not store metadata or add Metadata to combine.js protractor' error

i.e
**describe('I am the first describe block', function(){

  describe('I am the second describe block', function(){
 // works fine till the second describe block
   });

 describe('I am the third describe block', function(){
 // from the third describe block , the page becomes unresponsive    
  });

} );**

I have attached a test Calculator script where i have same issue
Calculator.zip
Please run the conf file for reports to get generated.

NOTE: The same scenario works fine for Chrome Runs . we get a clean green run.

Exepected result : All the describe blocks should execute without any error .Ideally it should behave same as chrome runs

Many Thanks in Advance

Last test missing from the report

Bit of a strange one here.

I have a set of some 90+ test specs and when I run them, the command line reports

92 specs, 16 failures

When I open the report, it shows only 15 fails (the exact last test is the one missing.)

To check this wasn't something really stupid I reran the exact same tests against the exact same codebase but this time used the jasmine2-html-reporter. This showed the 16 test (and checked that the missing one was indeed present.)

Is this a known issue?

my config is below (just in case I am calling specs incorrectly - note this has the beautiful reporter commented out as this was during my test)

//var HtmlReporter = require('protractor-beautiful-reporter');
 var Jasmine2HtmlReporter = require('protractor-jasmine2-html-reporter');

exports.config = {
    framework: 'jasmine',
    
    // Capabilities to be passed to the webdriver instance.
    capabilities: {
        'browserName': 'chrome'
    },

	seleniumAddress: 'http://localhost:4444/wd/hub',
	
    specs: ['LA1-326\\guidance_page.js',
            'LA1-310\\question_1.js',        
            'LA1-310\\question_2.js',
            'LA1-310\\question_3.js',              
            'LA1-310\\question_4.js',              
            'LA1-310\\question_5.js',              
            'LA1-310\\question_6.js',
            'LA1-310\\question_7.js',
            'LA1-310\\question_8.js',
            'LA1-310\\question_9.js',
            'LA1-310\\question_10.js',
            'LA1-521\\first_name_validation.js',
            'LA1-521\\last_name_validation.js',
            'LA1-521\\email_validation.js',
            'LA1-521\\telephone_validation.js'],
    //specs: ['LA1-310\\question_7.js'],   

	baseUrl: 'http://localhost:4200',

	onPrepare: function() {
		jasmine.getEnv().addReporter(new Jasmine2HtmlReporter({
			savePath: 'reports/'
            })        
        );
    }

    /*onPrepare: function() {

        jasmine.getEnv().addReporter(new HtmlReporter({
            preserveDirectory: false,
            baseDirectory: 'reports2/',
            docTitle: 'SG Alpha 2',
            docName: 'index.html'
        }).getJasmine2Reporter());
    }*/
	
};

Report does not generate

I have followed the instruction mentioned in the doc for generating the report, But I am not seeing any in my project directory.

Do I need to follow some other steps which is not mentioned in the doc.

Can you please provide me the solution to make. I am not getting any error.

I have done the npm installaltion

My Package.jason looks like this

{
"name": "protractor",
"version": "1.0.0",
"description": "",
"main": "conf.js",
"scripts": {
"start": "babel-node test/TestScripts.js —presets es2015,stage-2",
"test": "echo "Error: no test specified" && exit 1"
},

"author": "",
"license": "ISC",
"dependencies": {
"mkdirp": "~0.3.5",
"underscore": "~1.6.0"
},
"devDependencies": {
"babel-core": "^6.17.0",
"babel-plugin-transform-runtime": "^6.15.0",
"babel-preset-es2015": "^6.9.0",
"babel-preset-stage-1": "^6.16.0",
"babel-runtime": "^6.11.6",
"protractor-beautiful-reporter": "^0.4.5",
"protractor-html-hierarchical-reporter": "^1.6.0",
"protractor-html-screenshot-reporter": "0.0.21",
"protractor-jasmine2-html-reporter": "0.0.7"
}
}

conf.js looks like this

require('babel-core/register');
var HtmlReporter = require('protractor-beautiful-reporter');
var path = require('path');
exports.config = {
directConnect: true,

// Capabilities to be passed to the webdriver instance.
capabilities: {
'browserName': 'chrome'
},

// Framework to use. Jasmine is recommended.
framework: 'jasmine',

// Spec patterns are relative to the current working directory when
// protractor is called.
specs: ['test/TestScripts.js'],
allScriptsTimeout: 120000,
getPageTimeout: 120000,
jasmineNodeOpts: {
defaultTimeoutInterval: 120000
},

rootElement: 'body',

// your config here ...

onPrepare: function() {
// Add a screenshot reporter and store screenshots to /tmp/screenshots:
jasmine.getEnv().addReporter(new HtmlReporter({
baseDirectory: '/test'
}).getJasmine2Reporter());
}
// Options to be passed to Jasmine.

};

Sort "it" into "describe" by execution order.

Hi,

thanks for your report, it's very nice and make my tests results more clear !

Right now, the tests are sorted by alphabetical order /
Ex

  • Should a

  • should b...

Could you add the timestamp of the execution into the html result page and let us be able to sort by this timestamp ?

Thx in advance,
regarde,
PF

Recommend Projects

  • React photo React

    A declarative, efficient, and flexible JavaScript library for building user interfaces.

  • Vue.js photo Vue.js

    🖖 Vue.js is a progressive, incrementally-adoptable JavaScript framework for building UI on the web.

  • Typescript photo Typescript

    TypeScript is a superset of JavaScript that compiles to clean JavaScript output.

  • TensorFlow photo TensorFlow

    An Open Source Machine Learning Framework for Everyone

  • Django photo Django

    The Web framework for perfectionists with deadlines.

  • D3 photo D3

    Bring data to life with SVG, Canvas and HTML. 📊📈🎉

Recommend Topics

  • javascript

    JavaScript (JS) is a lightweight interpreted programming language with first-class functions.

  • web

    Some thing interesting about web. New door for the world.

  • server

    A server is a program made to process requests and deliver data to clients.

  • Machine learning

    Machine learning is a way of modeling and interpreting data that allows a piece of software to respond intelligently.

  • Game

    Some thing interesting about game, make everyone happy.

Recommend Org

  • Facebook photo Facebook

    We are working to build community through open source technology. NB: members must have two-factor auth.

  • Microsoft photo Microsoft

    Open source projects and samples from Microsoft.

  • Google photo Google

    Google ❤️ Open Source for everyone.

  • D3 photo D3

    Data-Driven Documents codes.