Git Product home page Git Product logo

dbtester's Introduction

dbtester

Build Status Godoc

Distributed database benchmark tester: etcd, Zookeeper, Consul, zetcd, cetcd

It includes github.com/golang/freetype, which is based in part on the work of the FreeType Team.


Performance Analysis


Project

dbtester system architecture

For etcd, we recommend etcd benchmark tool.

All logs and results can be found at https://github.com/etcd-io/dbtester/tree/master/test-results or https://console.cloud.google.com/storage/browser/dbtester-results/?authuser=0&project=etcd-development.


Noticeable Warnings: Zookeeper

Snapshot, when writing 1-million entries (256-byte key, 1KB value value), with 500 concurrent clients

# snapshot warnings
cd 2017Q1-00-etcd-zookeeper-consul/02-write-1M-keys-best-throughput
grep -r -i fsync-ing\ the zookeeper-r3.4.9-java8-* | less

2017-02-10 18:55:38,997 [myid:3] - WARN  [SyncThread:3:SyncRequestProcessor@148] - Too busy to snap, skipping
2017-02-10 18:55:38,998 [myid:3] - INFO  [SyncThread:3:FileTxnLog@203] - Creating new log file: log.1000c0c51
2017-02-10 18:55:40,855 [myid:3] - INFO  [SyncThread:3:FileTxnLog@203] - Creating new log file: log.1000cd2e6
2017-02-10 18:55:40,855 [myid:3] - INFO  [Snapshot Thread:FileTxnSnapLog@240] - Snapshotting: 0x1000cd1ca to /home/gyuho/zookeeper/zookeeper.data/version-2/snapshot.1000cd1ca
2017-02-10 18:55:46,382 [myid:3] - WARN  [SyncThread:3:FileTxnLog@338] - fsync-ing the write ahead log in SyncThread:3 took 1062ms which will adversely effect operation latency. See the ZooKeeper troubleshooting guide
2017-02-10 18:55:47,471 [myid:3] - WARN  [SyncThread:3:FileTxnLog@338] - fsync-ing the write ahead log in SyncThread:3 took 1084ms which will adversely effect operation latency. See the ZooKeeper troubleshooting guide
2017-02-10 18:55:49,425 [myid:3] - WARN  [SyncThread:3:FileTxnLog@338] - fsync-ing the write ahead log in SyncThread:3 took 1142ms which will adversely effect operation latency. See the ZooKeeper troubleshooting guide
2017-02-10 18:55:51,188 [myid:3] - WARN  [SyncThread:3:FileTxnLog@338] - fsync-ing the write ahead log in SyncThread:3 took 1201ms which will adversely effect operation latency. See the ZooKeeper troubleshooting guide
2017-02-10 18:55:52,292 [myid:3] - WARN  [SyncThread:3:FileTxnLog@338] - fsync-ing the write ahead log in SyncThread:3 took 1102ms which will adversely effect operation latency. See the ZooKeeper troubleshooting guide

When writing more than 2-million entries (256-byte key, 1KB value value) with 500 concurrent clients

# leader election
cd 2017Q1-00-etcd-zookeeper-consul/04-write-too-many-keys
grep -r -i election\ took  zookeeper-r3.4.9-java8-* | less

# leader election is taking more than 10 seconds...
zookeeper-r3.4.9-java8-2-database.log:2017-02-10 19:22:16,549 [myid:2] - INFO  [QuorumPeer[myid=2]/0:0:0:0:0:0:0:0:2181:Follower@61] - FOLLOWING - LEADER ELECTION TOOK - 22978
zookeeper-r3.4.9-java8-2-database.log:2017-02-10 19:23:02,279 [myid:2] - INFO  [QuorumPeer[myid=2]/0:0:0:0:0:0:0:0:2181:Leader@361] - LEADING - LEADER ELECTION TOOK - 10210
zookeeper-r3.4.9-java8-2-database.log:2017-02-10 19:23:14,498 [myid:2] - INFO  [QuorumPeer[myid=2]/0:0:0:0:0:0:0:0:2181:Leader@361] - LEADING - LEADER ELECTION TOOK - 203
zookeeper-r3.4.9-java8-2-database.log:2017-02-10 19:23:36,303 [myid:2] - INFO  [QuorumPeer[myid=2]/0:0:0:0:0:0:0:0:2181:Leader@361] - LEADING - LEADER ELECTION TOOK - 9791
zookeeper-r3.4.9-java8-2-database.log:2017-02-10 19:23:52,151 [myid:2] - INFO  [QuorumPeer[myid=2]/0:0:0:0:0:0:0:0:2181:Leader@361] - LEADING - LEADER ELECTION TOOK - 3836
zookeeper-r3.4.9-java8-2-database.log:2017-02-10 19:24:13,849 [myid:2] - INFO  [QuorumPeer[myid=2]/0:0:0:0:0:0:0:0:2181:Leader@361] - LEADING - LEADER ELECTION TOOK - 9686
zookeeper-r3.4.9-java8-2-database.log:2017-02-10 19:24:29,694 [myid:2] - INFO  [QuorumPeer[myid=2]/0:0:0:0:0:0:0:0:2181:Leader@361] - LEADING - LEADER ELECTION TOOK - 3573
zookeeper-r3.4.9-java8-2-database.log:2017-02-10 19:24:51,392 [myid:2] - INFO  [QuorumPeer[myid=2]/0:0:0:0:0:0:0:0:2181:Leader@361] - LEADING - LEADER ELECTION TOOK - 8686
zookeeper-r3.4.9-java8-2-database.log:2017-02-10 19:25:07,231 [myid:2] - INFO  [QuorumPeer[myid=2]/0:0:0:0:0:0:0:0:2181:Leader@361] - LEADING - LEADER ELECTION TOOK - 3827
zookeeper-r3.4.9-java8-2-database.log:2017-02-10 19:25:28,940 [myid:2] - INFO  [QuorumPeer[myid=2]/0:0:0:0:0:0:0:0:2181:Leader@361] - LEADING - LEADER ELECTION TOOK - 9697
zookeeper-r3.4.9-java8-2-database.log:2017-02-10 19:25:44,772 [myid:2] - INFO  [QuorumPeer[myid=2]/0:0:0:0:0:0:0:0:2181:Leader@361] - LEADING - LEADER ELECTION TOOK - 3820


Noticeable Warnings: Consul

Snapshot, when writing 1-million entries (256-byte key, 1KB value value), with 500 concurrent clients

# snapshot warnings
cd 2017Q1-00-etcd-zookeeper-consul/02-write-1M-keys-best-throughput
grep -r -i installed\ remote consul-v0.7.4-go1.7.5-* | less

    2017/02/10 18:58:43 [INFO] snapshot: Creating new snapshot at /home/gyuho/consul.data/raft/snapshots/2-900345-1486753123478.tmp
    2017/02/10 18:58:45 [INFO] snapshot: reaping snapshot /home/gyuho/consul.data/raft/snapshots/2-849399-1486753096972
    2017/02/10 18:58:46 [INFO] raft: Copied 1223270573 bytes to local snapshot
    2017/02/10 18:58:55 [INFO] raft: Compacting logs from 868354 to 868801
    2017/02/10 18:58:56 [INFO] raft: Installed remote snapshot
    2017/02/10 18:58:57 [INFO] snapshot: Creating new snapshot at /home/gyuho/consul.data/raft/snapshots/2-911546-1486753137827.tmp
    2017/02/10 18:58:59 [INFO] consul.fsm: snapshot created in 32.255µs
    2017/02/10 18:59:01 [INFO] snapshot: reaping snapshot /home/gyuho/consul.data/raft/snapshots/2-873921-1486753116619
    2017/02/10 18:59:02 [INFO] raft: Copied 1238491373 bytes to local snapshot
    2017/02/10 18:59:11 [INFO] raft: Compacting logs from 868802 to 868801
    2017/02/10 18:59:11 [INFO] raft: Installed remote snapshot

Logs do not tell much but average latency spikes (e.g. from 70.27517 ms to 10407.900082 ms)

2017Q2-01-write-1M-cpu-client-scaling

2017Q2-02-write-1M-network-traffic-best-throughput

2017Q2-01-write-1M-throughput-client-scaling

2017Q2-02-write-1M-latency-best-throughput


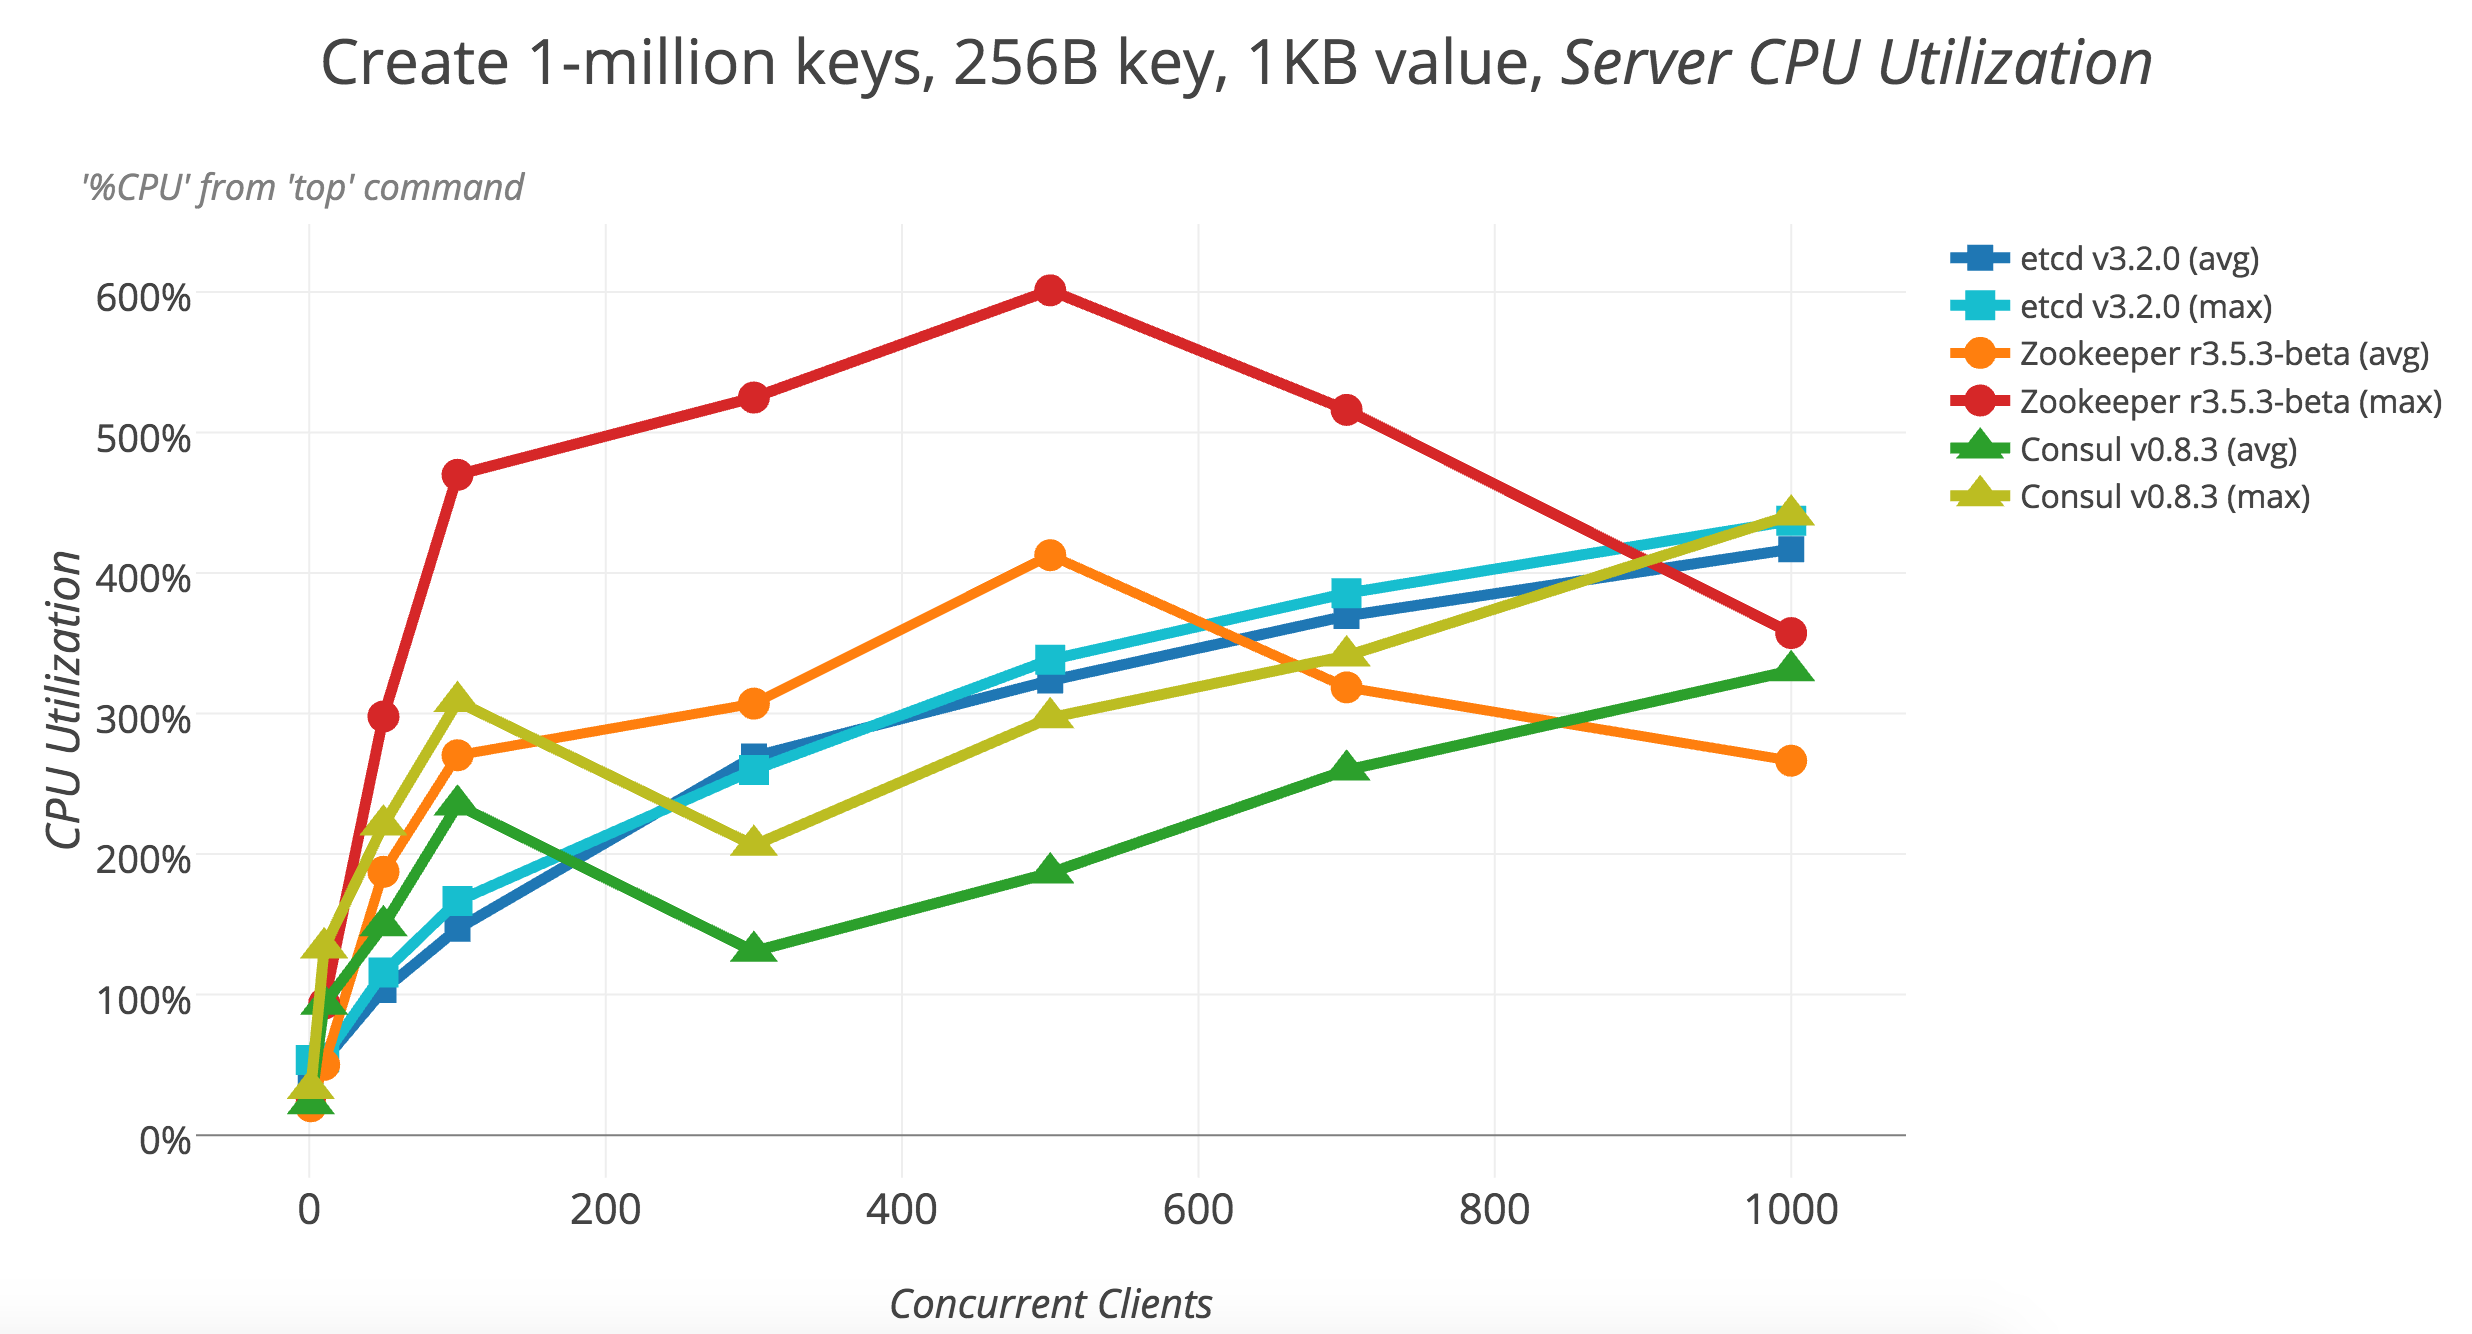
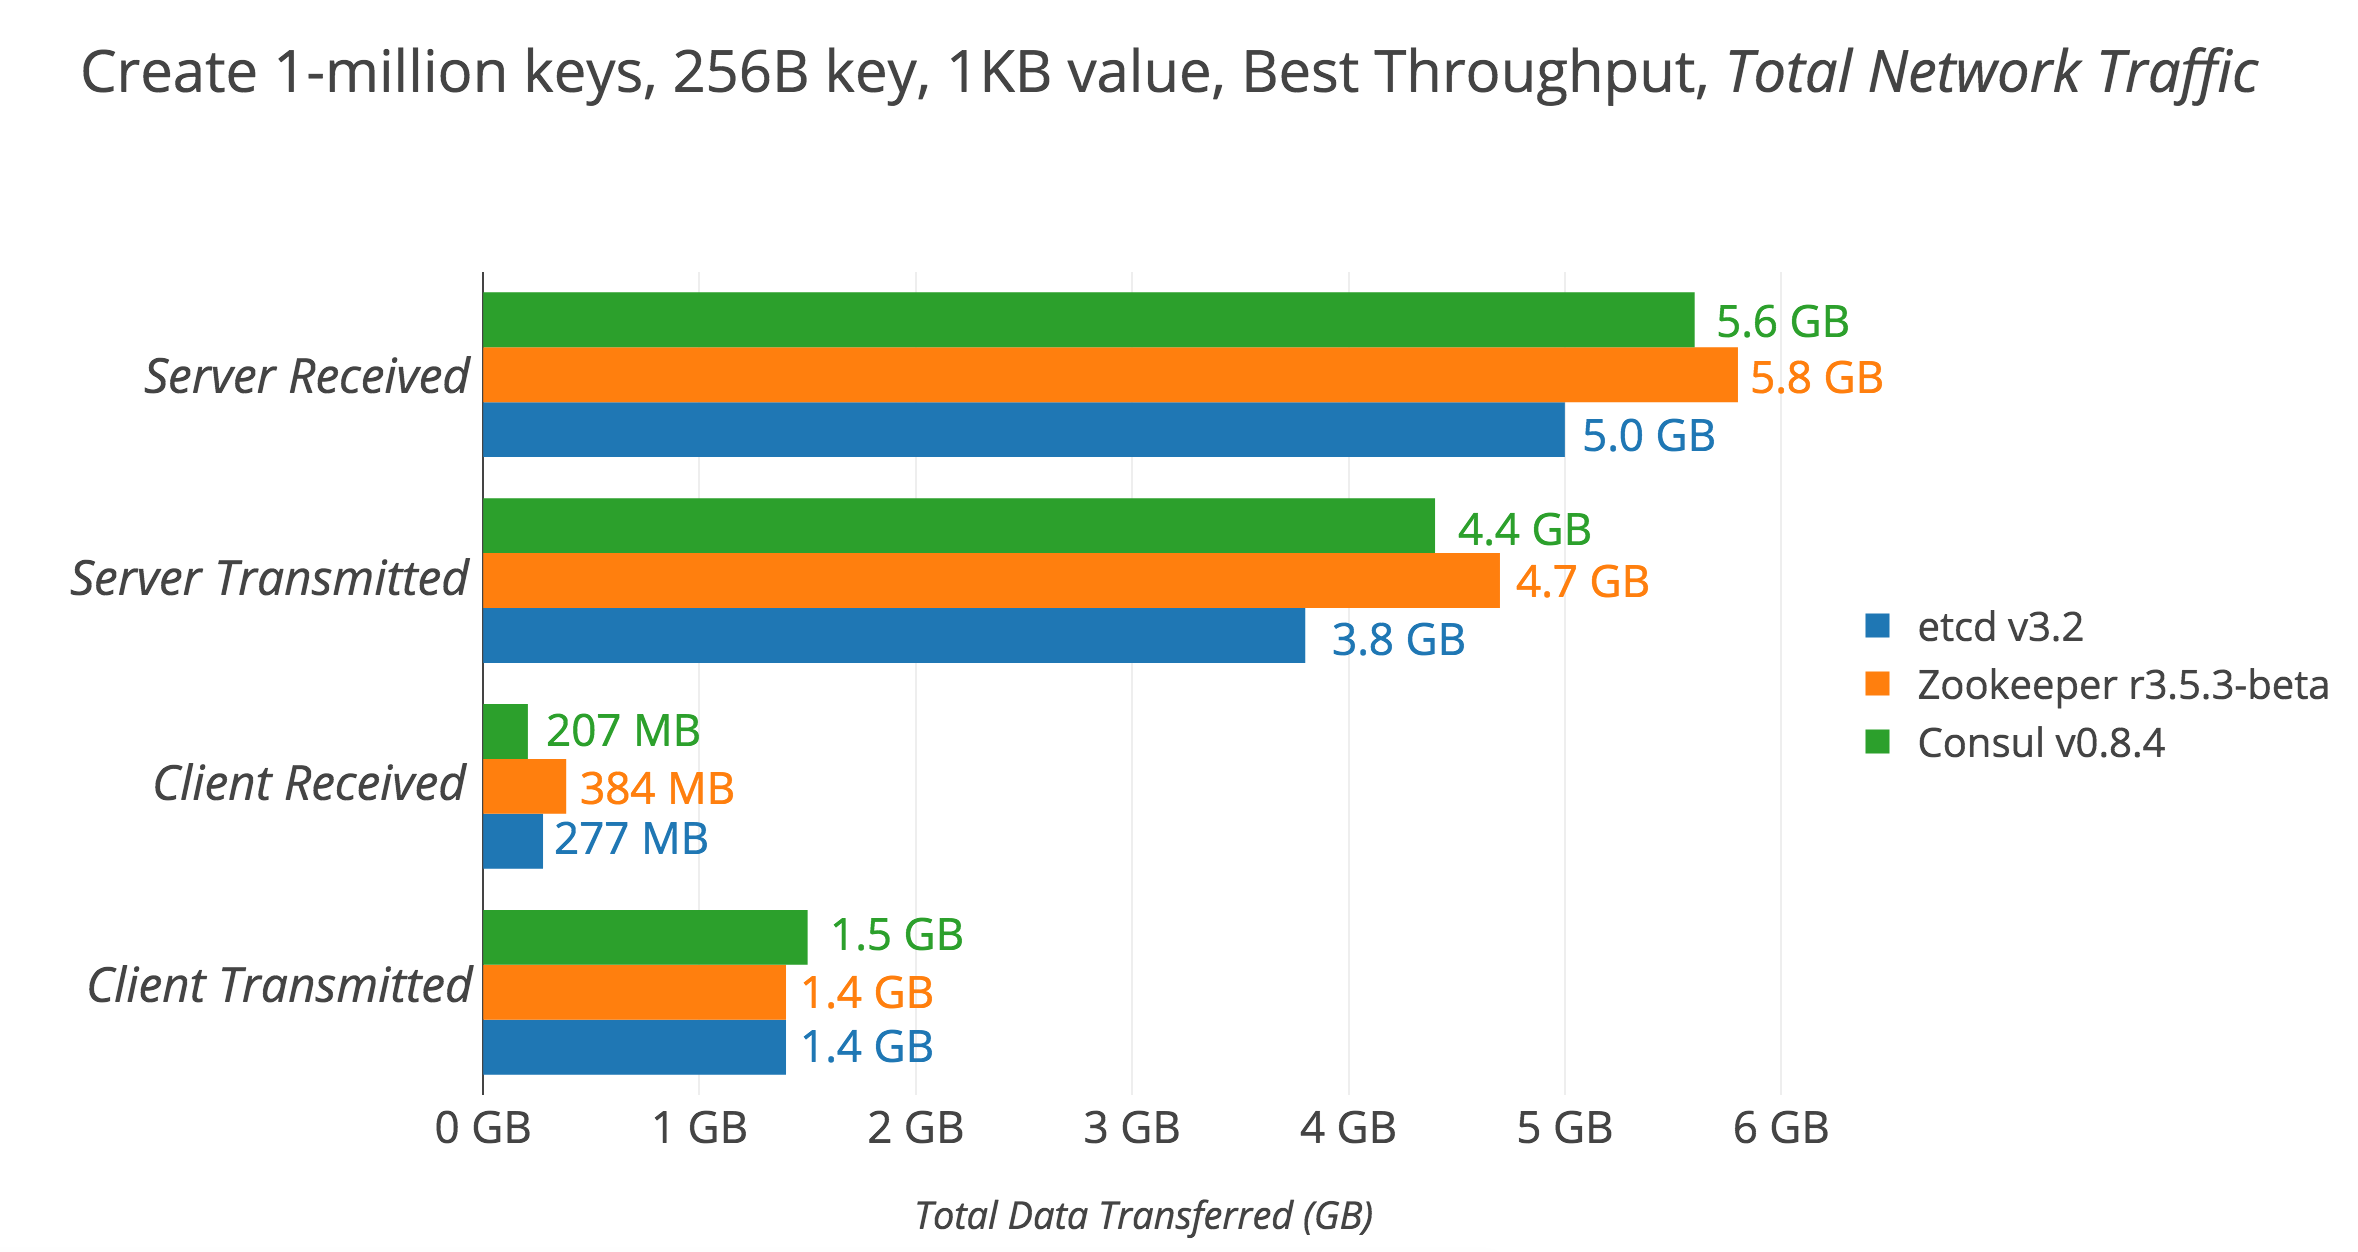
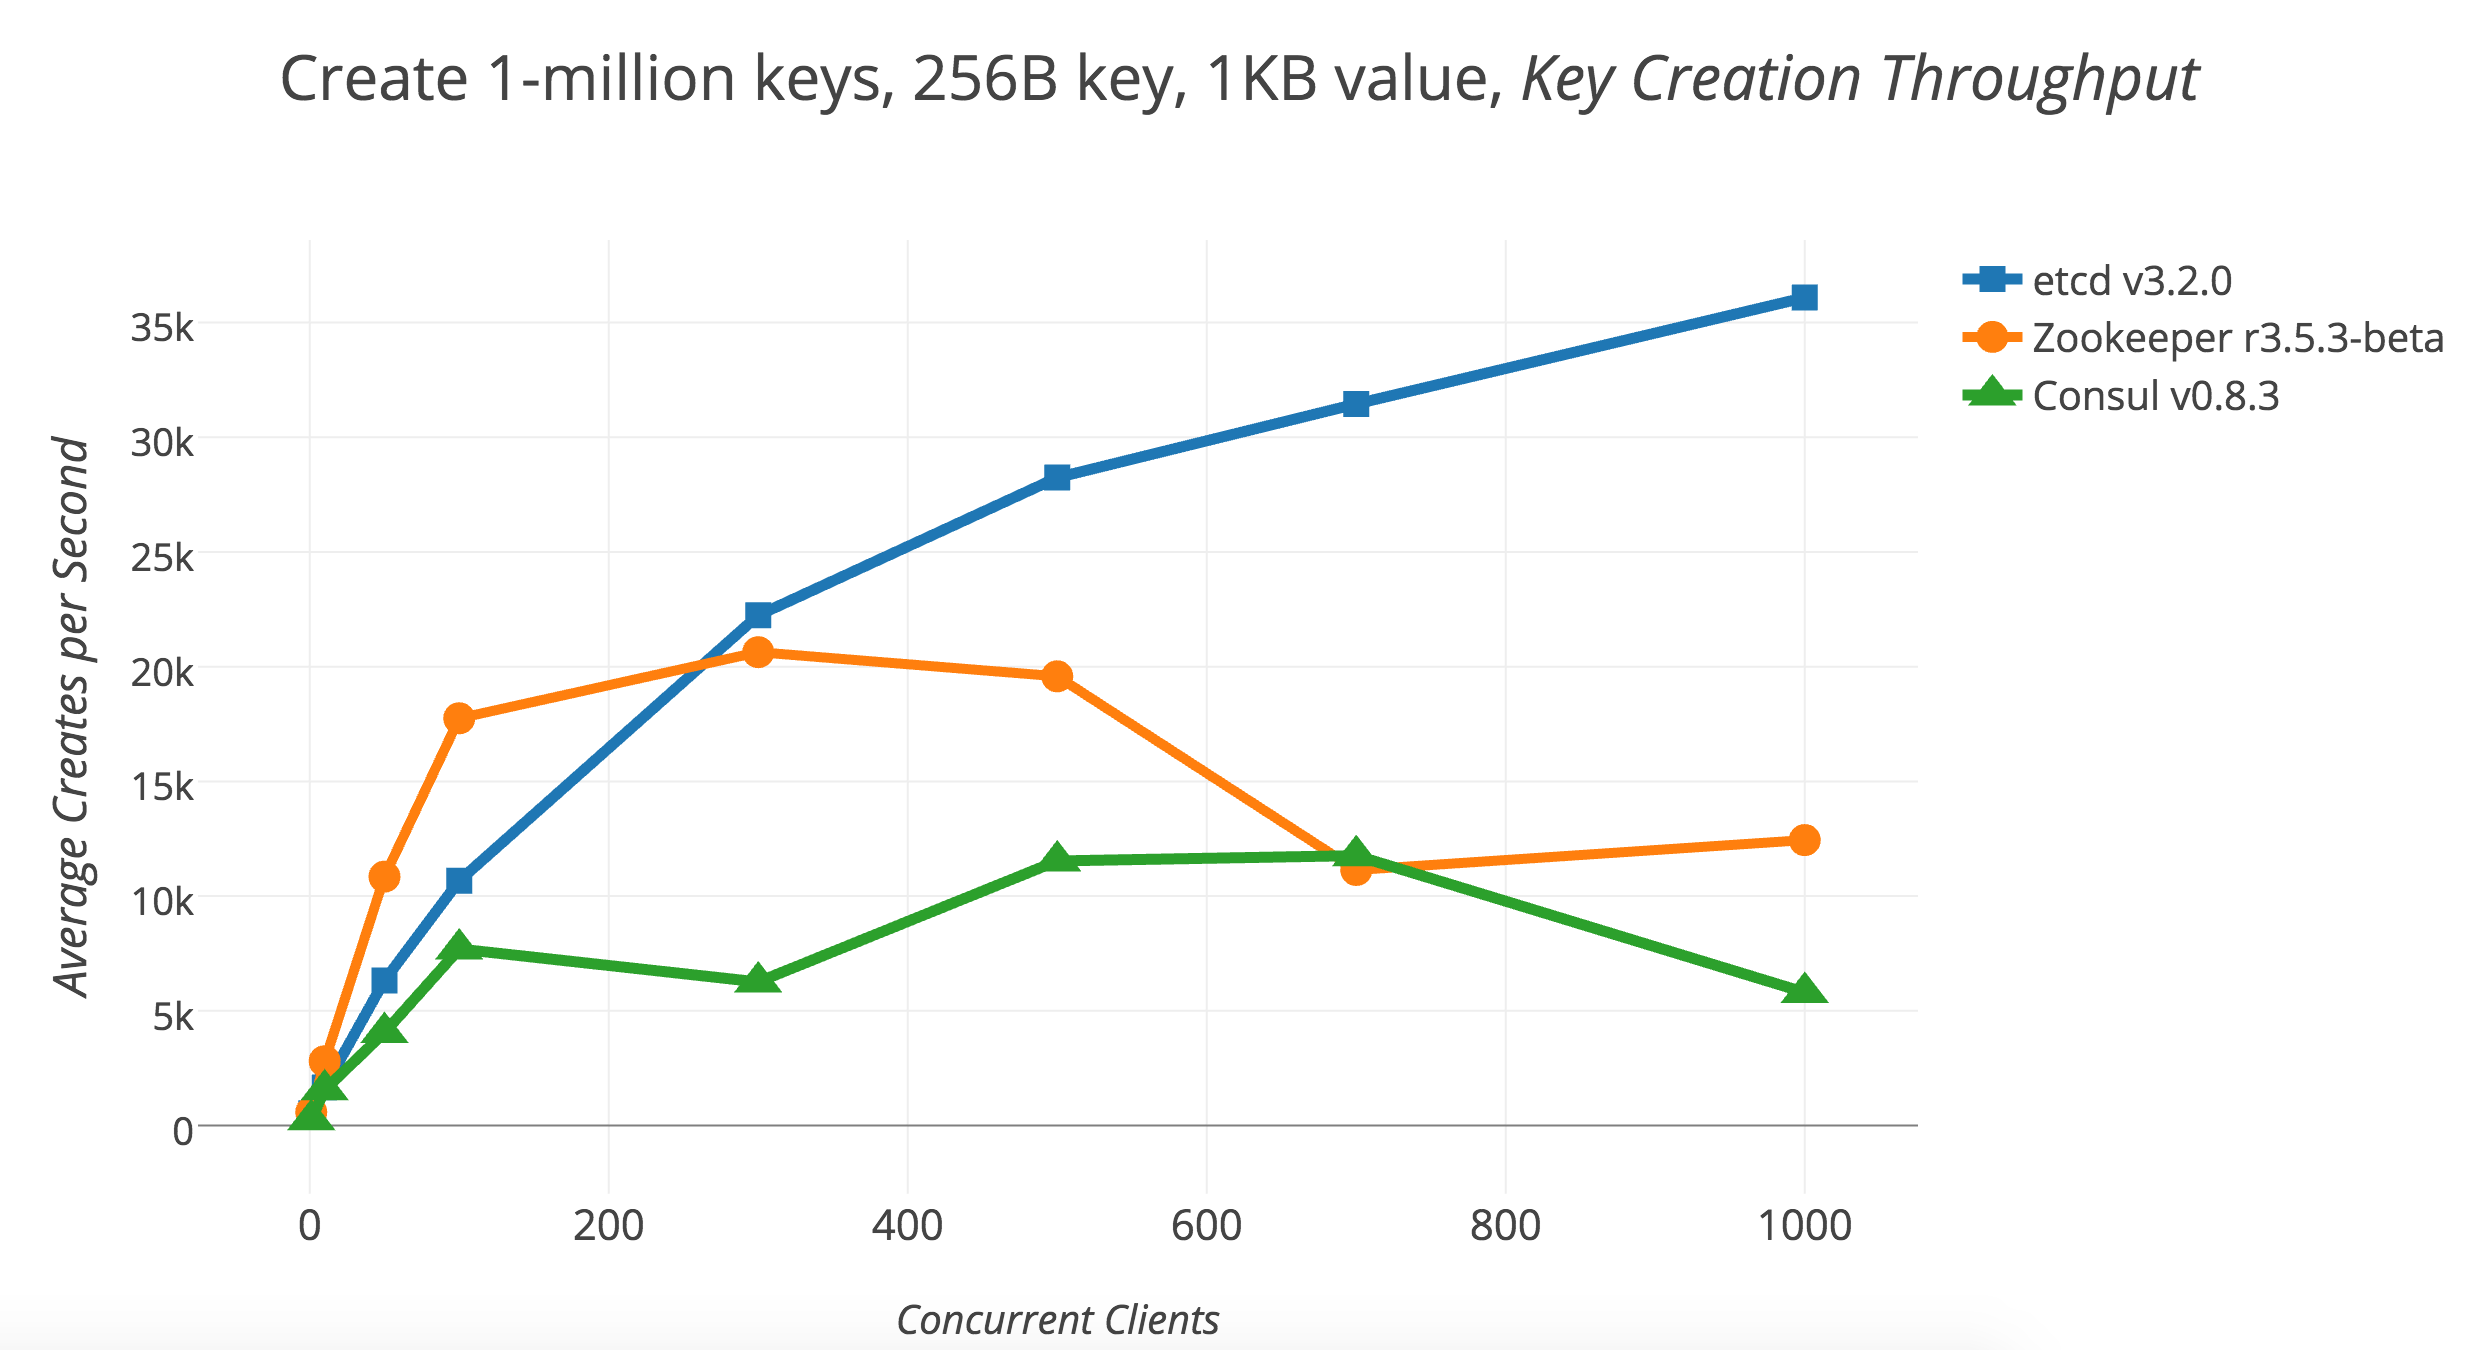
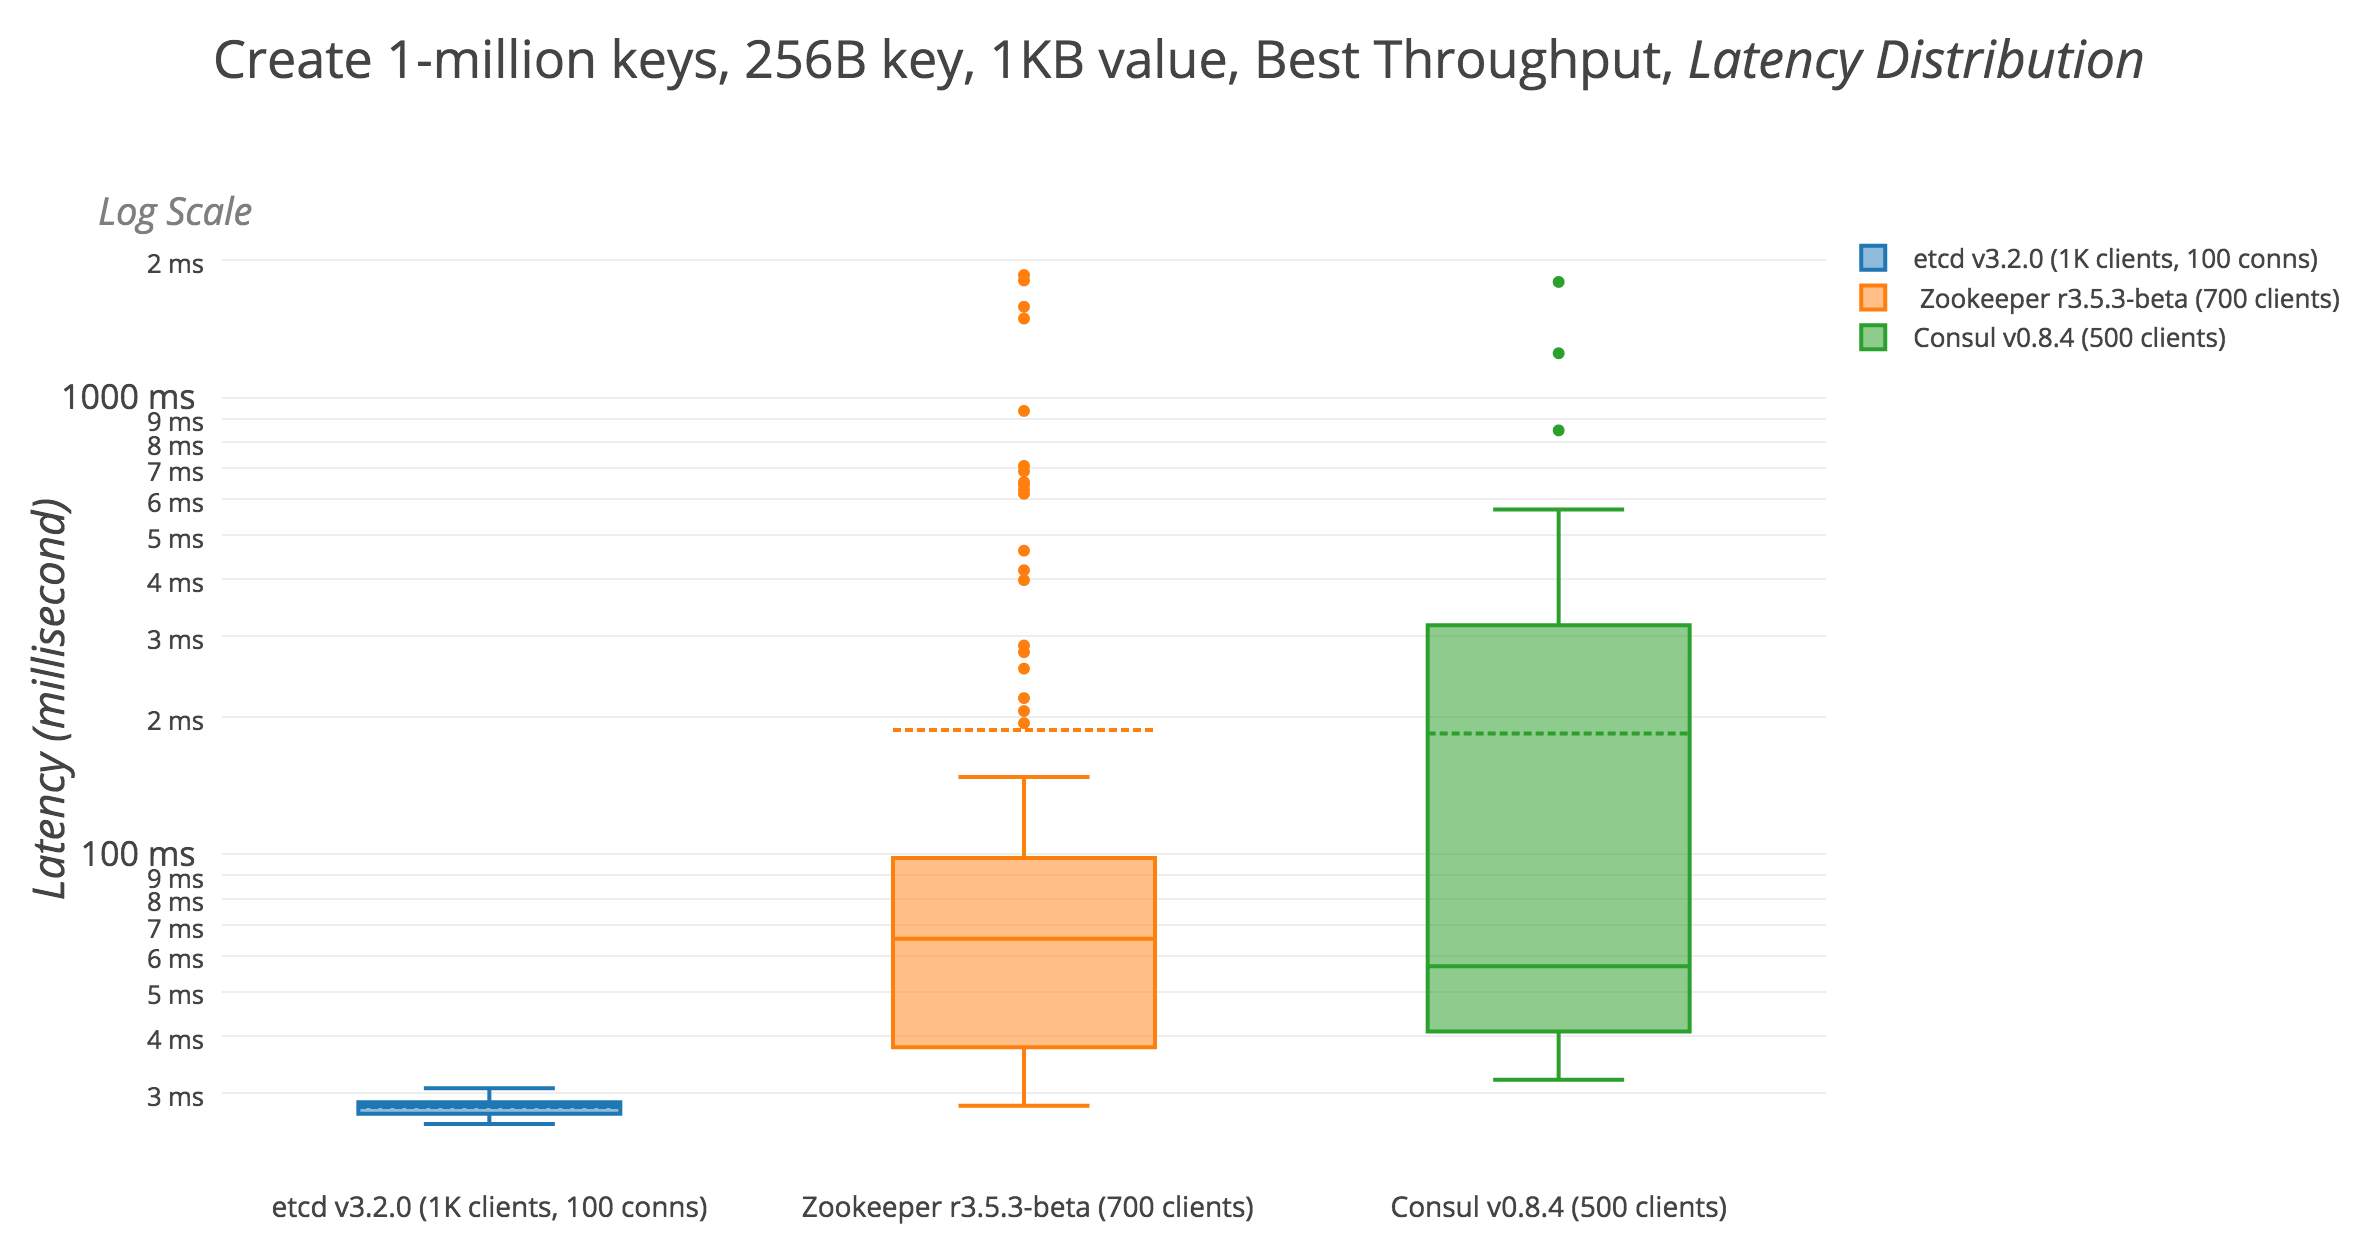
Write 1M keys, 256-byte key, 1KB value, Best Throughput (etcd 1K clients with 100 conns, Zookeeper 700, Consul 500 clients)
  • Google Cloud Compute Engine
  • 4 machines of 16 vCPUs + 60 GB Memory + 300 GB SSD (1 for client)
  • Ubuntu 17.10 (GNU/Linux kernel 4.13.0-25-generic)
  • ulimit -n is 120000
  • etcd v3.3.0 (Go 1.9.2)
  • Zookeeper r3.5.3-beta
    • Java 8
    • javac 1.8.0_151
    • Java(TM) SE Runtime Environment (build 1.8.0_151-b12)
    • Java HotSpot(TM) 64-Bit Server VM (build 25.151-b12, mixed mode)
    • /usr/bin/java -Djute.maxbuffer=33554432 -Xms50G -Xmx50G
  • Consul v1.0.2 (Go 1.9.2)
+---------------------------------------+---------------------+-----------------------------+-----------------------+
|                                       | etcd-v3.3.0-go1.9.2 | zookeeper-r3.5.3-beta-java8 | consul-v1.0.2-go1.9.2 |
+---------------------------------------+---------------------+-----------------------------+-----------------------+
|                         TOTAL-SECONDS |         28.3623 sec |                 59.2167 sec |          178.9443 sec |
|                  TOTAL-REQUEST-NUMBER |           1,000,000 |                   1,000,000 |             1,000,000 |
|                        MAX-THROUGHPUT |      37,330 req/sec |              25,124 req/sec |        15,865 req/sec |
|                        AVG-THROUGHPUT |      35,258 req/sec |              16,842 req/sec |         5,588 req/sec |
|                        MIN-THROUGHPUT |      13,505 req/sec |                  20 req/sec |             0 req/sec |
|                       FASTEST-LATENCY |           4.6073 ms |                   2.9094 ms |            11.6604 ms |
|                           AVG-LATENCY |          28.2625 ms |                  30.9499 ms |            89.4351 ms |
|                       SLOWEST-LATENCY |         117.4918 ms |                4564.6788 ms |          4616.2947 ms |
|                           Latency p10 |        13.508626 ms |                 9.068163 ms |          30.408863 ms |
|                           Latency p25 |        16.869586 ms |                 9.351597 ms |          34.224021 ms |
|                           Latency p50 |        22.167478 ms |                10.093377 ms |          39.881181 ms |
|                           Latency p75 |        34.855941 ms |                14.951189 ms |          52.644787 ms |
|                           Latency p90 |        54.613394 ms |                28.497256 ms |         118.340402 ms |
|                           Latency p95 |        59.785127 ms |                72.671788 ms |         229.129526 ms |
|                           Latency p99 |        74.139638 ms |               273.218523 ms |        1495.660763 ms |
|                         Latency p99.9 |        97.385495 ms |              2526.873285 ms |        3499.225138 ms |
|      SERVER-TOTAL-NETWORK-RX-DATA-SUM |              5.1 GB |                      4.6 GB |                5.6 GB |
|      SERVER-TOTAL-NETWORK-TX-DATA-SUM |              3.8 GB |                      3.6 GB |                4.4 GB |
|           CLIENT-TOTAL-NETWORK-RX-SUM |              252 MB |                      357 MB |                206 MB |
|           CLIENT-TOTAL-NETWORK-TX-SUM |              1.5 GB |                      1.4 GB |                1.5 GB |
|                  SERVER-MAX-CPU-USAGE |            446.83 % |                   1122.00 % |              426.33 % |
|               SERVER-MAX-MEMORY-USAGE |              1.1 GB |                       15 GB |                4.6 GB |
|                  CLIENT-MAX-CPU-USAGE |            606.00 % |                    314.00 % |              215.00 % |
|               CLIENT-MAX-MEMORY-USAGE |               96 MB |                      2.4 GB |                 86 MB |
|                    CLIENT-ERROR-COUNT |                   0 |                       2,652 |                     0 |
|  SERVER-AVG-READS-COMPLETED-DELTA-SUM |                   0 |                         237 |                     2 |
|    SERVER-AVG-SECTORS-READS-DELTA-SUM |                   0 |                           0 |                     0 |
| SERVER-AVG-WRITES-COMPLETED-DELTA-SUM |             108,067 |                     157,034 |               675,072 |
|  SERVER-AVG-SECTORS-WRITTEN-DELTA-SUM |          20,449,360 |                  16,480,488 |           106,836,768 |
|           SERVER-AVG-DISK-SPACE-USAGE |              2.6 GB |                      6.9 GB |                2.9 GB |
+---------------------------------------+---------------------+-----------------------------+-----------------------+


zookeeper__r3_5_3_beta errors:
"zk: connection closed" (count 2,264)
"zk: could not connect to a server" (count 388)

2018Q1-02-etcd-zookeeper-consul/write-1M-keys-best-throughput/AVG-LATENCY-MS

2018Q1-02-etcd-zookeeper-consul/write-1M-keys-best-throughput/AVG-LATENCY-MS-BY-KEY

2018Q1-02-etcd-zookeeper-consul/write-1M-keys-best-throughput/AVG-LATENCY-MS-BY-KEY-ERROR-POINTS

2018Q1-02-etcd-zookeeper-consul/write-1M-keys-best-throughput/AVG-THROUGHPUT

2018Q1-02-etcd-zookeeper-consul/write-1M-keys-best-throughput/AVG-VOLUNTARY-CTXT-SWITCHES

2018Q1-02-etcd-zookeeper-consul/write-1M-keys-best-throughput/AVG-NON-VOLUNTARY-CTXT-SWITCHES

2018Q1-02-etcd-zookeeper-consul/write-1M-keys-best-throughput/AVG-CPU

2018Q1-02-etcd-zookeeper-consul/write-1M-keys-best-throughput/MAX-CPU

2018Q1-02-etcd-zookeeper-consul/write-1M-keys-best-throughput/AVG-VMRSS-MB

2018Q1-02-etcd-zookeeper-consul/write-1M-keys-best-throughput/AVG-VMRSS-MB-BY-KEY

2018Q1-02-etcd-zookeeper-consul/write-1M-keys-best-throughput/AVG-VMRSS-MB-BY-KEY-ERROR-POINTS

2018Q1-02-etcd-zookeeper-consul/write-1M-keys-best-throughput/AVG-READS-COMPLETED-DELTA

2018Q1-02-etcd-zookeeper-consul/write-1M-keys-best-throughput/AVG-SECTORS-READ-DELTA

2018Q1-02-etcd-zookeeper-consul/write-1M-keys-best-throughput/AVG-WRITES-COMPLETED-DELTA

2018Q1-02-etcd-zookeeper-consul/write-1M-keys-best-throughput/AVG-SECTORS-WRITTEN-DELTA

2018Q1-02-etcd-zookeeper-consul/write-1M-keys-best-throughput/AVG-READ-BYTES-NUM-DELTA

2018Q1-02-etcd-zookeeper-consul/write-1M-keys-best-throughput/AVG-WRITE-BYTES-NUM-DELTA

2018Q1-02-etcd-zookeeper-consul/write-1M-keys-best-throughput/AVG-RECEIVE-BYTES-NUM-DELTA

2018Q1-02-etcd-zookeeper-consul/write-1M-keys-best-throughput/AVG-TRANSMIT-BYTES-NUM-DELTA

dbtester's People

Contributors

ericchiang avatar gyuho avatar spzala avatar xuanswe avatar

Stargazers

 avatar  avatar  avatar  avatar  avatar  avatar  avatar  avatar  avatar  avatar  avatar  avatar  avatar  avatar  avatar  avatar  avatar  avatar  avatar  avatar  avatar  avatar  avatar  avatar  avatar  avatar  avatar  avatar  avatar  avatar  avatar  avatar  avatar  avatar  avatar  avatar  avatar  avatar  avatar  avatar  avatar  avatar  avatar  avatar  avatar  avatar  avatar  avatar  avatar  avatar  avatar  avatar  avatar  avatar  avatar  avatar  avatar  avatar  avatar  avatar  avatar  avatar  avatar  avatar  avatar  avatar  avatar  avatar  avatar  avatar  avatar  avatar  avatar  avatar  avatar  avatar  avatar  avatar  avatar  avatar  avatar  avatar  avatar  avatar  avatar  avatar  avatar  avatar  avatar  avatar  avatar  avatar  avatar  avatar  avatar  avatar  avatar  avatar  avatar  avatar

Watchers

 avatar  avatar  avatar  avatar  avatar  avatar  avatar  avatar  avatar  avatar  avatar  avatar  avatar  avatar  avatar  avatar  avatar  avatar  avatar  avatar  avatar  avatar  avatar

dbtester's Issues

update Google Cloud API client import paths and more

The Google Cloud API client libraries for Go are making some breaking changes:

  • The import paths are changing from google.golang.org/cloud/... to
    cloud.google.com/go/.... For example, if your code imports the BigQuery client
    it currently reads
    import "google.golang.org/cloud/bigquery"
    It should be changed to
    import "cloud.google.com/go/bigquery"
  • Client options are also moving, from google.golang.org/cloud to
    google.golang.org/api/option. Two have also been renamed:
    • WithBaseGRPC is now WithGRPCConn
    • WithBaseHTTP is now WithHTTPClient
  • The cloud.WithContext and cloud.NewContext methods are gone, as are the
    deprecated pubsub and container functions that required them. Use the Client
    methods of these packages instead.

You should make these changes before September 12, 2016, when the packages at
google.golang.org/cloud will go away.

pkg/report: fatal error: concurrent map read and map write

When a bunch of zk: node already exists error happens

2017-01-17 23:56:11.799714 I | control: sending message [index: 2 | operation: "Heartbeat" | database: "ZooKeeper" | endpoint: "10.240.0.28:3500"]
2017-01-17 23:56:11.802353 I | control: got response [index: 2 | endpoint: "10.240.0.28:3500" | response: success:true ]
fatal error: concurrent map read and map write

goroutine 1713 [running]:
runtime.throw(0xee0111, 0x21)
	/usr/local/go/src/runtime/panic.go:566 +0x95 fp=0xc437066510 sp=0xc4370664f0
runtime.mapaccess1_faststr(0xd85d40, 0xc427d3a5a0, 0xed7177, 0x17, 0xc4331c4d00)
	/usr/local/go/src/runtime/hashmap_fast.go:201 +0x4f3 fp=0xc437066570 sp=0xc437066510
github.com/coreos/dbtester/vendor/github.com/coreos/etcd/pkg/report.(*report).processResult(0xc42014d000, 0xc437066640)
	/home/gyuho/go/src/github.com/coreos/dbtester/vendor/github.com/coreos/etcd/pkg/report/report.go:180 +0xa0 fp=0xc437066600 sp=0xc437066570
github.com/coreos/dbtester/vendor/github.com/coreos/etcd/pkg/report.(*report).processResults(0xc42014d000)
	/home/gyuho/go/src/github.com/coreos/dbtester/vendor/github.com/coreos/etcd/pkg/report/report.go:194 +0x118 fp=0xc4370666d0 sp=0xc437066600
github.com/coreos/dbtester/vendor/github.com/coreos/etcd/pkg/report.(*report).Stats.func1(0xc4331c6000, 0xc42014d000)
	/home/gyuho/go/src/github.com/coreos/dbtester/vendor/github.com/coreos/etcd/pkg/report/report.go:114 +0x6d fp=0xc4370667b0 sp=0xc4370666d0
runtime.goexit()
	/usr/local/go/src/runtime/asm_amd64.s:2086 +0x1 fp=0xc4370667b8 sp=0xc4370667b0
created by github.com/coreos/dbtester/vendor/github.com/coreos/etcd/pkg/report.(*report).Stats
	/home/gyuho/go/src/github.com/coreos/dbtester/vendor/github.com/coreos/etcd/pkg/report/report.go:127 +0x67

goroutine 1 [semacquire]:
sync.runtime_Semacquire(0xc420250814)

analyze: output separate CSVs for graphs

Currently it aggregates 3 CSVs into one. Now that we have disk, network stats, the number of columns are over 50.

We need separate CSVs for graphs and make it easy for other viz tools.

  • average, aggregated CSV from 3 servers
  • CSV for CPU
  • CSV for Memory
  • CSV for Throughput
  • CSV for Latency
  • CSV for percentile
  • CSV for Disk stats
  • CSV for Network stats

analyze: aggregate by client-num

Currently we record client-number by second

CLIENT-NUM | LATENCY-MS
-----------------------
1          |  30.1
1          |  30.1
1          |  30.1
5          |  30.1
5          |  30.1

We need to aggregate by client-num to make it easy to graph

benchmark, writes: etcd, Zookeeper, Consul test metrics

Here's the new test cases to be implemented, or just to be configured, for better performance comparison.

At the very high level:

  1. Throughput; scale the clients to find the best throughput T of each database ()
    • For graph, x-axis is the number of clients
    • y-axis is the average throughput for the corresponding client number k
      • raw data should be aggregated by client
    • y-axis should also show the minimum and maximum throughput for that client number
    • test case #1: 256-byte key, 1024-byte value, 1-million entries, total 1.3 GB, variable client numbers
      • e.g. client numbers could be 1, 3, 5, 10, 50, 100, 500, 700, 1000, ...
  2. Latency; measure the latency with the best-possible throughput
    • Choose the client number K with the best throughput T, for each database
    • No rate limit
    • For graph, just show the latency distribution with box plots
    • test case #2: 256-byte key, 1024-byte value, 1-million entries, total 1.3 GB, client number K
  3. Disk; measure sector written
    • sector written should be greater than disk writes in /proc/diskstats
    • make sure numbers match up, there could be race in metrics collector
    • For graph, x-axis is the number of clients
    • y-axis is the number of sectors written per clients, per database
      • this would be the rough estimates from 3 nodes' system metrics
      • interpolate each CSV, and get the average value by unix second
    • use the test case #1
    • need to improve data visualization (TODO: gnuplot)
  4. Disk utilization; measure the total database size on filesystem
    • du -sh $HOME/etcd.data
    • just explain with plain table with sums
    • use the test case #1
  5. Network; measure the total network overhead between peers, clients
    • use the netstat data in system metrics
    • just explain with plain table with sums
    • use the test case #1
  6. CPU; measure the overall system load
    • CPU numbers per PID might not be accurate
    • use the overall system load numbers from top command
    • For graph, x-axis is the number of clients
    • y-axis is the average system load numbers for each database
      • this would be the rough estimates from 3 nodes' system metrics
      • interpolate each CSV, and get the average value by unix second
    • use the test case #1
    • need to improve data visualization (TODO: gnuplot)
  7. Memory; measure the memory usage as number of keys grow
    • For graph, x-axis is the cumulative number of keys (estimated)
      • if database A has average memory M and 'cumulative' throughput 32,000, at second x, the x-value would be 30,000 and y-value would be M
    • y-axis is the memory being used, by the number of keys
    • test case #3: 256-byte key, 1024-byte value, 1-million entries, total 1.3 GB, 1,000 clients
  8. Latency with too many keys; keep writing until the last database breaks
    • For graph, x-axis is the cumulative number of keys (estimated, same as case 7)
    • y-axis is the average latency, by the number of keys
    • use the best-possible throughput of each database from the case 1
    • test case #4: 256-byte key, 1024-byte value, X-million entries, total X GB, client number K

control: record number of clients

There's some discrepancy between the number of rows in combined benchmark results
and the one in system metrics because system metrics is collected including pausing periods,
while benchmark results are combined from multiple reports without including pause times.

handle missing timestamps in monitor data

CPU and memory monitoring records usage for every-second, but
sometimes there could be some gaps of a few seconds where data
did not get collected. This causes a problem when aggregating with
benchmark data which also fills in missing timestamps.

We need a way to fill in these empty rows with estimates.

automatic deployment

Need better way to spin up testing instances...

  1. use cloud provider API
  2. use cluster management tool (kubernetes)

Either way, it needs to be more automatic.

panic: Unexpected error from context packet: context deadline exceeded

2017-02-03 22:51:39.543127 I | control: step 3: stopping databases...
2017-02-03 22:51:39.543264 I | control: sending message [index: 0 | operation: "Stop" | database: "etcdv3" | endpoint: "10.240.0.20:3500"]
2017-02-03 22:51:40.543563 I | control: sending message [index: 1 | operation: "Stop" | database: "etcdv3" | endpoint: "10.240.0.21:3500"]
2017-02-03 22:51:41.543750 I | control: sending message [index: 2 | operation: "Stop" | database: "etcdv3" | endpoint: "10.240.0.22:3500"]
2017-02-03 22:51:50.337145 I | control: got response [index: 0 | endpoint: "10.240.0.20:3500" | response: success:true datasize:2840425696 ]
2017-02-03 22:51:50.885129 I | control: got response [index: 1 | endpoint: "10.240.0.21:3500" | response: success:true datasize:2852999600 ]
panic: Unexpected error from context packet: context deadline exceeded

goroutine 32325 [running]:
panic(0xd527e0, 0xc4283a2450)
	/usr/local/go/src/runtime/panic.go:500 +0x1a1
github.com/coreos/dbtester/vendor/google.golang.org/grpc/transport.ContextErr(0x13ad980, 0x1638c98, 0x1638c98, 0x1, 0x0)
	/home/gyuho/go/src/github.com/coreos/dbtester/vendor/google.golang.org/grpc/transport/transport.go:566 +0x213
github.com/coreos/dbtester/vendor/google.golang.org/grpc/transport.(*Stream).Header(0xc42025a4b0, 0xf73720, 0xc42e933a70, 0x13bb860)
	/home/gyuho/go/src/github.com/coreos/dbtester/vendor/google.golang.org/grpc/transport/transport.go:241 +0x11a
github.com/coreos/dbtester/vendor/google.golang.org/grpc.recvResponse(0x0, 0x0, 0x13b7c00, 0x1638c98, 0x0, 0x0, 0x0, 0x0, 0x13aee00, 0xc42b552640, ...)
	/home/gyuho/go/src/github.com/coreos/dbtester/vendor/google.golang.org/grpc/call.go:61 +0xaa
github.com/coreos/dbtester/vendor/google.golang.org/grpc.invoke(0x7f1dd3a03218, 0xc42be7d440, 0xf07f1c, 0x1d, 0xe45d20, 0xc42cc66000, 0xe45e00, 0xc4283a23d0, 0xc42033e900, 0x0, ...)
	/home/gyuho/go/src/github.com/coreos/dbtester/vendor/google.golang.org/grpc/call.go:208 +0x8a1
github.com/coreos/dbtester/vendor/google.golang.org/grpc.Invoke(0x7f1dd3a03218, 0xc42be7d440, 0xf07f1c, 0x1d, 0xe45d20, 0xc42cc66000, 0xe45e00, 0xc4283a23d0, 0xc42033e900, 0x0, ...)
	/home/gyuho/go/src/github.com/coreos/dbtester/vendor/google.golang.org/grpc/call.go:118 +0x19c
github.com/coreos/dbtester/agent/agentpb.(*transporterClient).Transfer(0xc42e1de0d8, 0x7f1dd3a03218, 0xc42be7d440, 0xc42cc66000, 0x0, 0x0, 0x0, 0x0, 0xc426e1c0f8, 0x9)
	/home/gyuho/go/src/github.com/coreos/dbtester/agent/agentpb/message.pb.go:183 +0xd2
github.com/coreos/dbtester/control.sendReq(0xc42013bd00, 0x10, 0x100000001, 0xc4201695c0, 0x27, 0x0, 0xc4201450e0, 0x11, 0x0, 0x186a0, ...)
	/home/gyuho/go/src/github.com/coreos/dbtester/control/step1_start_database.go:79 +0x55f
github.com/coreos/dbtester/control.bcastReq.func1(0xc420164200, 0xc4200ca000, 0xc42f5d6e40, 0xc42f5d6de0, 0x2)
	/home/gyuho/go/src/github.com/coreos/dbtester/control/step1_start_database.go:36 +0xa5
created by github.com/coreos/dbtester/control.bcastReq
	/home/gyuho/go/src/github.com/coreos/dbtester/control/step1_start_database.go:41 +0x1df

Remove unnecessary vendoring in 'pkg'

We have a bunch of copied packages from etcd inside 'pkg'
only because we do not want to update the etcd/clientv3 dependency
yet.

Once we finish the etcd v3.1 tests, just vendor directly from etcd.

pkg/report: panic in 'control'

2017-01-17 20:36:56.724117 I | control: step 1: starting databases...
2017-01-17 20:36:56.724274 I | control: sending message [index: 0 | operation: "Start" | database: "etcdv3" | endpoint: "10.240.0.20:3500"]
2017-01-17 20:36:56.729498 I | control: got response [index: 0 | endpoint: "10.240.0.20:3500" | response: success:true ]
2017-01-17 20:36:57.724372 I | control: sending message [index: 1 | operation: "Start" | database: "etcdv3" | endpoint: "10.240.0.21:3500"]
2017-01-17 20:36:57.730303 I | control: got response [index: 1 | endpoint: "10.240.0.21:3500" | response: success:true ]
2017-01-17 20:36:58.724626 I | control: sending message [index: 2 | operation: "Start" | database: "etcdv3" | endpoint: "10.240.0.22:3500"]
2017-01-17 20:36:58.730280 I | control: got response [index: 2 | endpoint: "10.240.0.22:3500" | response: success:true ]

2017-01-17 20:37:04.725011 I | control: step 2: starting tests...
2017-01-17 20:37:04.725154 I | control: write generateReport is started...
 2000000 / 2000000 Boooooooooooooooooooooooooooooooooooooooooooooooooooooooooooooooooooooooooooooooooo! 100.00% 50s
panic: runtime error: invalid memory address or nil pointer dereference
[signal SIGSEGV: segmentation violation code=0x1 addr=0x0 pc=0x6559ae]

goroutine 2284 [running]:
panic(0xd90540, 0xc4200100e0)
	/usr/local/go/src/runtime/panic.go:500 +0x1a1
github.com/coreos/dbtester/vendor/github.com/coreos/etcd/pkg/report.(*secondPoints).getTimeSeries(0x0, 0x0, 0x0, 0x0)
	/home/gyuho/go/src/github.com/coreos/dbtester/vendor/github.com/coreos/etcd/pkg/report/timeseries.go:69 +0x5e
github.com/coreos/dbtester/vendor/github.com/coreos/etcd/pkg/report.(*report).Stats.func1(0xc420cea1e0, 0xc420ed8300)
	/home/gyuho/go/src/github.com/coreos/dbtester/vendor/github.com/coreos/etcd/pkg/report/report.go:125 +0x11d
created by github.com/coreos/dbtester/vendor/github.com/coreos/etcd/pkg/report.(*report).Stats
	/home/gyuho/go/src/github.com/coreos/dbtester/vendor/github.com/coreos/etcd/pkg/report/report.go:127 +0x67

tune zookeeper

currently we use default configuration, which might not be optimal in our testing environment.

control: panic in startRequests

2017-01-17 23:21:17.665187 I | control: sending message [index: 2 | operation: "Heartbeat" | database: "ZooKeeper" | endpoint: "10.240.0.28:3500"]
2017-01-17 23:21:17.666672 I | control: got response [index: 2 | endpoint: "10.240.0.28:3500" | response: success:true ]
panic: runtime error: invalid memory address or nil pointer dereference
[signal SIGSEGV: segmentation violation code=0x1 addr=0x0 pc=0x4a0499]

goroutine 11332 [running]:
panic(0xd91580, 0xc42000e0e0)
	/usr/local/go/src/runtime/panic.go:500 +0x1a1
github.com/coreos/dbtester/control.(*benchmark).startRequests.func1(0xc4201a2b00, 0x0)
	/home/gyuho/go/src/github.com/coreos/dbtester/control/step2_stress_database.go:108 +0x189
created by github.com/coreos/dbtester/control.(*benchmark).startRequests
	/home/gyuho/go/src/github.com/coreos/dbtester/control/step2_stress_database.go:112 +0x9e

automate uploading test results, logs

Currently, I manually ssh into machines and run CLI to store test results and logs to cloud storage.
Automate this.

Currently the manual process as:

# each server
gsutil -m cp /mnt/ssd0/monitor.csv gs://dbtester/test-02-etcd-server-3.csv
gsutil -m cp /mnt/ssd0/database.log gs://dbtester/test-02-etcd-server-3.log
gsutil -m cp /mnt/ssd0/dbtester_agent.log gs://dbtester/test-02-etcd-agent-3.log
  • Tester should be able to set test name, and the agents use this to prefix result files.
  • Tester should be able to send cloud storage secret key to agents.
  • Tester should be able to set bucket name to upload logs to.
  • Server uses this key and bucket to upload logs and data to cloud storage.

Recommend Projects

  • React photo React

    A declarative, efficient, and flexible JavaScript library for building user interfaces.

  • Vue.js photo Vue.js

    🖖 Vue.js is a progressive, incrementally-adoptable JavaScript framework for building UI on the web.

  • Typescript photo Typescript

    TypeScript is a superset of JavaScript that compiles to clean JavaScript output.

  • TensorFlow photo TensorFlow

    An Open Source Machine Learning Framework for Everyone

  • Django photo Django

    The Web framework for perfectionists with deadlines.

  • D3 photo D3

    Bring data to life with SVG, Canvas and HTML. 📊📈🎉

Recommend Topics

  • javascript

    JavaScript (JS) is a lightweight interpreted programming language with first-class functions.

  • web

    Some thing interesting about web. New door for the world.

  • server

    A server is a program made to process requests and deliver data to clients.

  • Machine learning

    Machine learning is a way of modeling and interpreting data that allows a piece of software to respond intelligently.

  • Game

    Some thing interesting about game, make everyone happy.

Recommend Org

  • Facebook photo Facebook

    We are working to build community through open source technology. NB: members must have two-factor auth.

  • Microsoft photo Microsoft

    Open source projects and samples from Microsoft.

  • Google photo Google

    Google ❤️ Open Source for everyone.

  • D3 photo D3

    Data-Driven Documents codes.