
Remember: It's all about the looks.

MPAndroidChart ⚡ is a powerful & easy to use chart library for Android. It runs on API level 8 and upwards.
As an additional feature, this library allows cross-platform development between Android and iOS as an iOS version of this library is also available: Charts ⚡


MPAndroidChart is free software, as a result dynamic & realtime data is not officially supported. If you are looking for an enterprise-grade chart solution with extreme realtime performance and tech support, we recommend SciChart Android.

All MPAndroidChart users are entitled to a special discount of 5% off the SciChart store, using the following discount code: MPANDROIDCHART
This project needs you! If you would like to support this project's further development, the creator of this project or the continuous maintenance of this project, feel free to donate. Your donation is highly appreciated (and I love food, coffee and beer). Thank you!
My Bitcoin Wallet (Bitcoin only)
1G8G6tqQ3oh38BvDH3xq8o6gGVMvBTkcUg
My Ethereum Wallet (Ethereum only)
0x04ef098bf9f91871391363e3caf791afa3adc39b
PayPal
- Donate 5 $: Thank's for creating this project, here's a coffee (or some beer) for you!
- Donate 10 $: Wow, I am stunned. Let me take you to the movies!
- Donate 15 $: I really appreciate your work, let's grab some lunch!
- Donate 25 $: That's some awesome stuff you did right there, dinner is on me!
- Or you can also choose what you want to donate, all donations are awesome!
If you like this library, please tell others about it 💕 💕
![]()
![]()
![]()
- Follow me on Twitter: @PhilippJahoda
- Look me up on StackOverflow: Philipp Jahoda
For a brief overview of the most important features, please download the PlayStore Demo MPAndroidChart Example.apk and try it out. The corresponding code for the demo-application is also included in this repository inside the MPChartExample folder.

If you are having questions or problems, you should:
- Review your code. Make absolutely sure that everything is correct on your side.
- Make sure you are using the latest version of the library. Check the release-section.
- Study the Documentation-Wiki or the javadocs
- Search or open questions on stackoverflow with the
mpandroidcharttag - Search known issues for your problem (open and closed)
- Create new issues (please 🔥 search known issues before 🔥, do not create duplicate issues)
- Check this: "how not to contribute"
Please do not expect answers to your questions if you have not considered all above mentioned approaches in advance.
You can have a look at the core features of this libary here.
In order to use the library, there are 4 different options:
1. Gradle dependency (recommended)
- Add the following to your project level
build.gradle:
allprojects {
	repositories {
		maven { url "https://jitpack.io" }
	}
}- Add this to your app
build.gradle:
dependencies {
	implementation 'com.github.PhilJay:MPAndroidChart:v3.0.3'
}
2. Maven
- Add the following to the
<repositories>section of yourpom.xml:
<repository>
       <id>jitpack.io</id>
       <url>https://jitpack.io</url>
</repository>- Add the following to the
<dependencies>section of yourpom.xml:
<dependency>
       <groupId>com.github.PhilJay</groupId>
       <artifactId>MPAndroidChart</artifactId>
       <version>v3.0.3</version>
</dependency>
3. clone whole repository (not recommended)
For a detailed documentation 📔, please have a look at the Wiki or the javadocs.
Furthermore, you can also rely on the MPChartExample folder and check out the example code in that project. The corresponding application to the example project is also available in the Google PlayStore.
You can also join others in a discussion on

-
LineChart (with legend, simple design)
-
LineChart (with legend, simple design)
-
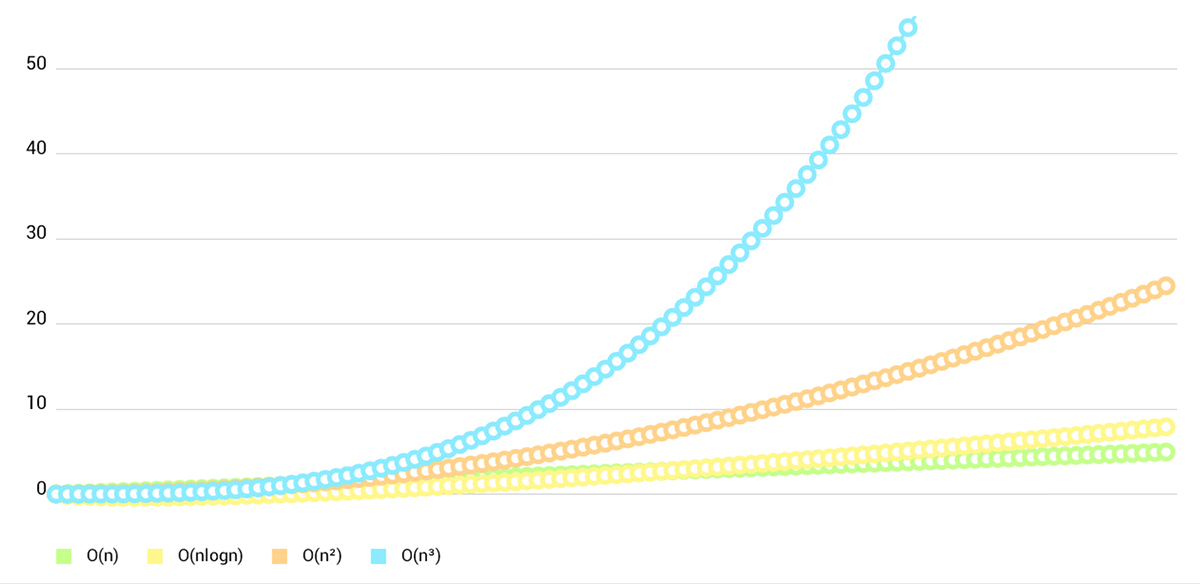
LineChart (cubic lines)
-
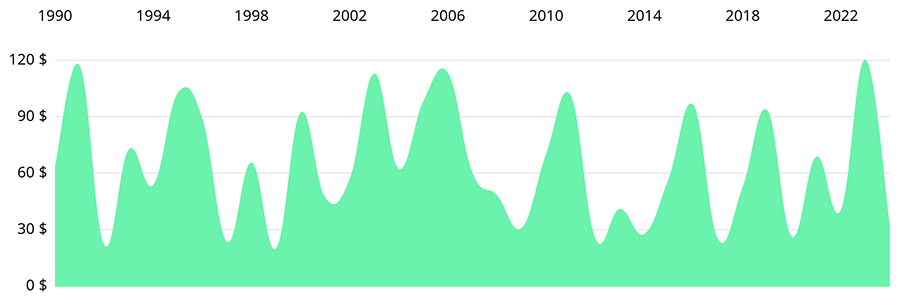
LineChart (gradient fill)
-
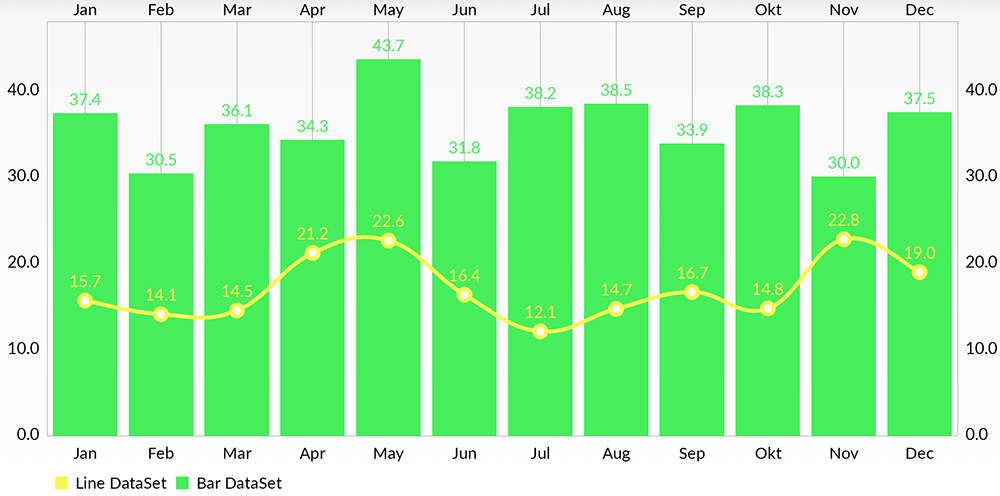
Combined-Chart (bar- and linechart in this case)
-
BarChart (with legend, simple design)


- BarChart (grouped DataSets)

- Horizontal-BarChart
- PieChart (with selection, ...)

- ScatterChart (with squares, triangles, circles, ... and more)

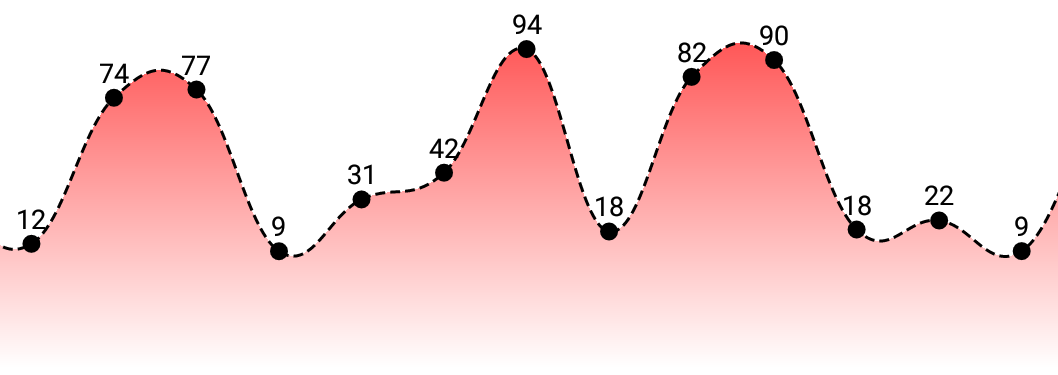
- CandleStickChart (for financial data)

- BubbleChart (area covered by bubbles indicates the yValue)

- RadarChart (spider web chart)

Copyright 2018 Philipp Jahoda
Licensed under the Apache License, Version 2.0 (the "License"); you may not use this file except in compliance with the License. You may obtain a copy of the License at
http://www.apache.org/licenses/LICENSE-2.0
Unless required by applicable law or agreed to in writing, software distributed under the License is distributed on an "AS IS" BASIS, WITHOUT WARRANTIES OR CONDITIONS OF ANY KIND, either express or implied. See the License for the specific language governing permissions and limitations under the License.
Special thanks to danielgindi, mikegr, tony and jitpack.io for their contributions to this project.


