emn178 / chartjs-plugin-labels Goto Github PK
View Code? Open in Web Editor NEWPlugin for Chart.js to display percentage, value or label in Pie or Doughnut.
License: MIT License
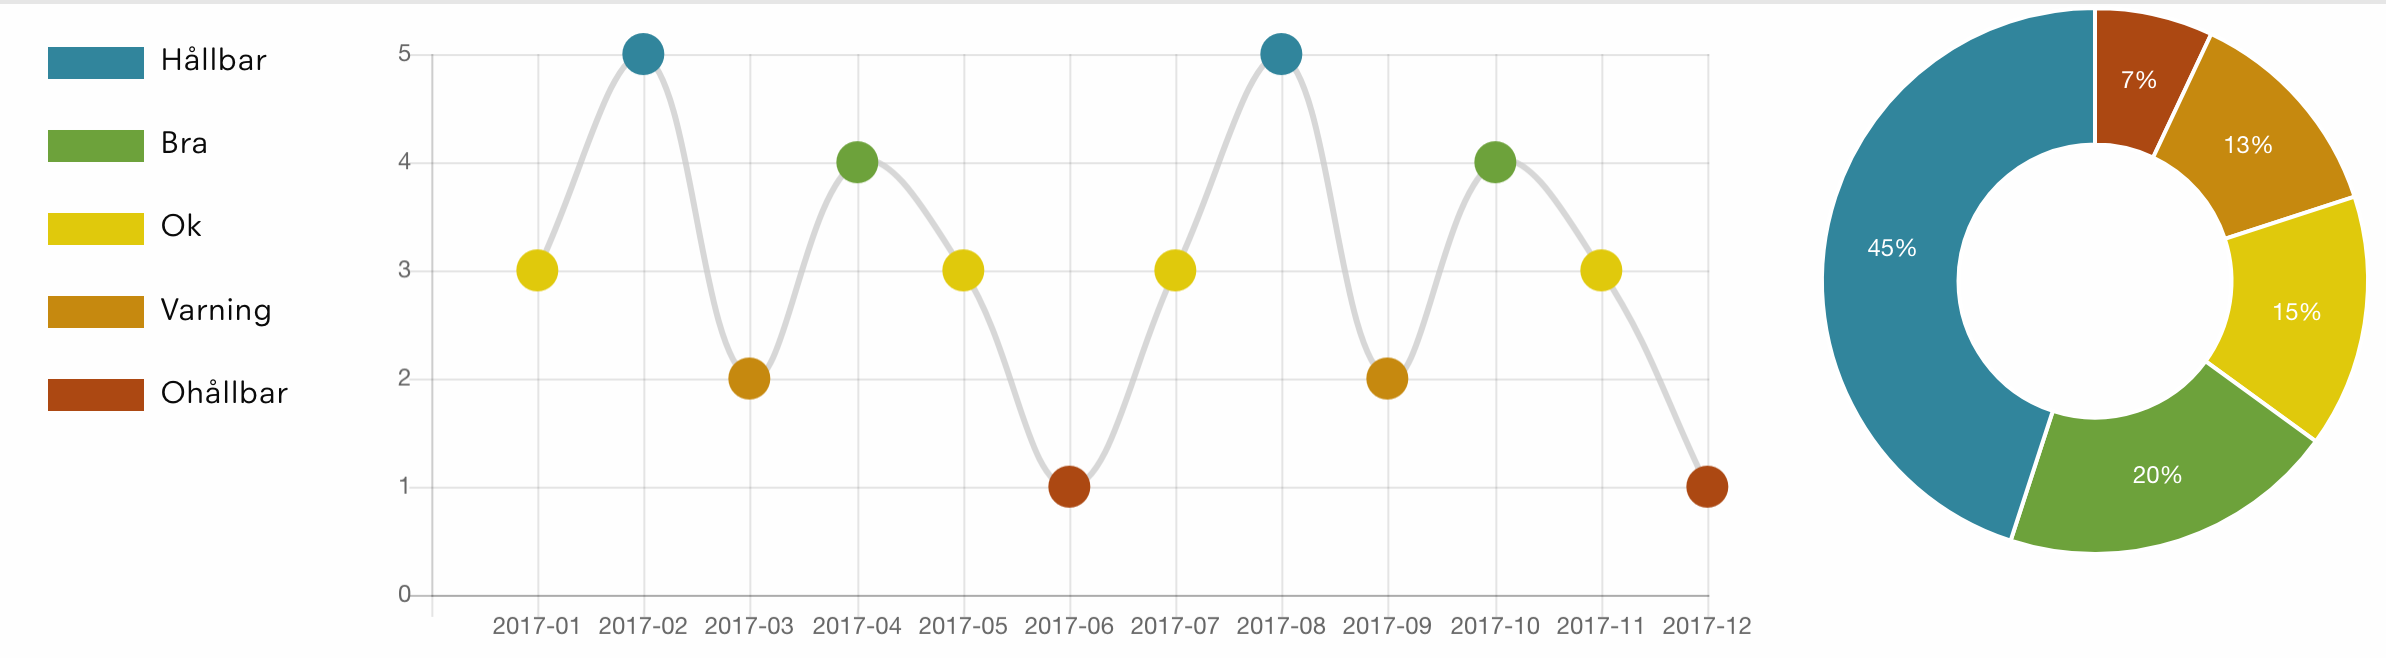
Plugin for Chart.js to display percentage, value or label in Pie or Doughnut.
License: MIT License


Please add a label-parameter in format-function like this:
value = this.format(value, chartInstance.config.data.labels[i]);
Gives more posibilties for formatting the text. Thx.
Hi emn178,
first of all thank you for this handy extension to chartjs.
It works with ease and the fontColor function of your example is a nice way to dynamically determine the font color!
But sadly it doesn't render all values properly in my example:
My definition is:
pieceLabel: {
render: 'percentage',
fontColor: function (data) {
var rgb = rgbStringToObject(data.dataset.backgroundColor[data.index]);
var threshold = 140;
var luminance = 0.299 * rgb.r + 0.587 * rgb.g + 0.114 * rgb.b;
return luminance > threshold ? 'black' : 'white';
},
precision: 0
}
The Chartsize is only 272 * 175 pixels (including the legend and title).
I think, they don't render because there is not enough space.
You got any idea on it or is there any code/configuration enhancement i could go for or could you give me a hint how to remove the fitting check?
Thank you very much in advance.
P.S.: it will display all labels with, but sadly that's not the requirement ;)
pieceLabel: {
render: 'percentage',
fontColor: 'black',
precision: 0,
position: 'outside',
}
I have an requirement to show the gif animation behind doughnut chart which will occupy the center as well as doughnut chart not beyond the doughnut chart? is it possible to use by chart js as well as Chart.PieceLabel.js in angular4 component.
And one more thing is one value will be as 25 means slight orange,50 means little dark orange , if value reaches 75 means much more darker orange , how to achieve is it possible?
Would it be possible to add an option to have the text arc with the segment for when selecting to display the values on the wedges? See image attached for proof-of-concept.

Using Angular 5, PrimeNG and ChartJS 2.7.2. Multiple charts loaded fine before adding PieceLabel. After adding, receive the error: Cannot read property 'afterDatasetsDraw' of undefined. I believe "undefined" in this case is the actual chart object (chart.pieceLabel.* or a.pieceLabel.* in the minified code).
*component.ts loads the PieceLabel minified JS file in the "ngAfterViewInit" lifecycle event. The constructor of this component creates the charts (there are multiple charts on a page, each rendered in a *ngFor loop).
Here is a sample (not all elements shown) of the chart object defined in the constructor (hopefully this formats correctly - GitHub keeps reminding me my browser is no longer supported (using Chrome through my company which is several versions behind))...
this.gauges = [
  {
    name: 'chart1',
    type: 'pie',
    data: {
      datasets: [
        {
          data: [100, 200, 100]
        }
      ]
    },
    options: {
      pieceLabel: {
        render: 'value',
        position: 'outside'
      }
    }
  }
]
(Imagine a couple of more charts added to the "this.gauges" object.)
The PieceLabel JS is being loaded and appears to be registered to the charts. The charts start rendering but stop just as the rendering animation starts (so you see a little bit of the charts on the screen). Then Chrome shows the error in the console.
Within the minified code, the error occurs on this line...
afterDatasetsDraw: function (a) { a.pieceLabel.afterDatasetsDraw(a) }
Thanks.
not working for me when using the angular2-chart.js package. am i missing something? i tried installing via npm, and added this to my component.ts doughnut chart options:
pieceLabel: {
     mode: 'percentage',
     precision: 1,
}
First of all thank you, it's really useful. All I'm wondering is when using percentage render, it just round off the number. I mean if the percentage is 20.66, it shown as just 21. It may not be related to this but do you know any solution to fix it?
...,
pieceLabel: {
    render: 'percentage',
    fontColor: '#fff',
    overlap: true
},
...,
Is it possible to render html instead of just either plain text or image?
I want to use both an image and the value. Is it possible?
how to include this with an angular 2 project
Why is your plugin not following Chart.js plugin conventions?
Following there conventions makes able to declare plugin options in the related plugins
option provided by Chart.js and your visibility should be increased because we know we can find Chart.js plugins by searching everything starting by chartjs-plugin-.
See below:
Does it happen if the number would't fit?
My config:
pieceLabel: {
    mode: this.state.piePercentage ? 'percentage' : 'value',
    precision: 0,
    fontColor: '#333333',
    fontStyle: 'bold',
    format: (v) => {
        return `${symbol}${v.format(0, 3, ',')}`;
    }
}
Copying your code exactly.
var options = {
	  pieceLabel: {
	      // mode 'label', 'value' or 'percentage', default is 'percentage'
	      mode: 'percentage',

	      fontColor: '#000000',

	      // precision for percentage, default is 0
	      precision: 1

	    }
	};
var myPieChart = new Chart(ctx,{
	    type: 'doughnut',
	    data: data,
	    options: options
	});
I'm using MeteorJS and the ChartJS NPM package, along with your NPM package.
All up-to-date.
When filtering data, it's not applying the label to all sections of the graph.

In 086b7f6 you pass the dataset and index to the fontColor method. These would also be useful for the render method, as there can be multiple datasets in one chart, and currently there is no way to know which one you are rendering now.
First, thank you for your nice plugin.
Now, question : Is it possible to have 2 pieceLabel option on the same doughnut ?
example:

percentage inside
  pieceLabel: {
    mode: 'percentage'
  }
and labels outside
  pieceLabel: {
    mode: 'label',
    fontColor: '#000',
    position: 'outside'
  }
Hi,
I have used this code on an Angular 6 ASP Core project. In my development environment (Angular CLI and VS2017) all works very well.
However when I deploy the code to an IIS server the chart labels are not displayed.
Do you have any suggestions please? Any help would be most appreciated.
Regards
Paolo
Hi!
Thank you for this very useful plugin for Chart JS. The issue is that when you hover over a chart, all the slices get darker while normally only the one being hovered gets darker. I have tested this with and without PieceLabel and it is definitely the culprit. If you could take a look into this, thank you!
Chart.js accepts an array with numbers as labels. But using then chart.piecelabel.js does not work. i've solved this for my script by transforming the number to a string array
I tried
textShadow: true,
shadowBlur: 100,
shadowColor: 'rgba(255,0,0,0.75)',
But it doesn't have any effect on the text in the graph.
I set overlap = false and when I load the pie chart I have one slice of 4%. Hovering over this pie slice the 4% label disappears. It seems that anything larger than 4%, the percentage on the pie slice is fine.
it will be nice to support bar, horizontalBar, polarArea.
Hello !
First, thank you for your work, it's been amazingly easier to tweak labels since PieceLabel :)
Do you think it's possible to render only one specific value ?
pieceLabel: {
render: 'value',
}
'value' render all values, I would like to render only a specific one !
Thank you :)
Hi,
I've created a new pull request that extends the font-color-as-function feature that was recently added to version 0.8.0.
This is only a little change: the javascript object that is passed to the font-color callback has some new fields, enabling more accurate label-color calculation for the application, ex. using the background-hover-color or the borderColor of the pie dataset.
In our application, we now use a CanvasPattern as background-color of pie segments, and in order to allow the computation of the background's brightness, we store the original background-color value into the backgroundHoverColor array. So this value is needed now in the fontColor callback function. My pull-request contains all changes that we need. Can you please have a look at it.
Thank you,
best regards,
Peter
Hi,
I have a requirement to use different font colors per segment, to account for contrast not high enough when using very dark and light colors on the same chart.
Basically for dark segments I wish to use a light font color and light segments a dark font color.
pieceLabel: {
	mode: 'value',
	fontColor: '#fff',
	fontSize: 20,
}
to
pieceLabel: {
	mode: 'value',
	fontColor: ['#fff', '#666'],
	fontSize: 20,
}
I have implemented and tested this feature in a fork, would a pull request for it be considered?
Is it possible to add an option to draw the label outside the chart?

Hello, is there a way to have the values outside with a padding and a line pointing to it's respective slice in the pie?
Example, I have a pie where two slices are very thin, and the values outside are very close, wondering if a line pointing from the slice to the value can be added.
Thank you!
How to render label+value in different line.
like below:
CRITICAL
100
MAJOR
99
Hello, I put 2 doughnuts in a table field, strangely, these doughnuts can only grow if I expand my browser (google chrome, and if I shrink the browser, the doughnuts are not resized.
My html:
<div id="chart-container">
    <table id="TableDroitsSalarie">
      <tr>
        <td>
            <canvas baseChart
            [chartType]="salarie.type1"
            [data]="salarie.data1"
            [labels]="salarie.labels1"
            (chartClick)="infoLabel1($event, salarie)"
            [options]="chartOptions">
    </canvas>
        </td>
        <td><canvas baseChart
          [chartType]="salarie.type2"
          [data]="salarie.data2"
          [labels]="salarie.labels2"
          (chartClick)="infoLabel2($event, salarie)"
          [options]="chartOptions">
  </canvas></td>
      </tr>
    </table>
  </div>
My scss :
#chart-container{
        margin: auto;
    }

    #TableDroitsSalarie{
        width: 100%;
        border: solid 1px black;
    }

    td{
        border: solid 1px black;
        width: 50%;
    }
My ts :
  public chartOptions: any = {
    pieceLabel: {
    render: function (args) {
      const label = args.label,
        value = args.value;
      return label + ': ' + value;
    },overlap: true,fontFamily:"verdana", fontSize: 14
    ,responsive: true,	maintainAspectRatio: true
    }
  };
In my code, salarie.type1 and salarie.type2 can only have "doughnut" as value.
Thanks
EDIT : illustration of my issue
Hello, in version 0.9.0, no label is displayed in each slice, here you have my code :
html:
<div id="chart-container">
  <canvas baseChart
          [chartType]="chartType"
          [data]="chartData"
          [labels]="chartLabels"
          [options]="chartOptions">
  </canvas>
</div>
ts :
public chartType: string = 'doughnut';
	public chartLabels: Array<string> = ['January', 'February', 'March'];
	public chartData: Array<number> = [1, 1, 1];
	public chartOptions: any = {
	pieceLabel: {
		render: function (args) {
		const label = args.label,
				value = args.value;
		return label + ': ' + value;
		}
	},
	  legend: {
    	display: true
  	}
 }
My code comes from this link, did I forget something? Thanks
Additional info : I'm in an Ionic project (version 3.91), my version of angular is 4.1.3 and my node version is 8.4.0
Hi. Thank you for the plugin.
Please add examples how it can be used with commonJS and es6 modules.
I have used the piecelable to place the label. But my labels size is bigger so half ( or small portion ) of the label is hiding under the chart slice. You can check this below image:

Can anyone please suggest how can I solve this issue?
Hi, I'm using angular 6+ (with angular cli), and when I make a production build of my projects labels are missing, and there is not any warning in the console about (labels are present as long as I don't use --prod).
First, I've imported it in main.ts, but I also tried to import it after ng2-charts in app.module.ts as suggested on issue #47 :
import { ChartsModule } from 'ng2-charts';
import 'chart.piecelabel.js';
But that didn't work also. I've also added it in angular.json configuration file as:
"scripts": [
  "./node_modules/chart.js/dist/Chart.bundle.min.js",
  "./node_modules/chart.piecelabel.js/build/Chart.PieceLabel.min.js"
]
But that does not have any effect also.
To prevent long text not displaying it could be nice if there is an option to place the text in the border of the chart.

First of all, 👍 for this very helpful plugin.
I found that sometimes the percentage on chart do not show in last segment of the doughnut chart. I tried to debug the issue and found that issue only comes when percentage total go above 100 while adding percentage of last segment. The issue is at below line
percentage -= totalPercentage - 100;
The problem is, once we deduct the overshoot percentage, it will not take the precision into consideration and will result in very long number after decimal point. Due to that it is not getting drawn on last segment.
I think, the solution is to trim the numbers again using toFixed as shown below
percentage = parseFloat(percentage.toFixed(precision));
I did above change in forked repo https://github.com/shripalsoni04/Chart.PieceLabel.js and it is working as expected now.
If the above solution is proper, please release a patch with it or you can create a PR from https://github.com/shripalsoni04/Chart.PieceLabel.js and merge it.
Let me know in case of any concerns.
Thanks.
Is there a way I can make the font size responsive? I use a default font size of 25. But if I make the chart really small I need a smaller font size (automatically).
Thanks in advance
Hi,
currently the fontColor of the texts can be a single color or an array of color-values. It would be nice if we could provide also a function (callback) that will be called automatically, with all needed parameters about the current text/dataset/label, incl. the current backgroundColor. Then the callback could decide itself, which color should be used for that text, ex. it could compute the brightness of the current pie slice (according to the backgroundColor) and decide between "white" and "black" dynamically.
I have implemented this feature in my fork and added a pull-request. It contains also an own example in the demo-page. Can you please have a look at it?
Thanks,
Cheers,
Peter
` var ctx = document.getElementById('myChart4').getContext('2d');
new Chart(ctx, {
type: 'pie',
data: {
datasets: [{
data: [10, 20, 30, 40, 50 ,60]
}],
				// These labels appear in the legend and in the tooltips when hovering different arcs
				labels: [
					'Firefox',
					'Windows',
					'Chrome',
					'Phone Nokia',
					'IE',
					'Mac'
				]
			},

			options: {
				plugins: {
					datalabels: {
						display : false
						}
					},
					tooltips: {
						callbacks: {
							label: function(tooltipItem, data) {
								var dataset = data.datasets[tooltipItem.datasetIndex];
								var total = dataset.data.reduce(function(previousValue, currentValue, currentIndex, array) {
									return previousValue + currentValue;
								});
								var currentValue = dataset.data[tooltipItem.index];
								var precentage = Math.floor(((currentValue/total) * 100)+0.5);
									return precentage + "%";
							}
						}
					},
					hover: {
						mode: 'null'
					},
					pieceLabel: {
						render: 'image',
						images: [
						  { src: 'https://rocketdock.com/images/screenshots/1-9.png', width: 32, height: 22 },
						  { src: 'http://www.iconarchive.com/download/i45768/tatice/operating-systems/Windows.ico', width: 32, height: 22 },
						  { src: 'https://cdn1.iconfinder.com/data/icons/logotypes/32/chrome-512.png', width: 32, height: 22 },
						  { src: 'https://cdn2.iconfinder.com/data/icons/picons-essentials/71/mobile-512.png', width: 32, height: 22 },
						  { src: 'http://www.freeaudiosamples.com/wp-content/uploads/2016/06/Mac-Icon.png', width: 32, height: 22 },
						  { src: 'http://icons.iconseeker.com/ico/longhorn-r2/internet-explorer-6.ico', width: 32, height: 22 }
						]
					}
				}
			});`
this is all my code ragarding the chart, looks really good but the first icon doesn't appear
Is it possible to make this work with Bar charts?
Thanks!
while chart is rotating as per the dynamic value and according to chart rotation, number also gets auto increment in the center position of doughnut chart. is it possible with chart js
Expected the same behaviour in chart js : https://codepen.io/anon/pen/eeLmWz
Hello, I tried adding outsidePadding which I assumed was to add space between label and the chart, but what it adds padding on the canvas instead.
Here's what I got initially.
Upon adding outsidePadding

Hi,
So I updated the plugin to version 1.0.0 and changed to the new settings format.
But now I get broken labels on line chart value-points. They should have none at all.
So here's what happens. I have one line chart and one doughnut chart on the same page. With version 0.8.2 I get labels on the doughnut chart as expected and wanted. The line chart is untouched as expected (there is no setting with the object to use the labels plugin).
Upgrading to version 1.0.0 and simply switching to the new syntax keeps the doughnut chart as is and as exptected. However the line chart is affected and gets "NaN%" as inside label. The line chart object has no setting whatsoever that should fire up the piecelabel function on that chart.
If I remove all other charts on the page it still happens. If I clear out my JS-file and keep only the line chart and associated functions I still get the same issue. The only way to make the line chart appear normal again is to roll back to version 0.8.2.
I have not dug any further into this issue other than trying older versions. I'd be happy to try whatever you need.
Running 0.8.2 and the old syntax (everything as expected):
Upgrading to 1.0.0 and the new syntax (doughnut as expected, line chart is not):

When using your plugin in association with doughnutlabel plugin, arc label and % sign are not properly positioned:
Without doughnutlabel: OK

With doughnutlabel: KO

<canvas id="statistics-chart" height="280"></canvas>

<script>

    var statisticsQuantities = [
        2,
        1,
        2
    ];

    new Chart(document.getElementById('statistics-chart').getContext('2d'), {
        type: 'doughnut',
        data: {
            labels: ['Publications des administrateurs', 'Publications des élèves', 'Trombinoscopes'],
            datasets: [{
                data: [
                    0.1,
                    0.05,
                    0.13,
                    0.72
                ],
                backgroundColor: ['rgba(107, 201, 199, 1)', 'rgba(39, 181, 179, 1)', 'rgba(255, 210, 3, 1)', 'rgba(0, 0, 0, 0)'],
                hoverBorderColor: ['rgba(0, 0, 0, 0)', 'rgba(0, 0, 0, 0)', 'rgba(0, 0, 0, 0)', 'rgba(0, 0, 0, 0)']
            }]
        },
        options: {
            legend: { position: 'bottom' },
            tooltips: {
                displayColors: false,
                callbacks: {
                    title: function (tooltipItems, data) {
                        var title = '';
                        tooltipItems.forEach(function (tooltipItem) {
                            title = data.labels[tooltipItem.index] ? data.labels[tooltipItem.index] : 'Reste à faire';
                        });
                        return title;
                    },
                    label: function (tooltipItem, data) {
                        return statisticsQuantities[tooltipItem.index] ? 'Quantité : ' + statisticsQuantities[tooltipItem.index] : '';
                    },
                    afterLabel: function (tooltipItem, data) {
                        return 'Taux : ' + (data.datasets[tooltipItem.datasetIndex].data[tooltipItem.index] * 100) + '%';
                    }
                }
            },
            rotation: 0.1 * Math.PI,
            pieceLabel: [
                {
                    render: function (args) { return statisticsQuantities[args.index] ? statisticsQuantities[args.index].toString() : ''; },
                    fontSize: 18,
                    fontStyle: 'bold',
                    fontColor: '#fff'
                },
                {
                    render: 'percentage',
                    fontSize: 18,
                    fontStyle: 'bold',
                    fontColor: ['rgba(107, 201, 199, 1)', 'rgba(39, 181, 179, 1)', 'rgba(255, 210, 3, 1)', 'rgba(0, 0, 0, 0)'],
                    arc: true,
                    position: 'outside'
                }
            ],
            plugins: {
                doughnutlabel: {
                    labels: [
                        {
                            text: 'taux avancement',
                            font: {
                                size: 15,
                                weight: 'bold'
                            }
                        },
                        {
                            text: 'projet',
                            font: {
                                size: 15,
                                weight: 'bold'
                            }
                        },
                        {
                            text: '28%',
                            font: {
                                size: 40,
                                weight: 'bold'
                            }
                        }
                    ]
                }
            }
        }
    });

</script>Hi, is it possible to display an image on a piece rather than text? Thanks.
Inside a piece/sector would it be possible to position the label on the "right" side?

Is it possible to have condition on the custom render?
When using this code it will not show any labels at all.
If the Pie has a lot of small pieces it will be nice to choose to not show them.
pieceLabel: { render: function (args) { if (args.percentage > 5) return args.label; }, fontColor: '#000', position: 'outside', segment: true }
Hi! When I come from other component to component with charts, all fine. But, if i refresh component with charts, log write to me:
Can not find Chart object.
Thank you for this plugin 👍
I've installed this plugin using Yarn and just noticed that I'm using an older version (0.1.0).
So I tried to upgrade it but Yarn still installed the old version so I assume that you forgot to do npm publish because as I can see in https://www.npmjs.com/package/chart.piecelabel.js it still shows that the latest package version is 0.1.0 😉
You can find more info about updating npm packages here -
https://docs.npmjs.com/getting-started/publishing-npm-packages#updating-the-package
Thanks!
A declarative, efficient, and flexible JavaScript library for building user interfaces.
🖖 Vue.js is a progressive, incrementally-adoptable JavaScript framework for building UI on the web.
TypeScript is a superset of JavaScript that compiles to clean JavaScript output.
An Open Source Machine Learning Framework for Everyone
The Web framework for perfectionists with deadlines.
A PHP framework for web artisans
Bring data to life with SVG, Canvas and HTML. 📊📈🎉
JavaScript (JS) is a lightweight interpreted programming language with first-class functions.
Some thing interesting about web. New door for the world.
A server is a program made to process requests and deliver data to clients.
Machine learning is a way of modeling and interpreting data that allows a piece of software to respond intelligently.
Some thing interesting about visualization, use data art
Some thing interesting about game, make everyone happy.
We are working to build community through open source technology. NB: members must have two-factor auth.
Open source projects and samples from Microsoft.
Google ❤️ Open Source for everyone.
Alibaba Open Source for everyone
Data-Driven Documents codes.
China tencent open source team.