Git Product home page Git Product logo

puffin's Introduction

🐦 puffin

The friendly little instrumentation profiler for Rust

Puffin photo by Richard Bartz

(puffin photo by Richard Bartz)

Embark Embark Crates.io Docs dependency status Build Status

How to use

fn my_function() {
    puffin::profile_function!();
    ...
    if ... {
        puffin::profile_scope!("load_image", image_name);
        ...
    }
}

The Puffin macros write data to a thread-local data stream. When the outermost scope of a thread is closed, the data stream is sent to a global profiler collector. The scopes are pretty light-weight, costing around 60 ns on an M1 MacBook Pro.

You have to turn on the profiler before it captures any data with a call to puffin::set_scopes_on(true);. When the profiler is off the profiler scope macros only has an overhead of 1 ns on an M1 MacBook Pro (plus some stack space).

Once per frame you need to call puffin::GlobalProfiler::lock().new_frame();.

Puffin Flamegraph using puffin_egui

Remote profiling

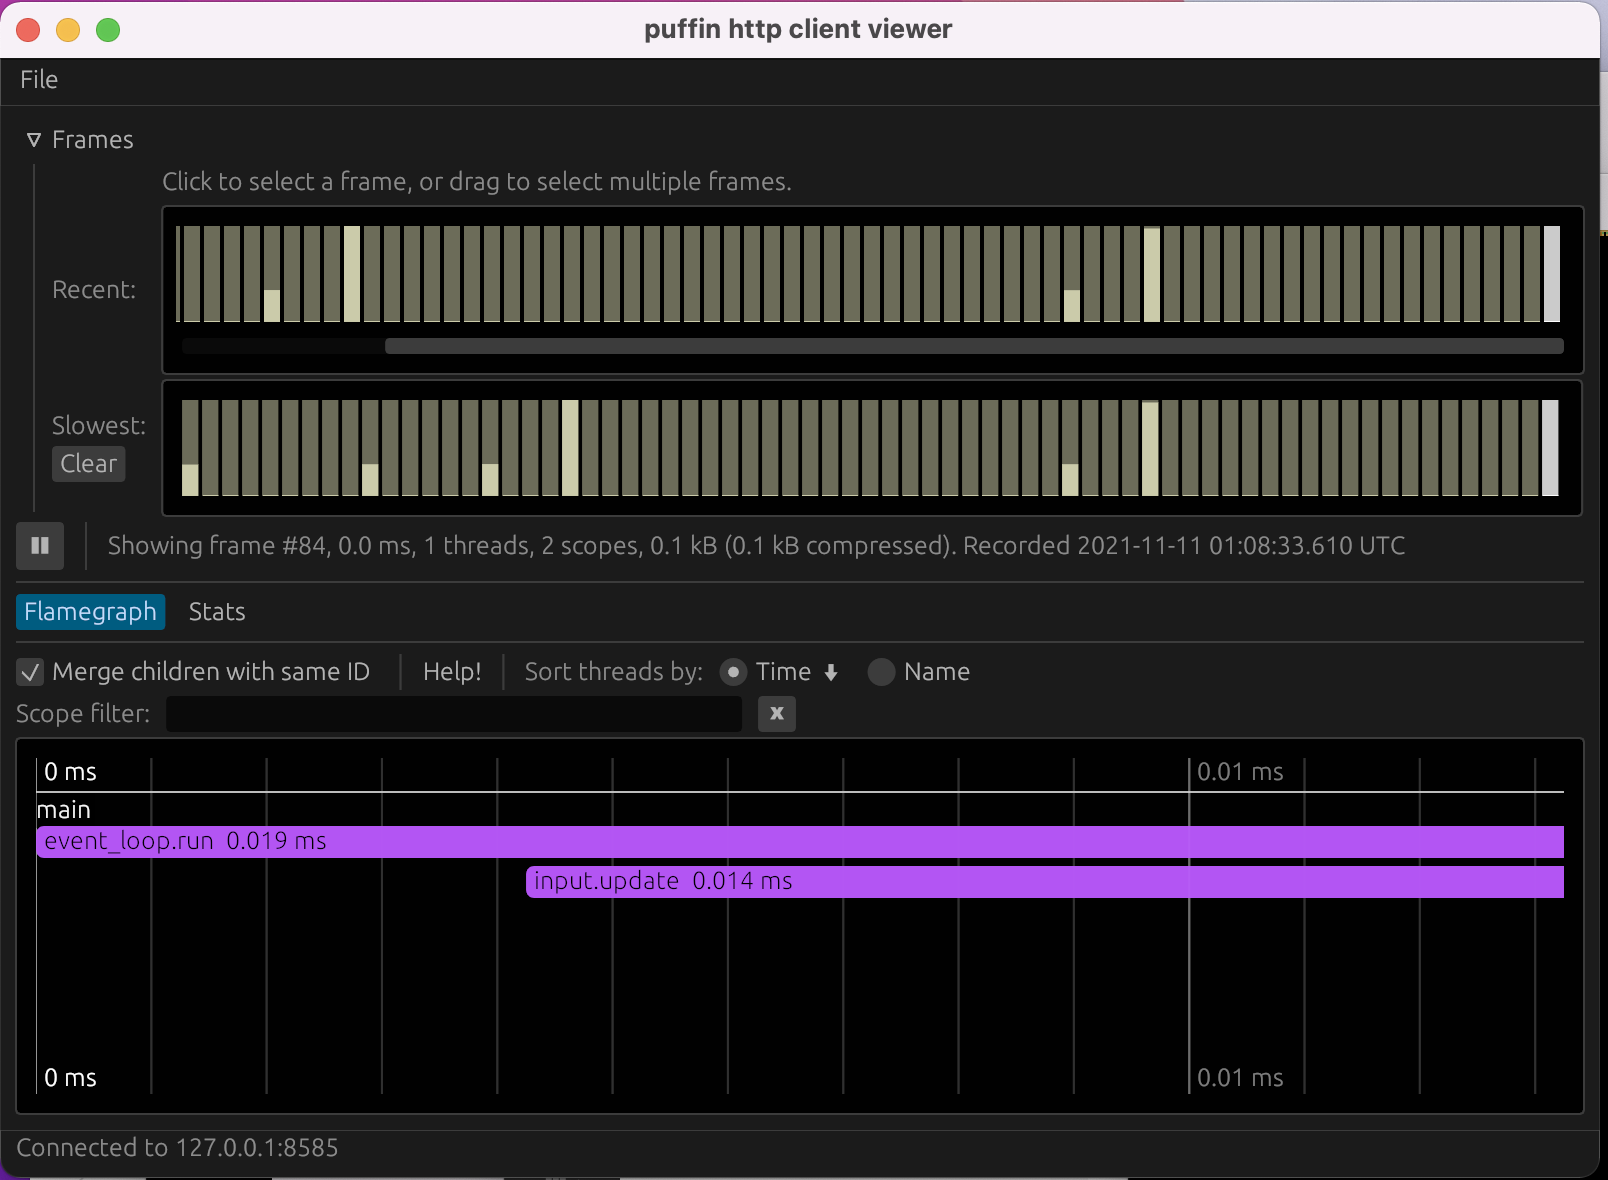
You can use puffin_http to send profile events over TCP to puffin_viewer. This is as easy as:

fn main() {
    let server_addr = format!("127.0.0.1:{}", puffin_http::DEFAULT_PORT);
    let _puffin_server = puffin_http::Server::new(&server_addr).unwrap();
    eprintln!("Run this to view profiling data:  puffin_viewer {server_addr}");
    puffin::set_scopes_on(true);

    …

    // You also need to periodically call
    // `puffin::GlobalProfiler::lock().new_frame();`
    // to flush the profiling events.
}

egui integration

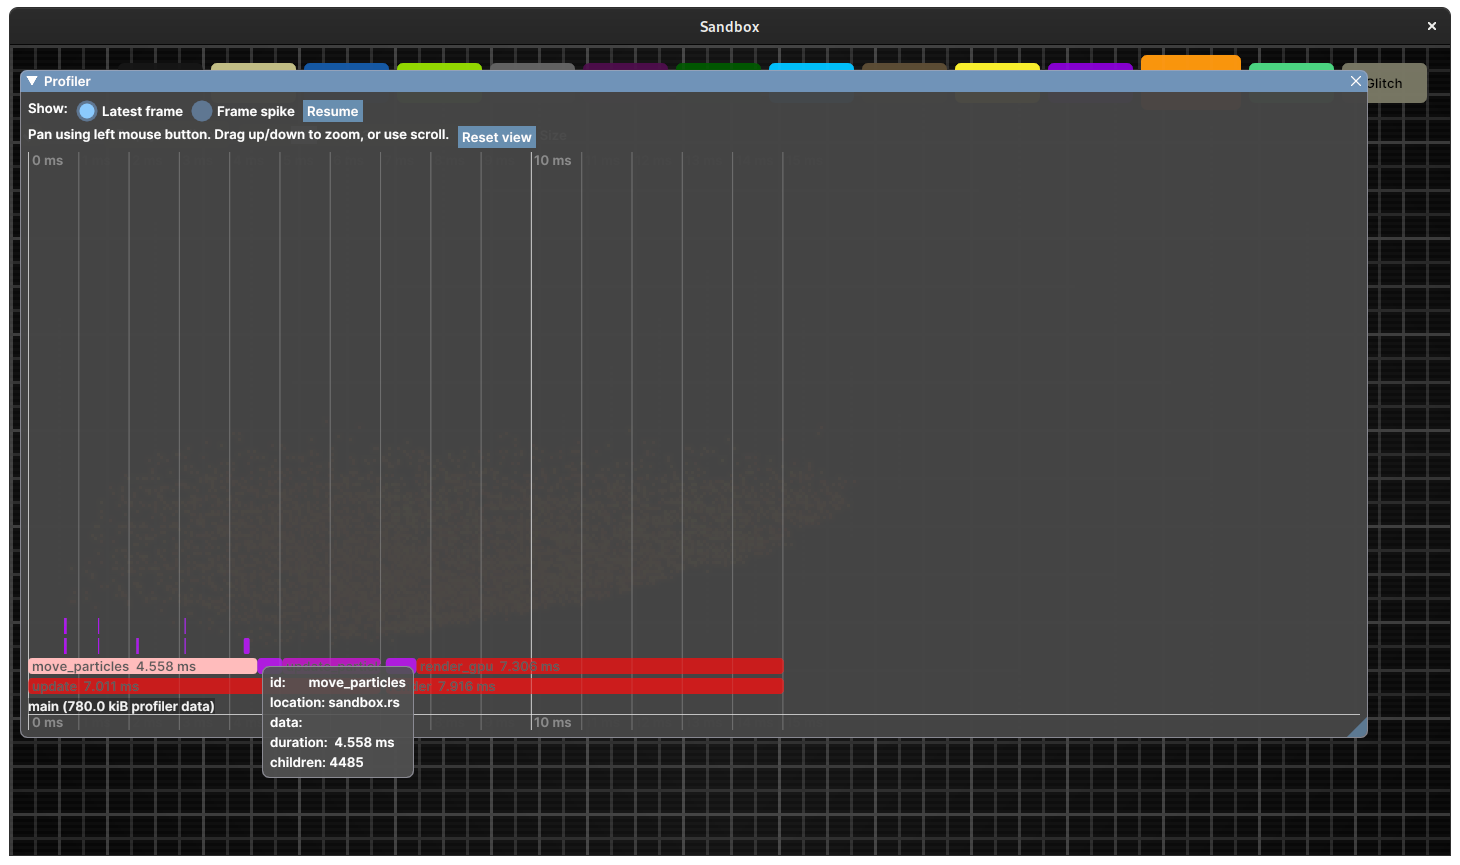
To view the profile data in-game you can use puffin_egui.

If you are using eframe you can look at this example.

Other

Also check out the crate profiling which provides a unifying layer of abstraction on top of puffin and other profiling crates.

Contributing

Contributor Covenant

We welcome community contributions to this project.

Please read our Contributor Guide for more information on how to get started.

Releasing

We use the cargo release tool to manage changelogs, git tags and publishing crates.

Each substantial pull request should add a changelog entry under the [Unreleased] section (see keep a changelog and previous changelog entries). The crate version in Cargo.toml is never updated manually in a PR as it's handled by cargo release.

License

Licensed under either of

at your option.

Contribution

Unless you explicitly state otherwise, any contribution intentionally submitted for inclusion in the work by you, as defined in the Apache-2.0 license, shall be dual licensed as above, without any additional terms or conditions.

puffin's People

Contributors

0xflotus avatar abey79 avatar aclysma avatar bnjbvr avatar cad97 avatar deanbdean avatar emilk avatar fornwall avatar gwen-lg avatar hrydgard avatar jake-shadle avatar janriemer avatar jms55 avatar jnises avatar joe1994 avatar lpil avatar marijns95 avatar maxded avatar nekrolm avatar renski-dev avatar repi avatar rib avatar sidit77 avatar soniasingla avatar tgolsson avatar timonpost avatar tosti007 avatar vzout avatar xampprocky avatar

Stargazers

 avatar  avatar  avatar  avatar  avatar  avatar  avatar  avatar  avatar  avatar  avatar  avatar  avatar  avatar  avatar  avatar  avatar  avatar  avatar  avatar  avatar  avatar  avatar  avatar  avatar  avatar  avatar  avatar  avatar  avatar  avatar  avatar  avatar  avatar  avatar  avatar  avatar  avatar  avatar  avatar  avatar  avatar  avatar  avatar  avatar  avatar  avatar  avatar  avatar  avatar  avatar  avatar  avatar  avatar  avatar  avatar  avatar  avatar  avatar  avatar  avatar  avatar  avatar  avatar  avatar  avatar  avatar  avatar  avatar  avatar  avatar  avatar  avatar  avatar  avatar  avatar  avatar  avatar  avatar  avatar  avatar  avatar  avatar  avatar  avatar  avatar  avatar  avatar  avatar  avatar  avatar  avatar  avatar  avatar  avatar  avatar  avatar  avatar  avatar  avatar

Watchers

 avatar  avatar  avatar  avatar  avatar  avatar  avatar  avatar  avatar  avatar  avatar

puffin's Issues

puffin_viewer fails to start under NVIDIA Wayland.

Describe the bug
puffin_viewer fails to start under NVIDIA Wayland.

To Reproduce
Steps to reproduce the behavior:

  1. Install puffin_viewer wirh cargo
  2. Try to run it under wayland plasma session.

Device:

  • OS: Opensuse tumbleweed
  • Nvidia driver: nvidia-525-53
  • KDE Plasma 5

Additional context
Backtrace

❯ RUST_BACKTRACE=1 puffin_viewer --url 127.0.0.1:8585
INFO [puffin_http::client] Connecting to 127.0.0.1:8585…
thread 'main' panicked at 'called `Result::unwrap()` on an `Err` value: NoAvailablePixelFormat', /home/mark/.cargo/registry/src/github.com-1ecc6299db9ec823/eframe-0.19.0/src/native/run.rs:45:14
stack backtrace:
   0: rust_begin_unwind
             at /rustc/897e37553bba8b42751c67658967889d11ecd120/library/std/src/panicking.rs:584:5
   1: core::panicking::panic_fmt
             at /rustc/897e37553bba8b42751c67658967889d11ecd120/library/core/src/panicking.rs:142:14
   2: core::result::unwrap_failed
             at /rustc/897e37553bba8b42751c67658967889d11ecd120/library/core/src/result.rs:1785:5
   3: eframe::native::run::create_display
   4: eframe::native::run::glow_integration::GlowWinitApp::new
   5: std::thread::local::LocalKey<T>::with
   6: eframe::native::run::glow_integration::run_glow
   7: eframe::run_native
   8: puffin_viewer::main
note: Some details are omitted, run with `RUST_BACKTRACE=full` for a verbose backtrace.

Looks like it is an eframe bug emilk/egui#2018

Remove zstd dependency in favor of ruzstd all together

Right now it looks like ruzstd is used only in the wasm build. I'm not sure if that's because it's not fast enough for other cases, however, when it comes to build time, ruzstd is quite a bit nicer to have instead.

Another option would be to keep it an optional feature, but to expose it as well in the imgui and other subcrates.

puffin_http don't serve when not setting in a variable

Describe the bug

Start puffin_http don't serve when used in ggez game.

To Reproduce

Cargo.toml

[package]
name = "demo"
version = "0.1.0"
edition = "2021"

[dependencies]
ggez = "0.8.1"
puffin_http = "0.11.1"

src/main.rs

use ggez::{
    event,
    graphics::{self, Color},
    Context, GameResult,
};

struct MainState {}

impl MainState {
    fn new() -> GameResult<MainState> {
        Ok(Self {})
    }
}

impl event::EventHandler<ggez::GameError> for MainState {
    fn update(&mut self, ctx: &mut Context) -> GameResult {
        Ok(())
    }

    fn draw(&mut self, ctx: &mut Context) -> GameResult {
        let mut canvas = graphics::Canvas::from_frame(ctx, Color::BLACK);
        canvas.finish(ctx)?;
        Ok(())
    }
}

pub fn main() -> GameResult {
    let server_addr = format!("0.0.0.0:{}", puffin_http::DEFAULT_PORT);
    puffin_http::Server::new(&server_addr).unwrap();

    let cb = ggez::ContextBuilder::new("x", "");
    let (ctx, events_loop) = cb.build()?;
    let state = MainState::new().unwrap();
    event::run(ctx, events_loop, state)
}

When run, nothing crash, but there is no puffin server running. It can be checked with netstat -tupln | grep 8585 on linux.

Expected behavior

Puffin server should be started.

Screenshots

n/a

Device:

  • OS: Linux Ubuntu 22.04

On Windows, short_file_name does not trim the file name

Describe the bug

puffin/puffin/src/lib.rs

Lines 568 to 578 in 616f6ee

/// Removes long path prefix to focus on the last parts of the path (and the file name).
#[doc(hidden)]
pub fn short_file_name(name: &str) -> &str {
// TODO: "foo/bar/src/lib.rs" -> "bar/src/lib.rs"
if let Some(slash) = name.rfind('/') {
// "foo/bar/baz.rs" -> "baz.rs"
&name[slash + 1..]
} else {
name
}
}

This trims the file!() path based on the / delimiters, but file!() uses \ delimiters on Windows.

To Reproduce
Steps to reproduce the behavior:

  1. Run an example on Windows (e.g. one of the puffin_egui examples).
  2. Note that the reported locations of spans differ from the trimmed locations on platforms that use / as the canonical path separator.
  3. Note that this is even more drastic when using a profiled dependency from crates-io (such as puffin_egui itself), as the location path is now absolute rather than relative.

Expected behavior
Path cleaning behavior should be identical on all platforms.

Device:

  • OS: Windows Native
  • Version 21H1 (OS Build 19043.1055)

Reduce bandwidth with `scope_id`s

Problem

Currently each profile scope sends an id and a location.

The id is either the function name (for profile_function!()) or a user-specified static string (profile_scope!("calc_normals")).
The location is the file name (or file path and file number, when #165 is merged).

There is also the data field, which is e.g. the mesh name in fn load_mesh(name: &str) { profile_function!(mesh_name); … }. This could change on each invocation, while the id and location does not.

All these fields are send on each invocation of the profiling macro. This can become quite a lot of bytes if the id and/or location is long (and they become longer in #165).

The compressor mitigates this problem, but at the cost of CPU time.

Solution

Let's introduce:

struct ScopeInfo {
    /// Scope name, or function name (previously called "id")
    name: String,

    /// Path to the file containing the profiling macro
    file: String,

    /// The line number containing the profiling
    line_nr: uint
}

/// A unique id for each scope and `ScopeInfo`.
pub struct ScopeId(u32);

The first time a profiling scope is executed it is assigned a unique ScopeId. It sends its ScopeInfo as a special message on the data stream.
After that, and on each subsequent call, it sends only its scope id and, time stamp, and additional data (e.g. mesh name, which can change each invocation).

This means the scope info is only sent once, saving bandwidth on each repeat invocation.
This would also allow us to send more info for each scope, e.g. the full file path instead of just a short version of it.

This requires a stateful receiver which keeps a lookup table of the scopes. If the ScopeId is just an incremental counter, that lookup is as simple as Vec<ScopeInfo> (which will work as long as we're only looking at profiling scopes from one process at a time).

Puffin should keep track of data over all frames

Is your feature request related to a problem? Please describe.
Seeing current / longest frame is ok, but it doesn't help you profile on average cases.

Describe the solution you'd like
Puffin should keep data for all previous frames, and then puffin-imgui should provide two additional windows:

  1. Frame timeline - Show a bar plot for each frame (X-axis: frame #, Y-axis: time), maybe with a mini-flamegraph in each bar. This is useful because you can see average frame time, or identify a time-period where frame time is spiking.
  2. Histogram: Shows a list of scope names, with their min, max, and average + std deviation running time. Clicking one brings up a bar plot where the X-axis is running time, and the Y-axis is number of times the scope has run for that much time.

Describe alternatives you've considered
It might be too expensive (memory wise) to keep track of all the data, and too expensive (cpu time wise) to show it every frame. Maybe this is something puffin can generate as a file, at the end of running your program.

Is it sensible to sum overlapping thread scopes?

Is your feature request related to a problem? Please describe.

While visualizing delays from an identical starting point - effectively overlapping each other - through scopes manually added to puffin::Stream, the resulting scopes get summed and show a prolonged track. This is an example registering the same 500ms child workload - starting at 0 - three times:

image

Likewise we have GPU workloads where the next command buffer starts running ahead of the previous one completing. Here too - albeit with different names - their entire track gets prolonged to fit every item on the line, even when it exceeds the parent Context `frame 0` Command buffer `2` parent scope despite setting explicit start and end timings for a scope.

image

(I take no responsibility for three different pipelines in the same frame having both a space, hyphen, and underscore 🀣)

That's done by:

puffin/puffin/src/merge.rs

Lines 128 to 133 in 17d0429

// Make sure sibling scopes do not overlap:
let mut relative_ns = 0;
for scope in &mut scopes {
scope.relative_start_ns = scope.relative_start_ns.max(relative_ns);
relative_ns = scope.relative_start_ns + scope.duration_per_frame_ns;
}

This is somewhat related to GPU profiling in #59.

Describe the solution you'd like
I expected either a panic/Err() because of submitting invalid data through the puffin::global_reporter, and not initially knowing that - presumably - profiling submitted for "threads" (a CPU thread in the literal sense) is assumed to run serially. Ie. if the start of the next sibling scope lies before the end of the current, that should be an error?

Describe alternatives you've considered

It'd be great if puffin could somehow visualize these overlapping scopes, maybe a color or pattern to display overdraw? Displaying on multiple tracks is bound to be tricky, hard to see, and pretty much breaks the "flamegraph" concept. Perhaps a different waterfall view like Radeon Graphics Profiler could be considered? This may need a different kind of "profiling mode" to allow such kind of overlaps though.

Misc UI issues with puffin-imgui

Excuse the giant list of things, didn't want to spam the issue tracker with separate items (but if that's preferred, let me know and I'll split this up!)

  1. Very narrow items disappear from view when zooming out:
    disappering_blips

  2. The click-to-zoom behavior triggers erroneously sometimes. Seems more common with small items under cursor

    e.g in the following, I am trying to click and drag side-to-side to pan, but instead it somewhat randomly zooms to fit the item under the mouse:
    click_zoom_glitch

    Maybe just needs to trigger on mouse_released?

  3. The default zoom speed is extremely low, at least with both and mouse and a Thinkpad trackpad

    Personally I found the old right-click based zoom worked well, as I could very quickly zoom in and out over large time intervals. Possibly the two could co-exist, unless there is plans to use right-mouse for something else?

    A larger problem is there appears to be no way to access (and thus customize) the Options struct - ProfilerUi::default() seems to be the only way to instantiate it

  4. Minor thing, but the collapsible "Frames" window takes up quite a lot of vertical space. It's quite a few clicks to change between frames, and view the frame-graph as full height.

    Possibly the widget could be rearranged a little, something like:

     [Pause] [Show/hide history] [Pause/Resume] [Merge children with same ID] [Help]
    
     Recent:  | graph        |
              |______________|
    
     Slowest: | graph       |
     (clear)  |_____________|
    
     Current frame: 3.2ms, 1 threads, 6 scopes, 0.3kB.
    
      _____________________________
     | flame graph                 |
     | ...                         |
     |_____________________________|
    

    Where "Help" would either show a modal or tooltip with the "Drag to pan. Scroll to zoom [...] etc".

    I think this would save about 4 or 5 lines worth of vertical height without impacting the functionality. More drastically, the recent history/slowest frames widgets could possibly be reduced in height, maybe even half the height, but that's a bit more subjective

  5. The "minor ticks" are quite hard to see. They fade in while zooming, but can be very hard to read when zoomed to see two major ticks:

    image

  6. Some labels are invisible when switching to imgui "Light"

    E.g using the Imgui Demo "Tools > Style Editor" window and selecting "Light" from the first Colors dropdown)

    Everything else seems to look good regardless of the active style, just the labels (text and button labels) become ~impossible to read

  7. In "live" mode, the graph time ticks flicker at the end of the graph:

    ticks_flickering

    I guess this is useful in that it clearly indicates where the end of the data is, but looks very jarring

Device:

  • OS: Linux
  • Version: puffin-imgui 0.8.0

Don't merge scopes that have non-matching dynamic data

Scopes can have dynamic data, like this:

puffin::profile_scope!("my_scope_id", my_dynamic_data);

However, puffin's UI still happily merges blocks with different dynamic data together if merging is enabled. It would be nice with a mode that would only merge identical blocks if their dynamic data is also identical, not if it's different.

Profile unit tests

I want to use puffin to profile my tests but am having problems getting the viewer to catch the single frame it produces. It might be related to #85. I've had it somewhat working but that was a few versions of puffin ago.

My tests looks like this right now and I would be happy if something similar worked:

#[test]
fn test_ik_solver_neutral() -> hotham::anyhow::Result<()> {
    let _ = start_puffin_server();
    puffin::profile_function!();
    test_ik_solver(
        include_str!("../../test_data/inverse_kinematics_snapshot_2023-04-12_22.23.47.json"),
        None,
    )
}

The function start_puffin_server is something I wrote to create a puffin_http::Server and keep it alive until the test is done. It calls puffin::GlobalProfiler::lock().new_frame(); when created and dropped. I would like to use something like puffin::profile_unit_test!(); instead. Writing to disk is an option but I would prefer if I can keep the viewer running and update automatically as I change the code and run the test again.

puffin_http clients can't get firsts frame if they are short

Describe the bug
When firsts frames are short, puffin_http client (example: puffin_viewer) can't get firsts frames.

To Reproduce
Steps to reproduce the behavior:

  1. start puffin_viewer
  2. start an app with puffin_http server with short frames (and numbered frames)
  3. look-at frame in viewer, there isn't the first frame(s)

Expected behavior
I expect to be able to get first frame in puffin_viewer

Device:

  • OS: Fedora
  • Version 36

Add cargo-deny to this repo

We use it in all of our repos to validate licenses and avoid duplicate dependencies, but it is missing in this repo.

So we should add a config for it and set it up in CI, plenty of examples to copy from our other repos for it.

Tracking: Make puffin integrate with GPU, async tasks, and thread profiling data.

Besides the main frame in the game loop, a game engine can have asynchronous tasks, threads, or GPU-related work during a frame. Currently, puffin categorizes all scopes under the same puffin frame, which is a problem when it comes to those three situations.

  • GPU work is executed in parallel to the frame.
  • Asynchronous tasks might take multiple frames to complete.
  • Threads are not dependent on frames at all.

This results in a problem described in #59 where the frame time of GPU and CPU is added up when in reality it should not be and where the timing of CPU and GPU need to be aligned. In some of Embark's internal code bases, we have large spikes for threads that take a significant amount of time which in turn make the slowest frame summary window dysfunctional because the normal frames are relatively low compared to them.

Potential suggested solutions:

  • Separate timelines of CPU/GPU with potentially relating both timelines together. Potentially do this by reporting CPU and GPU to different places. Then use two different profilers UIs to visualize them.
  • Simple effort to go around the frame time calculation is to only measure the main thread.

Be able to save and load sessions in viewer

Would be great to be able to save and load a capture session in the Puffin viewer, as an easy way to share it with colleagues and refer back to multiple previous sessions. Ideally just a single file of the stream.

Puffin viewer: typing a space in the scope filter textbox stops and starts the profiling

Describe the bug
Typing a space in the scope filter textbox stops and starts the profiling. It seems the code used to detect the space does not take into account whether a text input field currently has the keyboard focus.

To Reproduce
Steps to reproduce the behavior:

  1. Open puffin viewer
  2. Connect to a profilee
  3. Select the scope filter text input field.
  4. Press space

Expected behavior
It is sometimes useful to have spaces in scope names.
I would expect the scope filter text input field to somehow consume any keyboard input before other code gets to react to it.

Screenshots
image

Device:

  • OS: MacOS Ventura

How to run puffin_egui?

Hello.
I have a problem with profiling with puffin_equi. I can't find info about running.
I try:

cd puffin/puffin_egui
cargo run --release --example macroquad
   Compiling memchr v2.5.0
   Compiling puffin v0.17.0 (/home/mhanusek/work/code/sandbox/puffin/puffin)
warning: associated function `new` is never used
   --> puffin/src/frame_data.rs:189:12
    |
188 | impl PackedStreams {
    | ------------------ associated function in this implementation
189 |     pub fn new(compression_kind: CompressionKind, bytes: Vec<u8>) -> Self {
    |            ^^^
    |
    = note: `#[warn(dead_code)]` on by default

   Compiling puffin_egui v0.23.0 (/home/mhanusek/work/code/sandbox/puffin/puffin_egui)
   Compiling nom v7.1.3
warning: `puffin` (lib) generated 1 warning
   Compiling xcursor v0.3.4
   Compiling wayland-cursor v0.29.5
   Compiling smithay-client-toolkit v0.16.0
   Compiling winit v0.28.6
   Compiling smithay-clipboard v0.6.6
   Compiling egui-winit v0.23.0
   Compiling glutin-winit v0.3.0
   Compiling eframe v0.23.0
    Finished release [optimized] target(s) in 8.68s
     Running `/home/mhanusek/work/code/sandbox/puffin/target/release/examples/macroquad`

What should be on output? Any file?

Record thread relationships

I'd like to be able to record the relationship between a "parent" thread and the tasks it spawns. Consider this:

use rayon::prelude::*;

fn do_many_jobs(jobs: &[Jobs]) -> Vec<Output> {
    puffin::profile_scope!("do_many_jobs")!;
    jobs.par_iter().map(|job| {
        puffin::profile_scope!("do_job");
        do_job(job);
    }).collect()
}

This will show up as one thread with do_many_jobs, and then maybe four worker threads doing do_job. In the flamegrpah however, there is no relationship behind them. It would be great if each do_job scope had an arrow pointing to it from the do_many_jobs scope, showing their connection.

We could maybe accomplish this with something like

use rayon::prelude::*;

fn do_many_jobs(jobs: &[Jobs]) -> Vec<Output> {
    puffin::profile_scope!("do_many_jobs")!;
    let parent_thread_id = puffin::thread_id();
    jobs.par_iter().map(move |job| {
        puffin::profile_scope!("do_job", parent=parent_thread_id);
        do_job(job);
    }).collect()
}

In the recording stream, these thread relationships would be rare, but would require some additional dynamic data. For instance, one extra control-byte which, if some bit is set in it, would be followed by a thread id.
We could use another bit in the same control-byte to indicate if there is any dynamic string, saving us a byte again in common cases.

The thread-id could be the u64 returned by std::thread::current().id().as_u64.

Log text via puffin

I sometimes get .puffin files from users and wished it contained more information. One of the major questions I often have is "was this recorded on a debug build?".

A great solution for this would be to add support for logging text in puffin. puffin could by default log cfg!(debug_assertions) and rust compiler version, for instance, and puffin users could log their application version, build flags, etc.

The viewer should show these log messages in its own window.

Implementation-wise, I think it makes sense to log these as events, which like scopes contains file:line and function name and a start_time, but no end-time, because it is an instantaneous thing.

In the future we could also support showing such events in the flamegraph, so that one can log custom strings that give more context for a function call for instance, similar to the current "dynamic data".

Example

puffin::log!("Debug build: {}", cfg!(debug_assertions));

Export Puffin-Viewer reports from the measured program

Is your feature request related to a problem?
We use Puffin in Meilisearch to measure the indexing functions used and the time they take to process. It is fairly easy to see the blocking steps. We will release this profiling feature as part of the next v1.4. However, we would like to ease the report export. We currently need to ask our users to run the puffin_viewer program alongside their Meilisearch but it would be great to export a report from Meilisearch itself.

Describe the solution you'd like
It would measure just after being started and after being closed. The report would be viewable from puffin_viewer. Every frame would be written to disk in the puffin_viewer format until the program is closed.

Describe alternatives you've considered
Maybe running the puffin_viewer library HTTP server directly from Meilisearch and making it export the report by itself?

Simple example app for puffin-imgui?

Background

I have attempted to integrate puffin into an application, but I am struggling. The instructions in the README are a little sparse, so I had to guess a few parts:

  1. Added puffin and puffin-imgui as dependencies
  2. Before my main event loop, did this:
let mut pui = puffin_imgui::ProfilerUi::default();
puffin::set_scopes_on(true);
  1. In some interesting functions, added puffin::profile_function!(); in the first line and added puffin::profile_scope_data!("thing", "example"); in interesting loops etc
  2. Inside end of main loop I called pui.window(ui);

However this ends up with a window appearing, but only ever contains "No profiling data"

My suggestions

  1. It would be very useful to have a simple example of how to use this. Something only slightly more complex than https://github.com/imgui-rs/imgui-rs/blob/master/imgui-examples/examples/hello_world.rs showing how to correctly wire up everything

  2. Minor thing: The example code in README has : instead of ; at end of lines

  3. Having the little crates.io badge in the puffin-imgui README would be helpful (I put in puffin = "0.3" in Cargo.toml and I incorrectly assumed puffin-imgui was version-locked to this)

Thanks!

puffin_viewer crashes

Describe the bug
Puffin viewer exits at random with code 139 with no discernible cause.
Sometimes Segmentation fault (core dumped) is printed.
This occurs both when connecting to a server or loading a file (puffin_save.gz)

To Reproduce
decompress and open the attached file.
Mess around with the gui (zooming in on stuff, hovering different areas).
Sometimes it crashes right at start, sometimes only after minutes of use.

Device:
Ubuntu 22.04.4 LTS
Linux 6.5.0-18-generic
AMD Ryzen 9 7950X
puffin_viewer v0.20.0

ldd output:

        linux-vdso.so.1 (0x00007ffdcc756000)
        libgtk-3.so.0 => /lib/x86_64-linux-gnu/libgtk-3.so.0 (0x00007fc330400000)
        libgobject-2.0.so.0 => /lib/x86_64-linux-gnu/libgobject-2.0.so.0 (0x00007fc33198a000)
        libgcc_s.so.1 => /lib/x86_64-linux-gnu/libgcc_s.so.1 (0x00007fc33196a000)
        libm.so.6 => /lib/x86_64-linux-gnu/libm.so.6 (0x00007fc330d19000)
        libc.so.6 => /lib/x86_64-linux-gnu/libc.so.6 (0x00007fc330000000)
        /lib64/ld-linux-x86-64.so.2 (0x00007fc331a0b000)
        libgdk-3.so.0 => /lib/x86_64-linux-gnu/libgdk-3.so.0 (0x00007fc3302f9000)
        libgmodule-2.0.so.0 => /lib/x86_64-linux-gnu/libgmodule-2.0.so.0 (0x00007fc331961000)
        libpangocairo-1.0.so.0 => /lib/x86_64-linux-gnu/libpangocairo-1.0.so.0 (0x00007fc33194f000)
        libX11.so.6 => /lib/x86_64-linux-gnu/libX11.so.6 (0x00007fc32fec0000)
        libXi.so.6 => /lib/x86_64-linux-gnu/libXi.so.6 (0x00007fc33193b000)
        libXfixes.so.3 => /lib/x86_64-linux-gnu/libXfixes.so.3 (0x00007fc331933000)
        libcairo-gobject.so.2 => /lib/x86_64-linux-gnu/libcairo-gobject.so.2 (0x00007fc331925000)
        libcairo.so.2 => /lib/x86_64-linux-gnu/libcairo.so.2 (0x00007fc32fd98000)
        libgdk_pixbuf-2.0.so.0 => /lib/x86_64-linux-gnu/libgdk_pixbuf-2.0.so.0 (0x00007fc3318f5000)
        libatk-1.0.so.0 => /lib/x86_64-linux-gnu/libatk-1.0.so.0 (0x00007fc330cef000)
        libatk-bridge-2.0.so.0 => /lib/x86_64-linux-gnu/libatk-bridge-2.0.so.0 (0x00007fc330cb7000)
        libepoxy.so.0 => /lib/x86_64-linux-gnu/libepoxy.so.0 (0x00007fc32fc63000)
        libfribidi.so.0 => /lib/x86_64-linux-gnu/libfribidi.so.0 (0x00007fc330c9b000)
        libgio-2.0.so.0 => /lib/x86_64-linux-gnu/libgio-2.0.so.0 (0x00007fc32fa8a000)
        libpangoft2-1.0.so.0 => /lib/x86_64-linux-gnu/libpangoft2-1.0.so.0 (0x00007fc330c80000)
        libpango-1.0.so.0 => /lib/x86_64-linux-gnu/libpango-1.0.so.0 (0x00007fc330292000)
        libglib-2.0.so.0 => /lib/x86_64-linux-gnu/libglib-2.0.so.0 (0x00007fc32f950000)
        libharfbuzz.so.0 => /lib/x86_64-linux-gnu/libharfbuzz.so.0 (0x00007fc32f881000)
        libfontconfig.so.1 => /lib/x86_64-linux-gnu/libfontconfig.so.1 (0x00007fc330c36000)
        libffi.so.8 => /lib/x86_64-linux-gnu/libffi.so.8 (0x00007fc330c29000)
        libXinerama.so.1 => /lib/x86_64-linux-gnu/libXinerama.so.1 (0x00007fc33028d000)
        libXrandr.so.2 => /lib/x86_64-linux-gnu/libXrandr.so.2 (0x00007fc330280000)
        libXcursor.so.1 => /lib/x86_64-linux-gnu/libXcursor.so.1 (0x00007fc330274000)
        libXcomposite.so.1 => /lib/x86_64-linux-gnu/libXcomposite.so.1 (0x00007fc33026f000)
        libXdamage.so.1 => /lib/x86_64-linux-gnu/libXdamage.so.1 (0x00007fc33026a000)
        libxkbcommon.so.0 => /lib/x86_64-linux-gnu/libxkbcommon.so.0 (0x00007fc32f83a000)
        libwayland-cursor.so.0 => /lib/x86_64-linux-gnu/libwayland-cursor.so.0 (0x00007fc330260000)
        libwayland-egl.so.1 => /lib/x86_64-linux-gnu/libwayland-egl.so.1 (0x00007fc33025b000)
        libwayland-client.so.0 => /lib/x86_64-linux-gnu/libwayland-client.so.0 (0x00007fc33024a000)
        libXext.so.6 => /lib/x86_64-linux-gnu/libXext.so.6 (0x00007fc330233000)
        libxcb.so.1 => /lib/x86_64-linux-gnu/libxcb.so.1 (0x00007fc32f810000)
        libpixman-1.so.0 => /lib/x86_64-linux-gnu/libpixman-1.so.0 (0x00007fc32f765000)
        libfreetype.so.6 => /lib/x86_64-linux-gnu/libfreetype.so.6 (0x00007fc32f69d000)
        libpng16.so.16 => /lib/x86_64-linux-gnu/libpng16.so.16 (0x00007fc32f662000)
        libxcb-shm.so.0 => /lib/x86_64-linux-gnu/libxcb-shm.so.0 (0x00007fc33022c000)
        libxcb-render.so.0 => /lib/x86_64-linux-gnu/libxcb-render.so.0 (0x00007fc32f653000)
        libXrender.so.1 => /lib/x86_64-linux-gnu/libXrender.so.1 (0x00007fc32f646000)
        libz.so.1 => /lib/x86_64-linux-gnu/libz.so.1 (0x00007fc32f62a000)
        libjpeg.so.8 => /lib/x86_64-linux-gnu/libjpeg.so.8 (0x00007fc32f5a9000)
        libdbus-1.so.3 => /lib/x86_64-linux-gnu/libdbus-1.so.3 (0x00007fc32f55b000)
        libatspi.so.0 => /lib/x86_64-linux-gnu/libatspi.so.0 (0x00007fc32f521000)
        libmount.so.1 => /lib/x86_64-linux-gnu/libmount.so.1 (0x00007fc32f4dd000)
        libselinux.so.1 => /lib/x86_64-linux-gnu/libselinux.so.1 (0x00007fc32f4b1000)
        libthai.so.0 => /lib/x86_64-linux-gnu/libthai.so.0 (0x00007fc32f4a6000)
        libpcre.so.3 => /lib/x86_64-linux-gnu/libpcre.so.3 (0x00007fc32f42e000)
        libgraphite2.so.3 => /lib/x86_64-linux-gnu/libgraphite2.so.3 (0x00007fc32f407000)
        libexpat.so.1 => /lib/x86_64-linux-gnu/libexpat.so.1 (0x00007fc32f3d6000)
        libuuid.so.1 => /lib/x86_64-linux-gnu/libuuid.so.1 (0x00007fc32f3cd000)
        libXau.so.6 => /lib/x86_64-linux-gnu/libXau.so.6 (0x00007fc32f3c7000)
        libXdmcp.so.6 => /lib/x86_64-linux-gnu/libXdmcp.so.6 (0x00007fc32f3bd000)
        libbrotlidec.so.1 => /lib/x86_64-linux-gnu/libbrotlidec.so.1 (0x00007fc32f3af000)
        libsystemd.so.0 => /lib/x86_64-linux-gnu/libsystemd.so.0 (0x00007fc32f2e8000)
        libblkid.so.1 => /lib/x86_64-linux-gnu/libblkid.so.1 (0x00007fc32f2b1000)
        libpcre2-8.so.0 => /lib/x86_64-linux-gnu/libpcre2-8.so.0 (0x00007fc32f21a000)
        libdatrie.so.1 => /lib/x86_64-linux-gnu/libdatrie.so.1 (0x00007fc32f20f000)
        libbsd.so.0 => /lib/x86_64-linux-gnu/libbsd.so.0 (0x00007fc32f1f7000)
        libbrotlicommon.so.1 => /lib/x86_64-linux-gnu/libbrotlicommon.so.1 (0x00007fc32f1d4000)
        liblzma.so.5 => /lib/x86_64-linux-gnu/liblzma.so.5 (0x00007fc32f1a9000)
        libzstd.so.1 => /lib/x86_64-linux-gnu/libzstd.so.1 (0x00007fc32f0da000)
        liblz4.so.1 => /lib/x86_64-linux-gnu/liblz4.so.1 (0x00007fc32f0b8000)
        libcap.so.2 => /lib/x86_64-linux-gnu/libcap.so.2 (0x00007fc32f0ad000)
        libgcrypt.so.20 => /lib/x86_64-linux-gnu/libgcrypt.so.20 (0x00007fc32ef6f000)
        libmd.so.0 => /lib/x86_64-linux-gnu/libmd.so.0 (0x00007fc32ef62000)
        libgpg-error.so.0 => /lib/x86_64-linux-gnu/libgpg-error.so.0 (0x00007fc32ef3c000)

Merging child scopes gives skewed timeline view

When one uses the default "Merge children with same ID" it merges a child scopes regardless of the time offset they are on, which gives a skewed view over how the execution worked.

For example this:

image

Becomes:

image

Which can be confusing an unexpected because on the latter (which is default) it looks like there is single large block that is missing smaller profiler scopes on it.

Expected behavior

I did expect it to only merge child scopes that were next to each other on the time line, maybe not exactly (due to timing precision) but not fundamentally change the timing view.

Let's discuss how to proceed with this or if we simply should disable "Merge children with same ID" by default and describe this gotcha, as believe we've internally run into this quite a few times causing confusion as the profiler with it is not showing the correct time perspective on things

QoL improvement for displaying GPU profiling information

The problem

Currently if you want to display GPU timestamps in puffin, you are forced to open a stream and manually convert all your measured timings from GPU timeline to the associated CPU timeline. Since GPU work is always executed an arbitrary time after a submit call, we would either need to:
A: Wait on a fence before proceeding to the next frame to associate GPU timings with the current measured frame
B: Read back n frames back and display that into the current puffin frame
C: Modifying a previously written frame with the measured GPU timings

In case A, puffin displays the total CPU frame plus the time elapsed from cpu work submission to gpu work execution, along with the total GPU frame. While technically correct, this results in a total frame time that is significantly higher compared to the actual frame time of an app, which is not super useful for profiling a total frametime since work overlaps in reality. This is also not an option in general as this forces single buffering.

In case B, puffin displays the measured frame n on the timeline before puffin's measured cpu frame times. This is also technically correct but again suffers from the same issue that case A has (total frame time not being super useful). However this allows for double/triple buffering without too much trouble.

Case C is not something that we are using puffin for, since we use it for realtime visualization of CPU and GPU workloads. This could however be worked around with by allowing a frame visualization delay, but that would be a different Issue alltogether.

Suggestion

I believe puffin would greatly benefit from the ability to separate timelines. Currently it's separated per thread but still shares the same timeline, thus sharing the total execution time. But for GPU timings it makes more sense to be able to define a separate timeline that has it's own "frame time", while potentially still being able to associate CPU and GPU work.

Alternatives

We currently have a little workaround locally that shifts the measured GPU timings to the start of the current puffin frame, essentially working around the total frametime if needed. However this workaround is not ideal and does not give the correct context to where the GPU workload was fired off.

Update to v0.3 of Embark's standard lints

Embark uses a standard set of lints across all repositories. We just upgraded
to version 0.3 of these lints, and this repository needs to be updated to
the new set of lints with any warnings fixed.

Steps

  1. Copy the contents of the lints.rs file from
    EmbarkStudios/rust-ecosystem and replace the old list of lints in the
    src/lib.rs and/or src/main.rs files with the new list.
  2. Run cargo clippy
  3. Update and fix any code that now triggers a new warning.

Calling a profiled function twice in one frame generates separate spans for them in puffin-imgui

image

As you can see, move_particles has 4485 children, yet all of them are really the same function. Maybe it makes sense for each macro to take an option on whether to combine records of the same name or not, during the same frame.

For something like this, where the function runs pretty much the same length every time, it would be better to combine them.

For a function you only call 2-10 times per frame, which could vary in length greatly, it would make more sense to keep them separate.

Upgrading from 0.14.0 to 0.14.1 breaks compatibility with `wasm32-unknown-unknown` target

puffin 0.14.1 introduces a new required wasm import env::now, that's apparently imported by instant. I suspect this is coming from the js-sys ecosystem, or it might even be a WASI standard. There should be a way to opt out of this, so one can use puffin in wasm32-unknown-unknown environments too.

It seems that 0.14.0 didn't depend at all on instant, so making the dependency on instant optional + reuse whatever was used before to retrieve the time, should be sufficient to fix this.

Make puffin_egui use puffin provided timer function

Is your feature request related to a problem? Please describe.
Puffin works in the browser, if you provide it with a custom now() function using puffin::ThreadProfiler::initialize(...). However, puffin_egui does not, since it internally uses std::time for timing, and this function gives 'error time is not implemented on this platform' when running it in the browser environment. This means that currently, puffin_egui is unusable in the browser, due to this small internal catch.

Describe the solution you'd like
puffin_egui could use the puffin::ThreadProfiler's timing function since that one can be configured to something that works and would make puffin_egui just work from a user's perspective.

Describe alternatives you've considered
I guess another option is that puffin_egui also provides a way to use a custom timing function that could be different to the one given to puffin.

Additional context
I hacked the proposed solution into puffin_egui to see if it would work and it does. It's a very rough solution and changes some types, so it's not necessarily PR-worthy.

fn run_pack_pass_if_needed(&mut self, frame_view: &FrameView) {
        // NOTE: This function contains changes compared to the original repository.
        // last_pack_pass is changed from Option<std::time::Instant> to Option<i64>.
        // 'now' is using the ThreadProfiler now function instead of the system time one. Note that I added a public `now_ns_fn()`
        // to the ThreadProfiler too to be able to access the timing function.
        let now = || ThreadProfiler::call(|tp| tp.now_ns_fn());

        let last_pack_pass = *self.last_pack_pass.get_or_insert_with(now);
        let time_in_ns_since_last_pack = (now() - last_pack_pass) as u128;
        if time_in_ns_since_last_pack > std::time::Duration::from_secs(1).as_nanos() {
            puffin::profile_scope!("pack_pass");
            for frame in self.all_known_frames(frame_view) {
                if !self.is_selected(frame_view, frame.frame_index()) {
                    frame.pack();
                }
            }
            self.last_pack_pass = Some(now());
        }
    }

Help Request: Perf issue when using puffin

Thank you for this awesome project!

I am trying to do some tracing measurements for [binocle][1]. However, when I use tracing with puffin (+puffin_http + viewer), there is a significant slowdown and most scopes do not show.

I prepared a branch which you can run: https://github.com/siedentop/binocle/tree/feature/eframe

cargo run --example create_test_file
cargo run --features trace -- binocle_test_file

Could you please help me and tell me what I might have done wrong?

I know that the Binocle::draw method is using most of the time. (And yes, some work should move to a different thread, but I'd like some measurements first.) However, it only gets called if there is a RedrawRequest event, so it doesn't show in the trace viewer.

With puffin::GlobalProfiler::lock().new_frame(); in the main loop:
Screen Shot 2021-11-10 at 5 08 57 PM

And now with puffin::GlobalProfiler::lock().new_frame(); just inside the if let Event::RedrawRequested(_) = event:

Screen Shot 2021-11-10 at 5 13 38 PM

Any ideas? Many thanks (also feel free to close, if this isn't the right venue).

Support easily associating .puffin files with Puffin Viewer

Maybe even suggest such file association and set it up on startup of puffin viewer. So it is easy to share and open files in puffin viewer. Would require platform specifics to set up such a file association though.

Should also default to that as an the extension when saving reports.

Update puffin_egui to 0.25.0

Is your feature request related to a problem? Please describe.
Build errors when building with other plugins

Describe the solution you'd like
Update egui dependency to 0.25

Describe alternatives you've considered
A clear and concise description of any alternative solutions or features you've considered.

Additional context
Add any other context or screenshots about the feature request here.

thread 'main' panicked at 'assertion failed: min <= max'

I get an error after upgrading to the latest version 0.21:

thread 'main' panicked at 'assertion failed: min <= max', /rustc/39c6804b92aa202369e402525cee329556bc1db0\library\core\src\cmp.rs:843:9
stack backtrace:
   0: std::panicking::begin_panic_handler
             at /rustc/39c6804b92aa202369e402525cee329556bc1db0/library\std\src\panicking.rs:578
   1: core::panicking::panic_fmt
             at /rustc/39c6804b92aa202369e402525cee329556bc1db0/library\core\src\panicking.rs:67
   2: core::panicking::panic
             at /rustc/39c6804b92aa202369e402525cee329556bc1db0/library\core\src\panicking.rs:117
   3: puffin_imgui::ui::ProfilerUi::ui
   4: imgui::window::Window<Label>::build
   5: puffin_imgui::ui::ProfilerUi::window

Here are the relevant crate versions:

imgui = { version = "0.10", features = ["tables-api"] }
imgui-wgpu = "0.22"
imgui-winit-support = { version = "0.10"  }
puffin = "0.15"
puffin-imgui = "0.21"
wgpu = "0.15"
wgpu-types = "0.15"
winit = "0.27"

Let user choose compression algorithm

We currently use zstd to compress the profile stream. However, it compiles and runs very slow (see #130).

A great alternative would be lz4_flex, which both compiles and runs very fast. It is also pure Rust, so it works on Wasm.

I think it would be worth to refactor puffin to support multiple compression schemes/libraries (zstd and lz4_flex, initially). The compression scheme would need to be encoded in the data stream. The puffin_viewer binary would support all of them for maximal compatibility, but we would let users of puffin to opt-in to different compression libraries so the users can chose between fast compression and compilation, or high compression ratio.

Alternatively, if that is too much work, we can just switch out zstd for lz4 and have a big breaking change.

Compile error on "Either feature zstd or ruzstd must be enabled" even when not using packing feature

When building puffin without any features (the default), it will fail to compile due to this:

#[cfg(all(not(feature = "zstd"), not(feature = "ruzstd")))]
compile_error!("Either feature zstd or ruzstd must be enabled");

This is easy to reproduce:

$ cargo build --release -p puffin
   Compiling once_cell v1.9.0
   Compiling byteorder v1.4.3
   Compiling puffin v0.13.0 (C:\git\embark\puffin\puffin)
error: Either feature zstd or ruzstd must be enabled
   --> puffin\src\frame_data.rs:492:1
    |
492 | compile_error!("Either feature zstd or ruzstd must be enabled");
    | ^^^^^^^^^^^^^^^^^^^^^^^^^^^^^^^^^^^^^^^^^^^^^^^^^^^^^^^^^^^^^^^

Looks like this bug slipped in #51 and that we don't have any CI coverage for building with the default features?

Think the fix is as simple as only doing the compile error if the packing feature is also enabled, so adding to the cfg expression protecting it, and also adding CI coverage for building with default features / without the packing features for native and wasm as that is an important use case for us (esp. for wasm).

@VZout could you try and do a quick fix for this?

Profile arbitrary spans

I was wondering if there's a way to add arbitrary spans to puffin. It would be nice to just do the following:

let scope = puffin::profile_scope!("slow_code");

// ...

drop(scope);

While in a lot of scenarios function and scope profiling is sufficient, there are some performance intervals that aren't easily measured using that methodology. Say something starts in the middle of one function and ends in the middle of another for example.

Being able to insert events with arbitrary start/end times might work too, would just require timing things myself.

Sort threads by name

The threads are currently shown in chronological order, i.e. in what order the threads first report data. The motivation for that it will likely follow casual order (i.e. child threads will end up above their parents, and jobs on worker threads will end up above the threads that spawned them).

There should be an option to instead sort them lexicographically, e.g. using https://crates.io/crates/natord.

puffin_viewer (v0.19) `cargo install` fails building on windows

Describe the bug

cargo install puffin_viewer currently fails building on windows:

error[E0432]: unresolved import `winapi::um::winuser`
   --> C:\Users\Andreas\.cargo\registry\src\index.crates.io-6f17d22bba15001f\eframe-0.25.0\src\native\app_icon.rs:83:9
    |
83  |     use winapi::um::winuser;
    |         ^^^^^^^^^^^^^^^^^^^ no `winuser` in `um`
    |
note: found an item that was configured out
   --> C:\Users\Andreas\.cargo\registry\src\index.crates.io-6f17d22bba15001f\winapi-0.3.9\src\um\mod.rs:290:37
    |
290 | #[cfg(feature = "winuser")] pub mod winuser;
    |                                     ^^^^^^^
    = note: the item is gated behind the `winuser` feature

Device:

  • OS: Windows 11

Active toolchain:

stable-x86_64-pc-windows-msvc (default)
rustc 1.76.0 (07dca489a 2024-02-04)

Doesn't memory keep growing?

Describe the bug
#169

I get that it's PR for optimisation.
But doesn't this result in an infinite number of ScopeCollections and thus an ever-increasing memory footprint?
In fact, if you try running the current puffin_http example server, the memory keeps growing over time.

I'm just checking because after applying the release with this update, the memory exploded.

To Reproduce
cd puffin_http
cargo run --example server

Expected behavior
Memory should not continue to grow.

Allow sorting columns in the stats view

Is your feature request related to a problem? Please describe.

I would like to find the top-10 average times without scrolling.

Describe the solution you'd like

Being able to click the headers to sort by that column.

Describe alternatives you've considered
None. :P This seems like a fairly standard workflow.

Can't interact with the flamegraph since the egui 0.20 upgrade

Can click on anything in it, can't zoom, etc.

I think this is related to emilk/egui#2244

A quick test with:

--- a/puffin_egui/examples/eframe.rs
+++ b/puffin_egui/examples/eframe.rs
@@ -7,7 +7,13 @@ fn main() {
     eframe::run_native(
         "puffin egui eframe",
         native_options,
-        Box::new(|_cc| Box::new(ExampleApp::default())),
+        Box::new(|cc| {
+            let mut style = (*cc.egui_ctx.style()).clone();
+            style.debug.show_blocking_widget = true;
+            cc.egui_ctx.set_style(style);
+
+            Box::new(ExampleApp::default())
+        }),
     );
 }

Shows that there are two interactive regions overlapping each other. I'm investigating…

Remove support for imgui?

At Embark we have, quite a while back, moved fully over to egui and we are not too interested in maintaining the imgui version of the puffin viewer here, and there are no public users of it either (https://crates.io/crates/puffin-imgui/reverse_dependencies).

So think we can simply remove the code for it and focus only on the egui version from now on, older published versions of the crate will still ofc be available on crates.io.

Also note that we are on an old version of imgui (0.10, not 0.11)

Thoughts @TimonPost @emilk ?

Puffin scopes can no longer be used in crates with `#[forbid(unsafe_code)]`

After PR #165 (released in v0.18) it is no longer possible to use any puffin timers in crates that use #[forbid(unsafe_code)], know of no workarounds for it either as a forbid can't be allowed.

This is a full blocker for us (Embark) as we have plenty of crates that forbid unsafe usage. So unless we come up with a solution I think we'll have to back out this change, and probably do the simpler version that requires no unsafe or tracking with full string interning in the stream instead (#167) as discussed in the PR.

cc @emilk @TimonPost @MarijnS95

Repro

To test this in this repo do:

  1. Add #![forbid(unsafe_code)] in the top of puffin_egui/examples/eframe.rs
  2. Build the example cargo build --example eframe
  3. It fails to build:
error[E0453]: allow(unsafe_code) incompatible with previous forbid
  --> puffin_egui/examples/eframe.rs:60:17
   |
1  | #![forbid(unsafe_code)]
   |           ----------- `forbid` level set here
...
60 |                 puffin::profile_scope!("Spike");
   |                 ^^^^^^^^^^^^^^^^^^^^^^^^^^^^^^^ overruled by previous forbid
   |
   = note: this error originates in the macro `$crate::profile_scope` which comes from the expansion of the macro `puffin::profile_scope` (in Nightly builds, run with -Z macro-backtrace for more info)

Hierarchical mode for stats view

Is your feature request related to a problem? Please describe.

When optimizing, one of my favourite approaches is the parent% metric. This isn't too hard to compute, but right now the viewer doesn't present the data in an accessible way. What I want is a tree where the root nodes are the top level scopes, and each layer only has the statistics for the node when called from that parent.

Describe the solution you'd like

A view something like this:

scope                          self      parent%     total%
└── app-update                 13ms      100%        100%
    β”œβ”€β”€ input                  1ms       7%          7%
    β”‚   β”œβ”€β”€ keyboard           300us     30%         2.1%
    β”‚   └── mouse              100us     10%         0.7%
    β”œβ”€β”€ ai                     4ms       30%         30%
    β”‚   β”œβ”€β”€ raycasts           1ms       25%         7.5%
    β”‚   └── navigation         2.5ms     62.5%       20%
    └── player                 2ms       15%         15%
        └── weapon             0.5ms     25%         3.25%
            β”œβ”€β”€ raycasts       0.2ms     40%         1.3%
            └── hitmarker      0.2ms     40%         1.3%

I don't think the view necessarily has to present % - I think being able to correlate parent/child relationship of scopes is the important part.

Describe alternatives you've considered

This can be somewhat manually created by carefully finding the immediate children in the flamegraph, and then filtering the stats view. If there was a way to highlight or filter descendants that'd make it somewhat easier with the current tool. However, since some scopes might have multiple parents (e.g. raycasts above) it doesn't quite get there.

Additional context

This is an example of how it's presented in Firefox Performance view:
image

puffin_egui deadlock if new_frame is called from another thread

I'm running into a deadlock in puffin_egui if new_frame() is called from a thread other than the UI thread.
I built a sampling profiler that runs in a single thread, manually creates ThreadProfiler instances for all threads running in the process, and samples their stack traces at intervals, so I'm calling new_frame from that thread rather than my UI thread.

Here puffin takes the GlobalFrameView lock and holds it across the UI function call:

pub fn window(&mut self, ctx: &egui::Context) -> bool {
let mut frame_view = self.global_frame_view.lock();
self.profiler_ui
.window(ctx, &mut MaybeMutRef::MutRef(&mut frame_view))
}
/// Show the profiler.
///
/// Call this from within an [`egui::Window`], or use [`Self::window`] instead.
pub fn ui(&mut self, ui: &mut egui::Ui) {
let mut frame_view = self.global_frame_view.lock();
self.profiler_ui
.ui(ui, &mut MaybeMutRef::MutRef(&mut frame_view));
}

The profiler ui call itself contains profiling calls, which calls ThreadProfiler::end_scope internally, which tries to take the GlobalProfiler lock. So you have a nested GlobalFrameView lock -> GlobalProfiler lock acquisition in the UI.

GlobalProfiler::lock().new_frame() has the GlobalProfiler locked and calls the sink function here, which tries to lock the GlobalFrameView:

view_clone.lock().add_frame(frame);

This mismatched lock order triggers a deadlock.

GlobalProfiler::lock().new_frame() can be very expensive due to compression

Here's a small cutout from a Superluminal profile of an app that uses puffin scopes quite extensively:

image

The pack() call here takes around 1ms.

Looks like the pack() call from add_frame() gets very expensive. Partly because of zstd compression (can we turn down the compression level?) Also bincode serialization doesn't look cheap, maybe there's something faster we could switch to?

Ideally, it would be nice to run pack() on a separate thread, not sure how easy that would be but sure would help "main thread" performance.

Recommend Projects

  • React photo React

    A declarative, efficient, and flexible JavaScript library for building user interfaces.

  • Vue.js photo Vue.js

    πŸ–– Vue.js is a progressive, incrementally-adoptable JavaScript framework for building UI on the web.

  • Typescript photo Typescript

    TypeScript is a superset of JavaScript that compiles to clean JavaScript output.

  • TensorFlow photo TensorFlow

    An Open Source Machine Learning Framework for Everyone

  • Django photo Django

    The Web framework for perfectionists with deadlines.

  • D3 photo D3

    Bring data to life with SVG, Canvas and HTML. πŸ“ŠπŸ“ˆπŸŽ‰

Recommend Topics

  • javascript

    JavaScript (JS) is a lightweight interpreted programming language with first-class functions.

  • web

    Some thing interesting about web. New door for the world.

  • server

    A server is a program made to process requests and deliver data to clients.

  • Machine learning

    Machine learning is a way of modeling and interpreting data that allows a piece of software to respond intelligently.

  • Game

    Some thing interesting about game, make everyone happy.

Recommend Org

  • Facebook photo Facebook

    We are working to build community through open source technology. NB: members must have two-factor auth.

  • Microsoft photo Microsoft

    Open source projects and samples from Microsoft.

  • Google photo Google

    Google ❀️ Open Source for everyone.

  • D3 photo D3

    Data-Driven Documents codes.