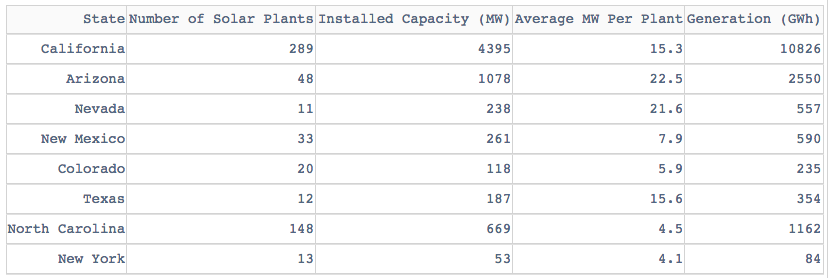
An interactive DataTable for Dash.
pip install dash-table
import dash
import dash_table
import pandas as pd

df = pd.read_csv('https://raw.githubusercontent.com/plotly/datasets/master/solar.csv')

app = dash.Dash(__name__)

app.layout = dash_table.DataTable(
    id='table',
    columns=[{"name": i, "id": i} for i in df.columns],
    data=df.to_dict("rows"),
)

if __name__ == '__main__':
app.run_server(debug=True)Dash DataTable is an interactive table component designed for viewing, editing, and exploring large datasets.
DataTable is rendered with standard, semantic HTML <table/> markup, which makes it accessible, responsive, and easy to style.
This component was written from scratch in React.js specifically for the Dash community. Its API was designed to be ergonomic and its behavior is completely customizable through its properties.
7 months in the making, this is the most complex Dash component that Plotly has written, all from the ground-up using React and TypeScript. DataTable was designed with a featureset that allows that Dash users to create complex, spreadsheet driven applications with no compromises. We're excited to continue to work with users and companies that invest in DataTable's future.
DataTable is in Alpha. This is more of a statement on the DataTable API rather than on its features. The table currently works beautifully and is already used in production at F500 companies. However, we expect to make a few more breaking changes to its API and behavior within the next couple of months. Once the community feels 💪 about its API, we'll lock it down and we'll commit to reducing the frequency of breaking changes. Please subscribe to dash-table#207 and the CHANGELOG.md to stay up-to-date with any breaking changes. Note: DataTable is currently supported in Chrome, Firefox, Safari, Edge (version 15+), and Internet Explorer 11.
So, check out DataTable and let us know what you think. Or even better, share your DataTable Dash apps on the community forum!
See CONTRIBUTING.md

