Git Product home page Git Product logo

disisto / grafana-dashboard-for-prometheus-tado-exporter Goto Github PK

View Code? Open in Web Editor NEW
5.0 1.0 0.0 1.2 MB

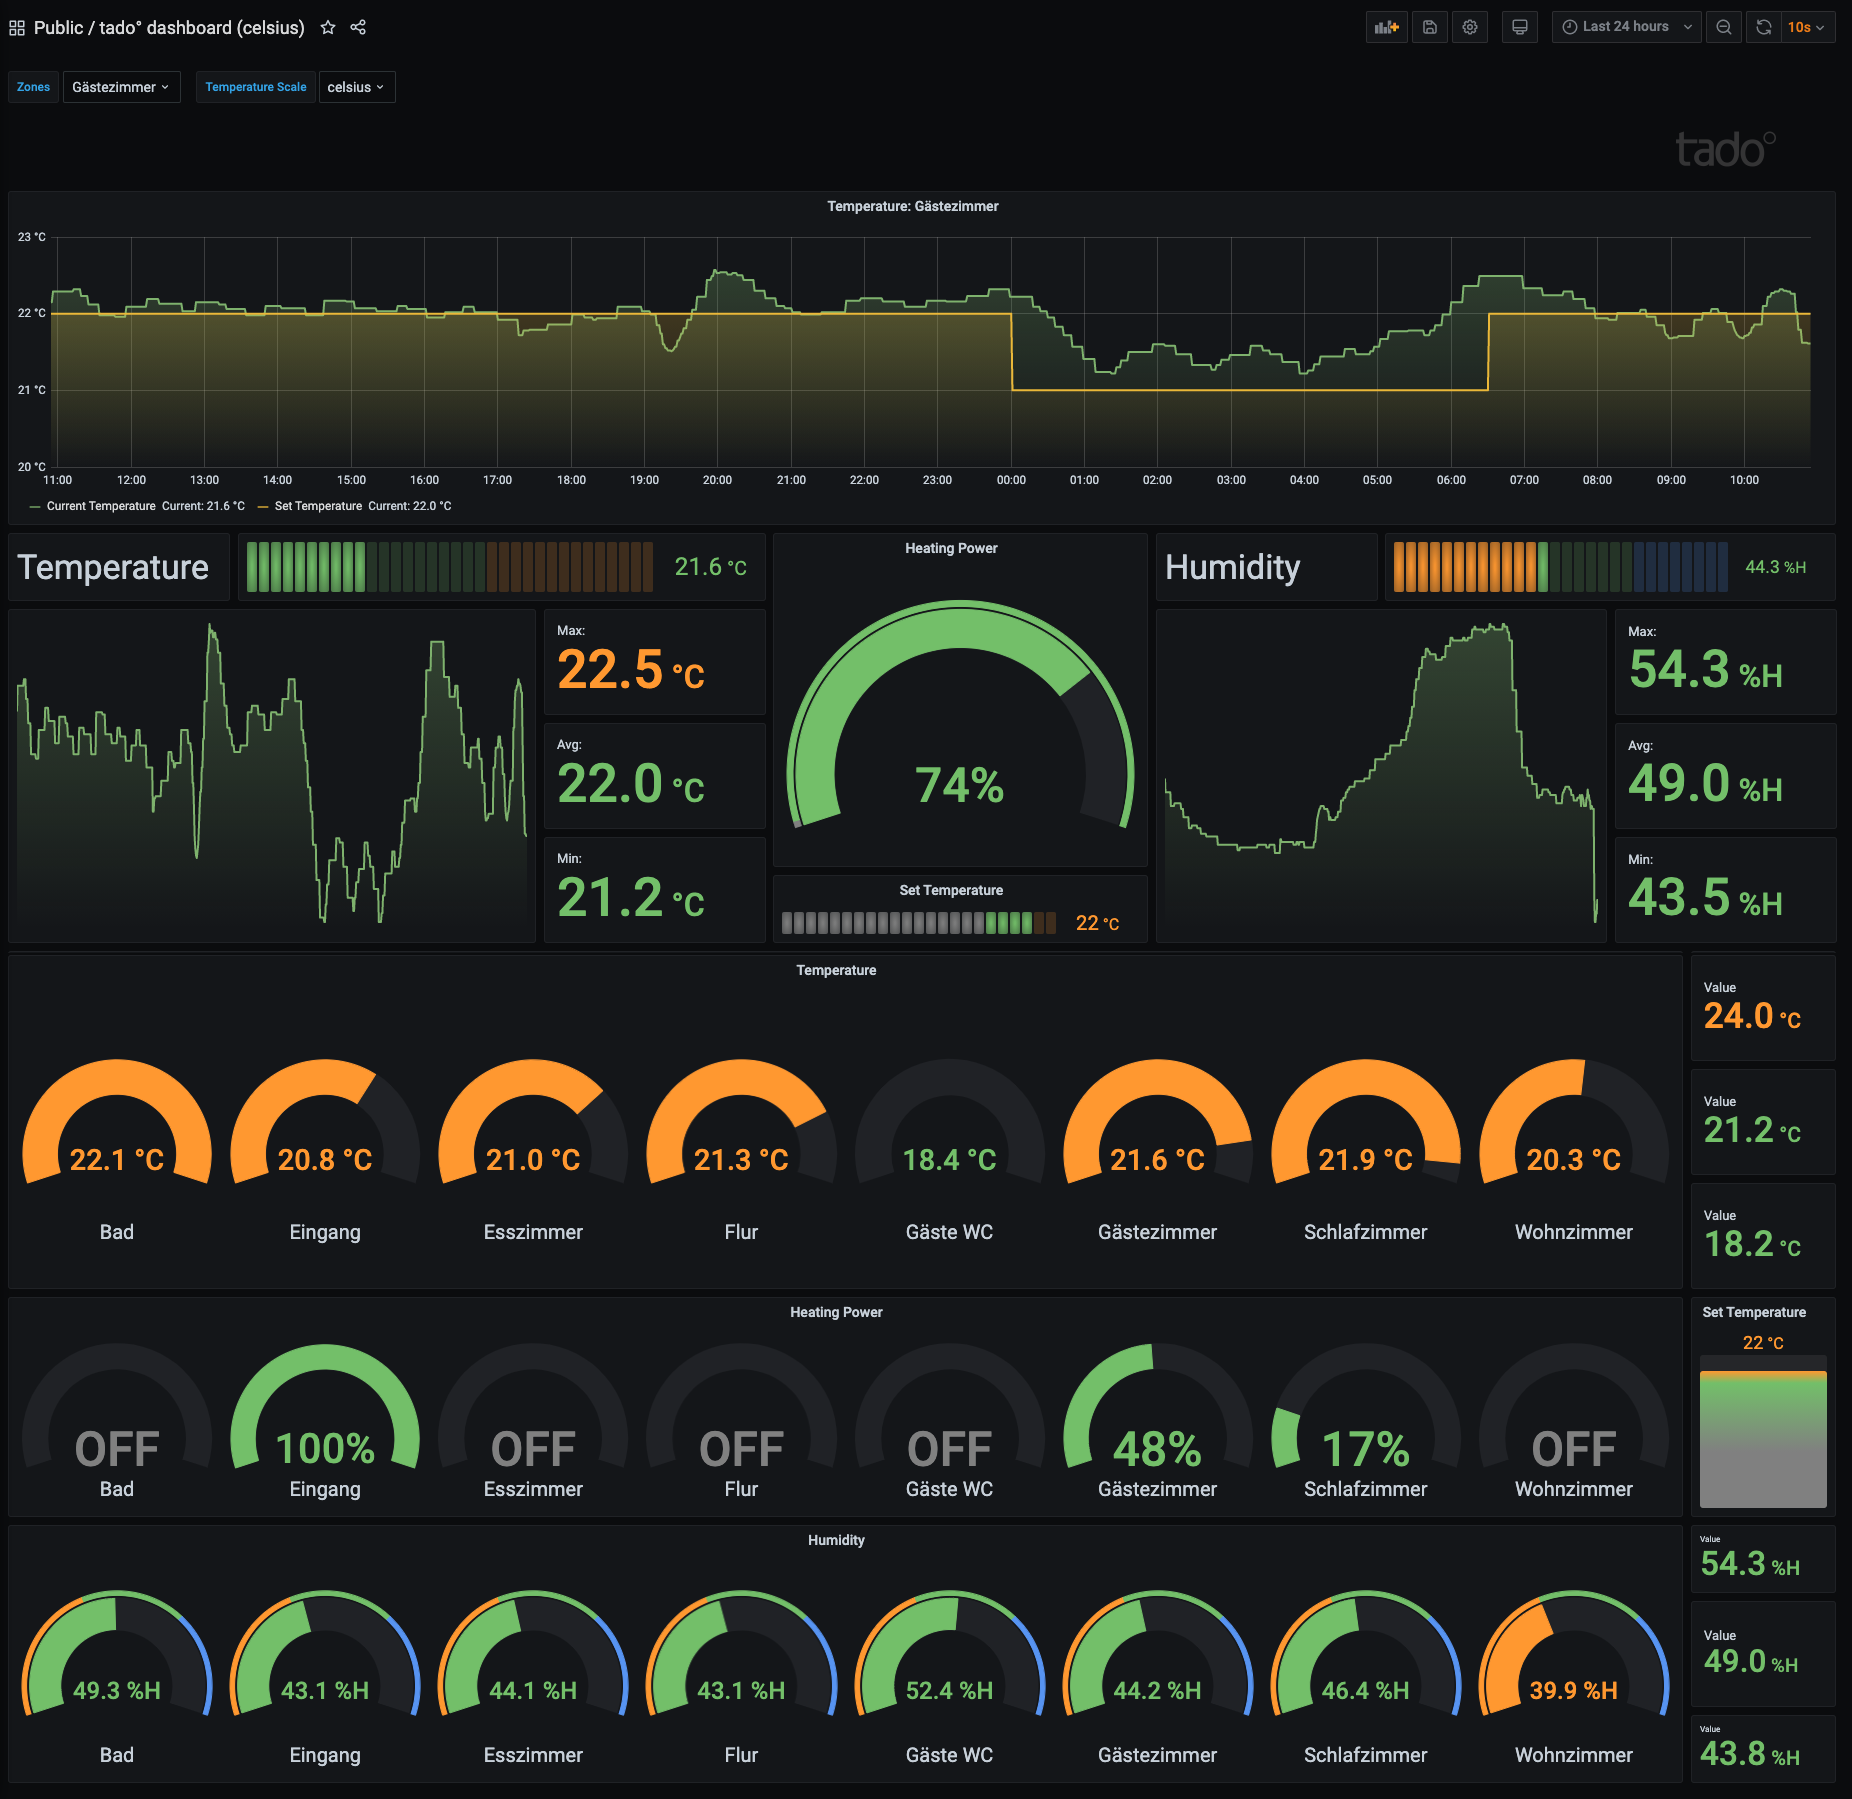
Grafana dashboard for Prometheus eko/tado-exporter that shows the temperature setting, current temperature, humidity and activity for all rooms equipped with tado° Smart Radiator Thermostat and/or Temperature Sensor.Grafana Dashboard for Prometheus tado-exporter

grafana grafana-dashboard prometheus prometheus-exporter tado

grafana-dashboard-for-prometheus-tado-exporter's Introduction

Grafana dashboard for Prometheus tado-exporter
Monitor your tado° Smart Radiator Thermostat and Temperature Sensor

Grafana dashboard for Prometheus eko/tado-exporter that shows the temperature setting, current temperature, humidity and activity for all rooms equipped with tado° Smart Radiator Thermostat and/or Temperature Sensor.

Prerequisites

Installation

Import

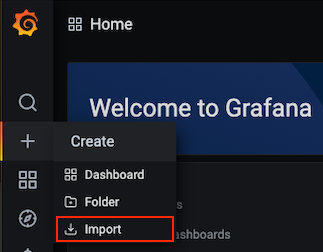
  1. To import a dashboard click the + icon in the side menu of Grafana, and then click Import.

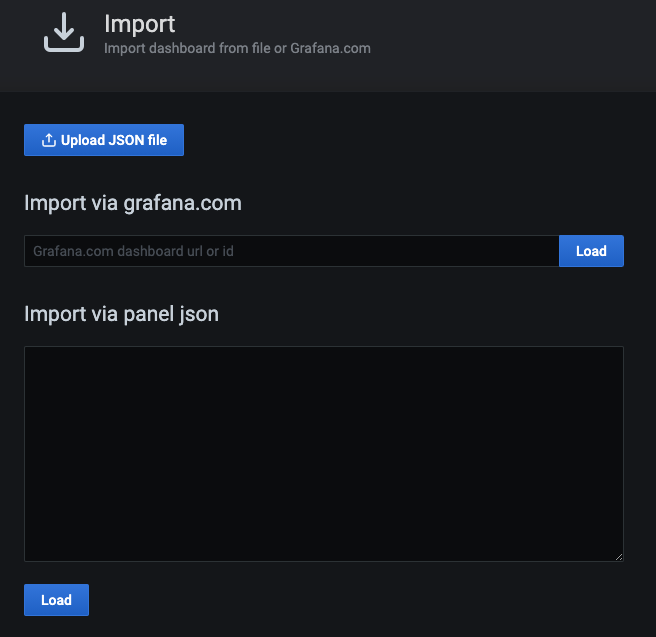
  1. From here you can upload the dahboard JSON file, paste a Grafana.com dashboard URL or ID or paste dashboard JSON text directly into the text area.

There are two identical dashboards that only differ in the display of the temperature scale. If the default temperature scale is changed, the unit symbol and the threshold are not automatically adjusted, which is why two independent dashboards were created for this scenario. Choose the dashboard with the desired default temperature scale for your needs.

Temperature scale ID URL JSON
Celsius 13699 https://grafana.com/grafana/dashboards/13699 Download JSON
Fahrenheit 13700 https://grafana.com/grafana/dashboards/13700 Download JSON

Optional customization

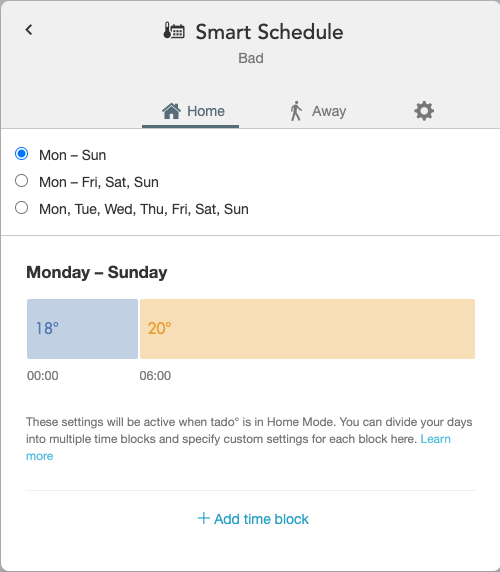
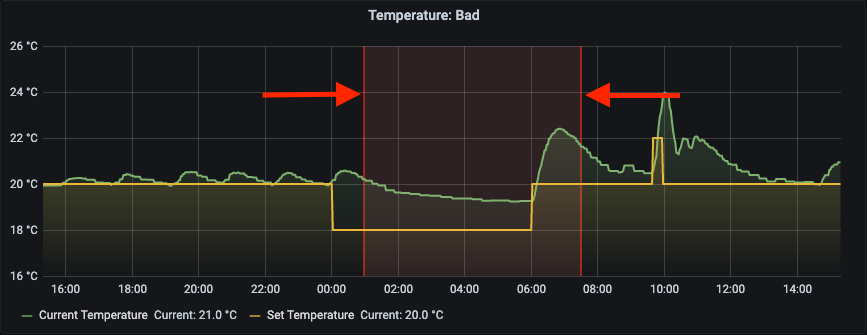
If you use the tado° Smart Schedule, you can display some delimiter in the temperature graph.

Smart Schedule in tado° app

Default: Grafana dashboard without tado° Smart Schedule
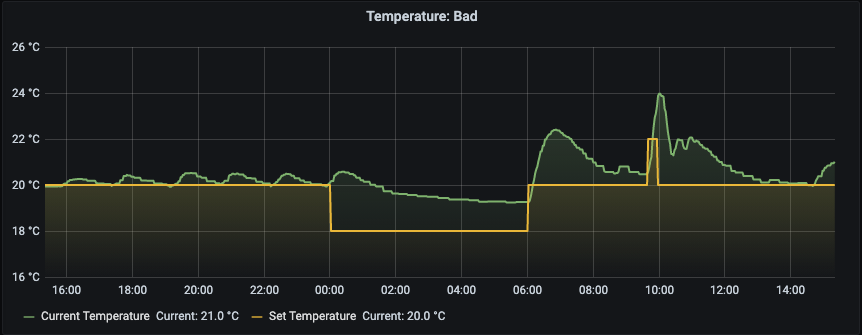
Customized: Grafana dashboard wit tado° Smart Schedule indication
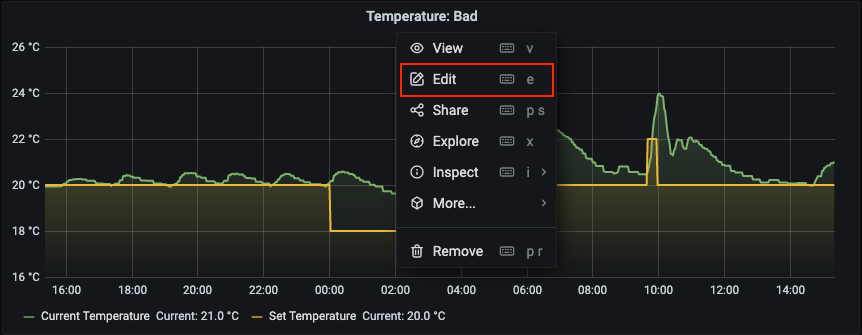
If you prefer to add the Smart Schedule delimiter, click on the settings dropdown on the temperature graph and choose 'Edit':
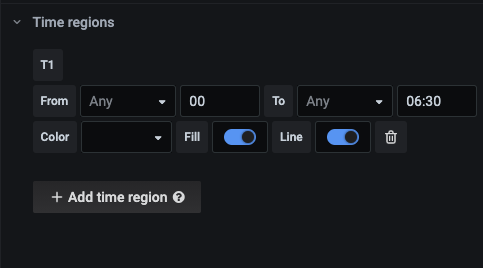
Scroll down to 'Time regions' and press on '+ Add Time region':

Add the time and date settings that matches with your tado° settings:

This project is not affiliated with tado°.
All mentioned trademarks are the property of their respective owners.

grafana-dashboard-for-prometheus-tado-exporter's People

Contributors

disisto avatar

Stargazers

 avatar  avatar  avatar  avatar  avatar

Watchers

 avatar

Recommend Projects

  • React photo React

    A declarative, efficient, and flexible JavaScript library for building user interfaces.

  • Vue.js photo Vue.js

    🖖 Vue.js is a progressive, incrementally-adoptable JavaScript framework for building UI on the web.

  • Typescript photo Typescript

    TypeScript is a superset of JavaScript that compiles to clean JavaScript output.

  • TensorFlow photo TensorFlow

    An Open Source Machine Learning Framework for Everyone

  • Django photo Django

    The Web framework for perfectionists with deadlines.

  • D3 photo D3

    Bring data to life with SVG, Canvas and HTML. 📊📈🎉

Recommend Topics

  • javascript

    JavaScript (JS) is a lightweight interpreted programming language with first-class functions.

  • web

    Some thing interesting about web. New door for the world.

  • server

    A server is a program made to process requests and deliver data to clients.

  • Machine learning

    Machine learning is a way of modeling and interpreting data that allows a piece of software to respond intelligently.

  • Game

    Some thing interesting about game, make everyone happy.

Recommend Org

  • Facebook photo Facebook

    We are working to build community through open source technology. NB: members must have two-factor auth.

  • Microsoft photo Microsoft

    Open source projects and samples from Microsoft.

  • Google photo Google

    Google ❤️ Open Source for everyone.

  • D3 photo D3

    Data-Driven Documents codes.