Git Product home page Git Product logo

sales-comparisons-by-region-using-tableau's Introduction

Sales-Comparisons-by-Region-using-Tableau

Description

The director of a hypothetical leading organization wants to compare the sales between two regions. He has asked each region operators to record the sales data to compare by region. The upper management wants to visualize the sales data using a dashboard to understand the performance between them and suggest the necessary improvements.

Objective

To create a dashboard to visualize the sales comparison between two selected regions.

Datasets

1. Primary Dataset โ€“ Sample Superstore

STEPS PERFORMED

1. Selected Sample Superstore as Dataset

2. Created a hierarchy called Location for the variable Country.

3. Created two parameters: Primary Region and Secondary Region with all regions listed in them. Here, primary and secondary region are the two regions where the sales are being compared.
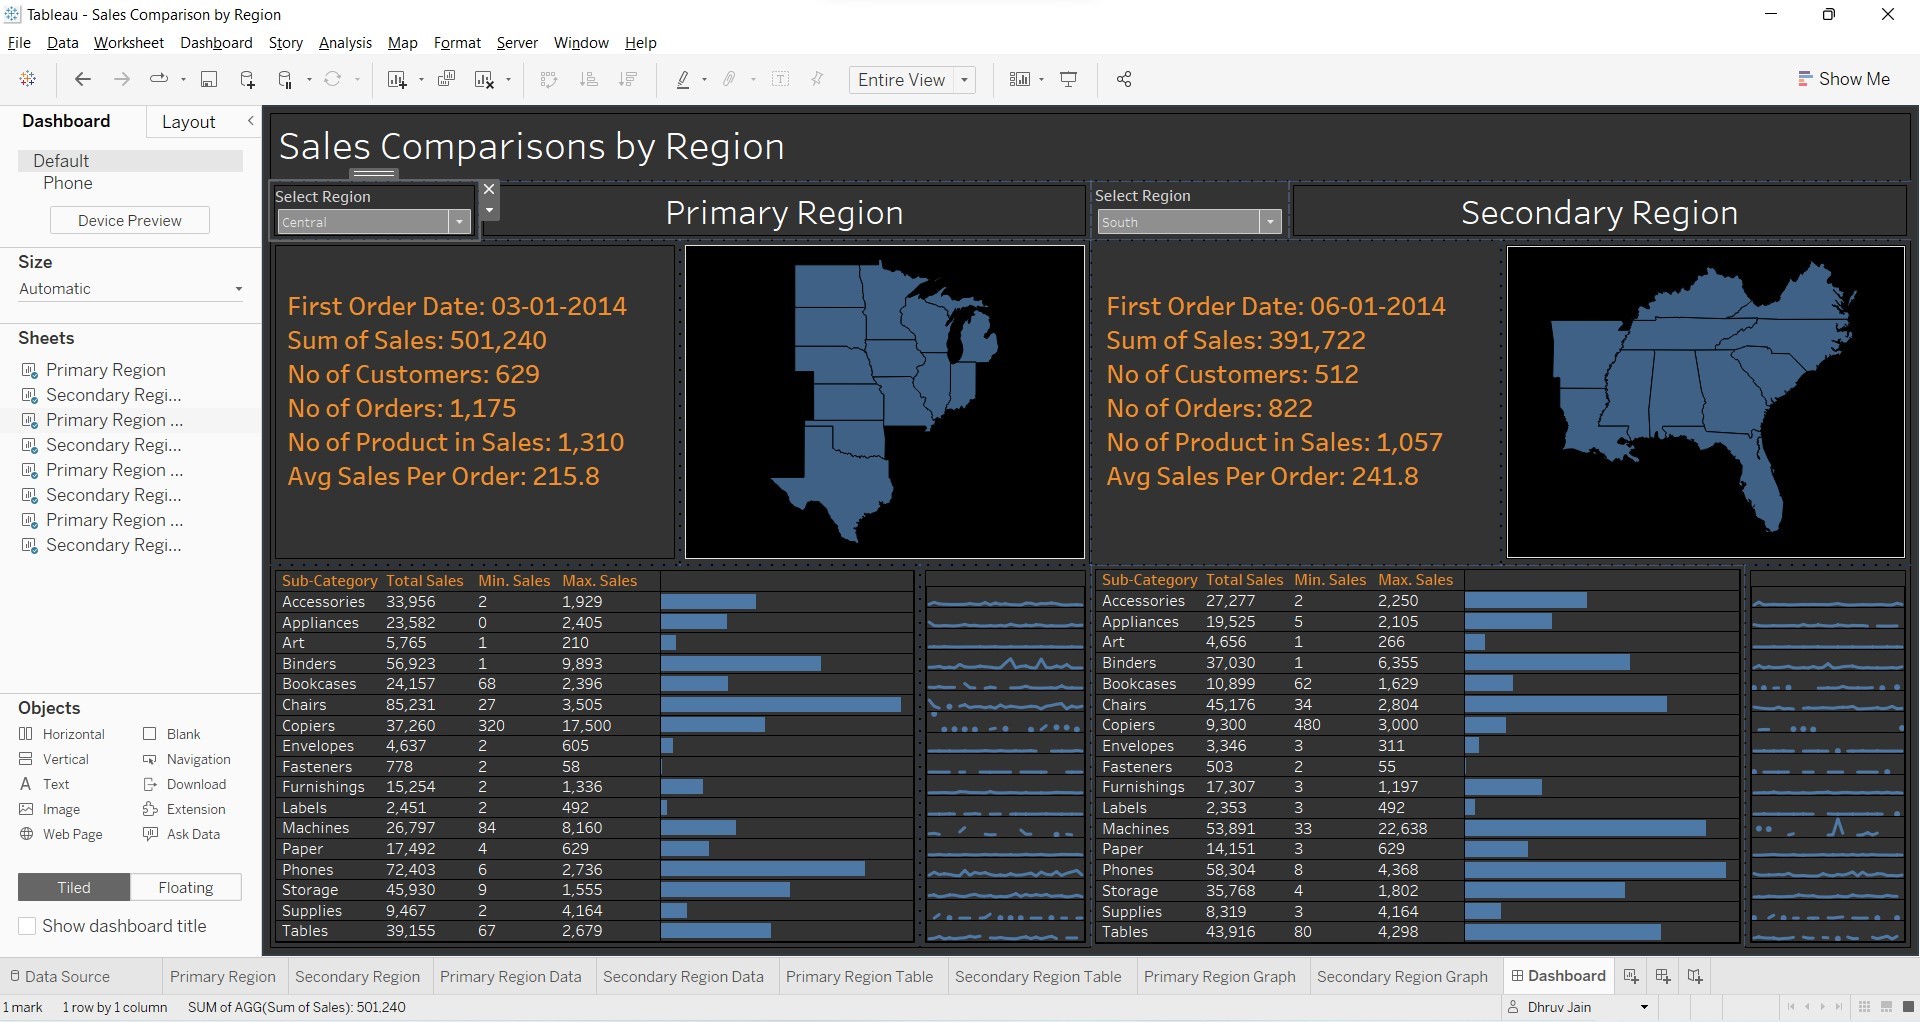
4. Created Parameters for Primary Region and Secondary Region

5. Created a Calculated Field for both Primary Region and Secondary Region

6. Created a Calculated Field and name it as the First Order Date

7. Aligned all sheets in the dashboard

8. Partitioned the dashboard to display the below details of Primary Region and Secondary Region

  - First Order Date
  - Total Sales
  - Average Sales per Order
  - No. of Customers
  - No. of Orders
  - No. of Products in Sale

Dashboard Image

The project can be accessed on the given link

sales-comparisons-by-region-using-tableau's People

Contributors

dhruvjain896 avatar

Watchers

 avatar

Recommend Projects

  • React photo React

    A declarative, efficient, and flexible JavaScript library for building user interfaces.

  • Vue.js photo Vue.js

    ๐Ÿ–– Vue.js is a progressive, incrementally-adoptable JavaScript framework for building UI on the web.

  • Typescript photo Typescript

    TypeScript is a superset of JavaScript that compiles to clean JavaScript output.

  • TensorFlow photo TensorFlow

    An Open Source Machine Learning Framework for Everyone

  • Django photo Django

    The Web framework for perfectionists with deadlines.

  • D3 photo D3

    Bring data to life with SVG, Canvas and HTML. ๐Ÿ“Š๐Ÿ“ˆ๐ŸŽ‰

Recommend Topics

  • javascript

    JavaScript (JS) is a lightweight interpreted programming language with first-class functions.

  • web

    Some thing interesting about web. New door for the world.

  • server

    A server is a program made to process requests and deliver data to clients.

  • Machine learning

    Machine learning is a way of modeling and interpreting data that allows a piece of software to respond intelligently.

  • Game

    Some thing interesting about game, make everyone happy.

Recommend Org

  • Facebook photo Facebook

    We are working to build community through open source technology. NB: members must have two-factor auth.

  • Microsoft photo Microsoft

    Open source projects and samples from Microsoft.

  • Google photo Google

    Google โค๏ธ Open Source for everyone.

  • D3 photo D3

    Data-Driven Documents codes.