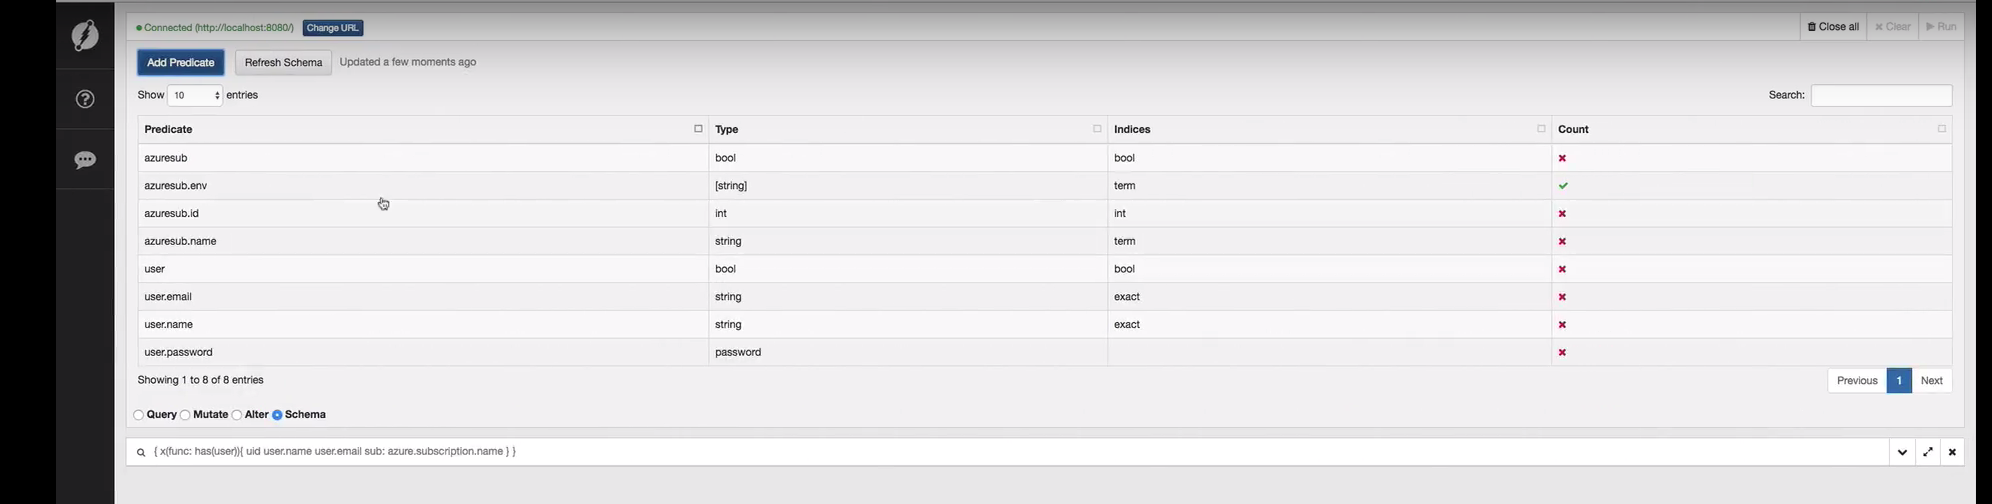
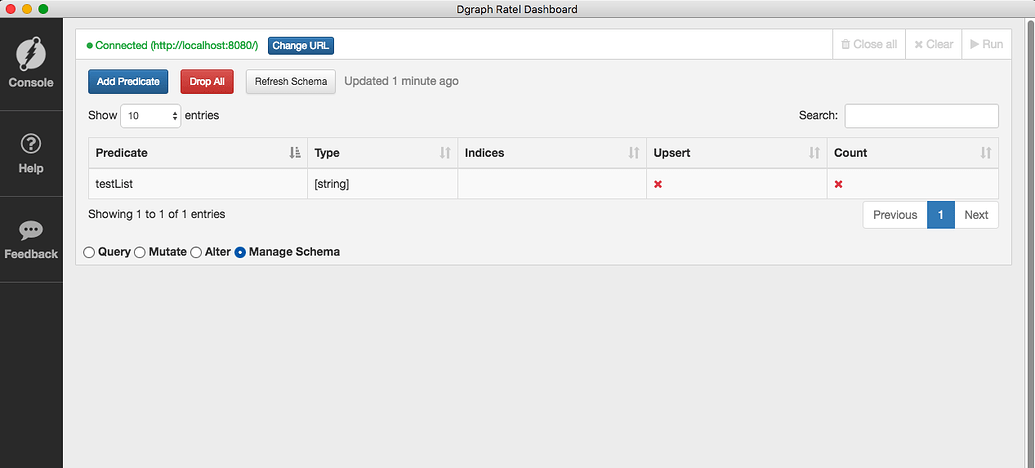
Git Product home page Git Product logo

ratel's Introduction

Ratel

Dgraph Dashboard

Building and running

See Instructions.

License

Apache 2.0. See LICENSE.

Post-mortem

PS. Update this text if(when) necessary.

We used to run Ratel along with the main Dgraph binary(Core Code). But it has been removed and some code here has become obsolete. Like the ones in the "Server" directory, some processes in Bash Script and so on. Now we have created a unique image for Ratel. See https://hub.docker.com/r/dgraph/ratel

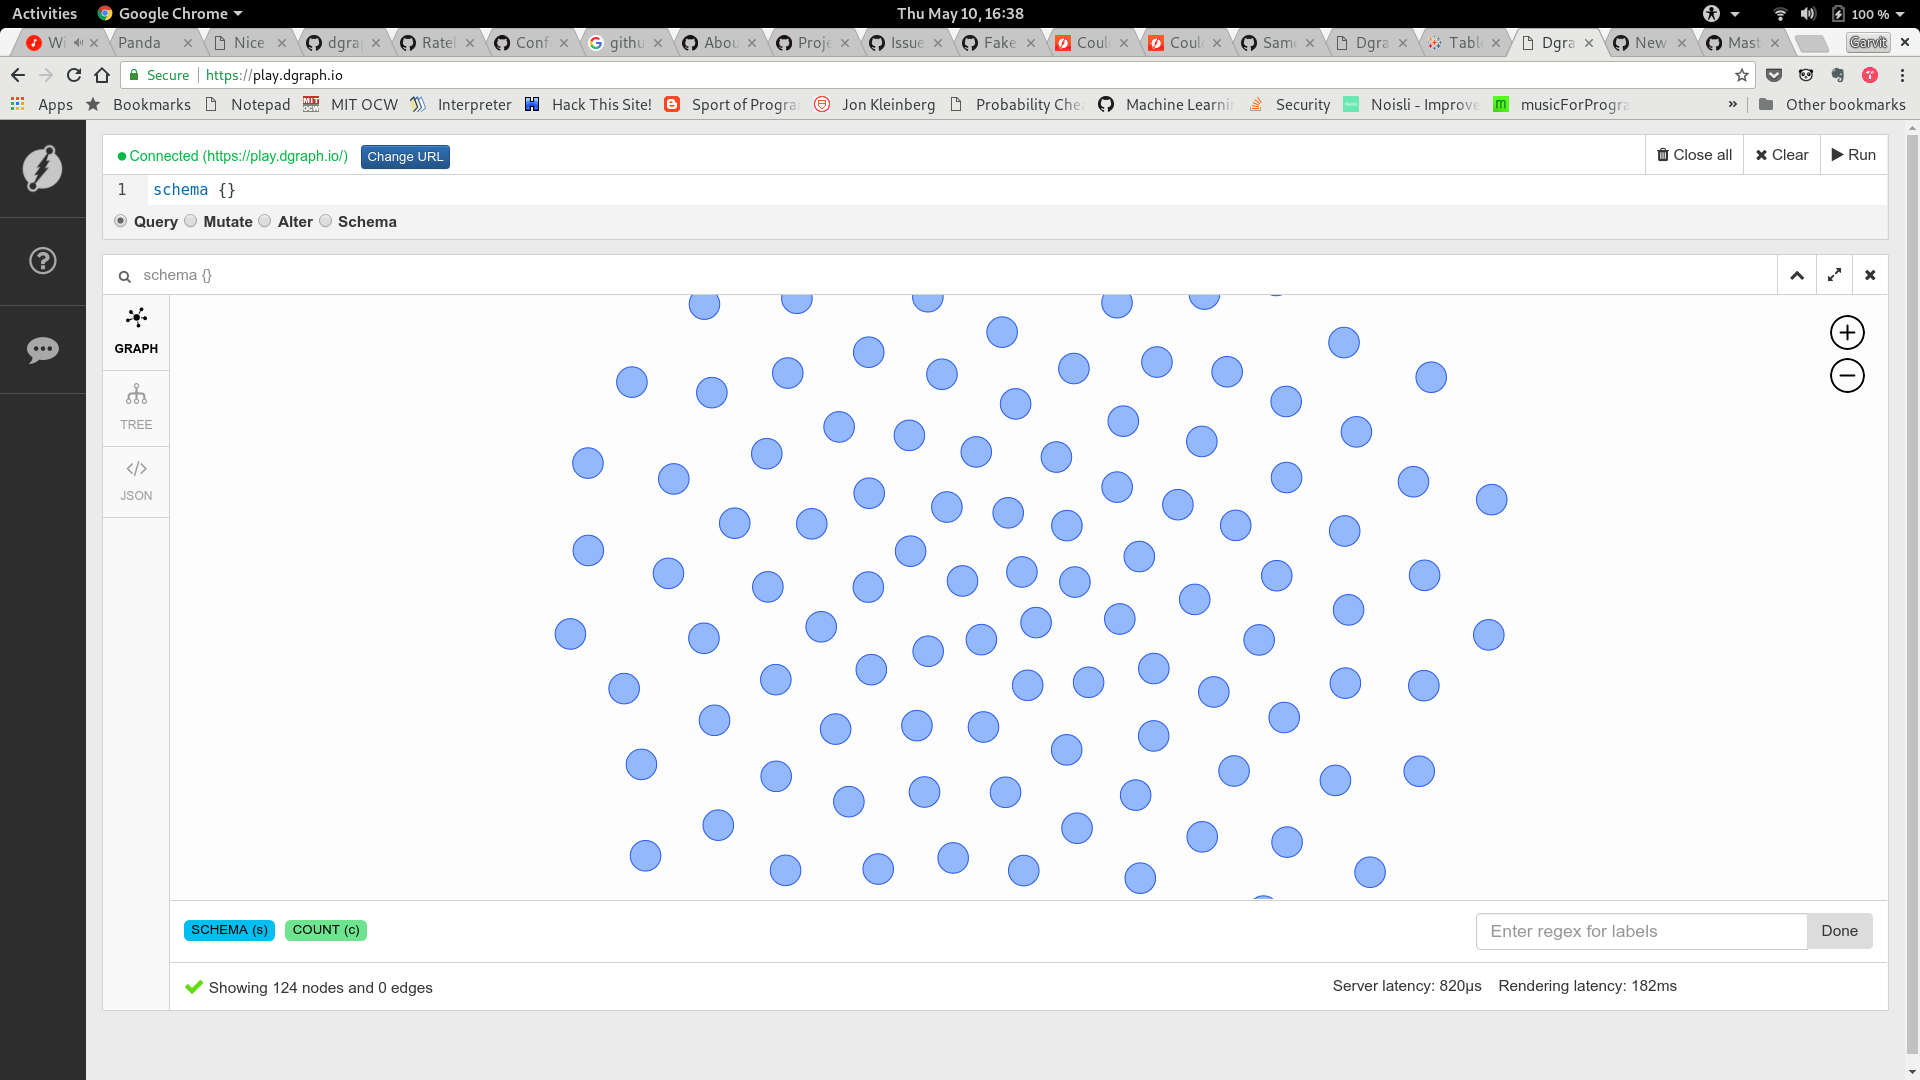
The UI available at http://play.dgraph.io/ is kept in an S3 Bucket and distributed via CDN. Communication between the UI, documentation and parts of the Tour uses a shared dataset. Its configuration is done through the config file in ./server/play-dgraph-io.nginx.conf.

ratel's People

Contributors

aelbannan avatar ajeetdsouza avatar akon-dey avatar antblood avatar danielmai avatar darkn3rd avatar dependabot[bot] avatar elliotmassen avatar emhagman avatar fenos avatar gja avatar gpahal avatar jarifibrahim avatar manishrjain avatar martinmr avatar maxi-moto avatar mbj36 avatar micheldiz avatar minhaj-shakeel avatar ny0m avatar paulftw avatar prashant-shahi avatar rderbier avatar ro0tk1t avatar ryanfoxtyler avatar sleto-it avatar tstreamdoth avatar

Stargazers

 avatar  avatar  avatar  avatar  avatar  avatar  avatar  avatar  avatar  avatar  avatar  avatar  avatar  avatar  avatar  avatar  avatar  avatar  avatar  avatar  avatar  avatar  avatar  avatar  avatar  avatar  avatar  avatar  avatar  avatar  avatar  avatar  avatar  avatar  avatar  avatar  avatar  avatar  avatar  avatar  avatar  avatar  avatar  avatar  avatar  avatar  avatar  avatar  avatar  avatar  avatar  avatar  avatar  avatar  avatar  avatar  avatar  avatar  avatar  avatar  avatar  avatar  avatar  avatar  avatar  avatar  avatar  avatar  avatar  avatar  avatar  avatar  avatar  avatar  avatar  avatar  avatar  avatar  avatar  avatar  avatar  avatar  avatar  avatar  avatar  avatar  avatar  avatar  avatar  avatar  avatar  avatar  avatar  avatar  avatar  avatar  avatar  avatar  avatar  avatar

Watchers

 avatar  avatar  avatar  avatar  avatar  avatar  avatar  avatar  avatar  avatar  avatar  avatar  avatar  avatar  avatar  avatar  avatar  avatar  avatar  avatar  avatar  avatar  avatar  avatar  avatar  avatar  avatar  avatar  avatar  avatar  avatar

ratel's Issues

Investigate “guessing” node classes from data

Most nodes in the same class will have same lists of known predicates. By correlating predicates and identifying strongly connected parts of a predicate list we could in theory identify implied node classes.

Investigate faster graph libraries

vis.js is not handling large graphs well and hasn't been updated for 12+ months.
According to this comparison:
https://www.youtube.com/watch?v=Ax7KSQZ0_hk

VivaGraphJS, d3, and visjs are fairly responsive. VivaGraphJS doesn't get updated too often can end up abandoned.

d3 is super popular and is one of the fastest, so probably a good first alternative to investigate

DGraph UI enhancement ideas

A couple suggestions for the DGraph UI to make it more useable:

  1. The ability to set JSON as the default viewing option. For example if you select JSON perhaps all further queries can remain on JSON, if you toggle back to Graph then all further queries (or eventually expanded queries) display the same mode.
  2. Ability to select the entire response body. We find ourselves copy and pasting between that screen very often. So a click to select all or click to select and copy to clipboard would be wonderful
  3. Having the query re-iterated on the left side of the expanded query window seems a bit useless. Suggestions: allow the left panel to be your query editor panel and your response on the right side or put the graph on the left and JSON on the right. Would be great to select the layout you'd prefer.
  4. Saving queries or pinning them would be helpful.
  5. Place the bottom results bar listing the nodes and label legend above the query/response panel so it's easier to find instead of having to scroll to it as a quick reference. Matter of fact perhaps the left hand panel could be your legend (vertically stacked) and the right hand can be your response window.
  6. If you have more than 5 queries perhaps they can be hidden under a "More" option. As you run query after query the stack becomes quite large and slows down the browser.
  7. Move close all to the left hand navigation bar so it's accessible anymore in the UI.

That's all I've got for now =)

Roadmap 2018

Work in progress:

  • Schema management (query, check/validate and update)

Ability to "collapse" expanded nodes from UI through dgraph-ratel

Experience Report

Note: Feature requests are judged based on user experience and modeled on Go Experience Reports. These reports should focus on the problems: they should not focus on and need not propose solutions.

What you wanted to do

In dgraph-ratel the "expand" button is extremely helpful. I generally start off with a simple query and expand from there. One issue I have is that when I perform a query (especially recursive queries) the fanout can be quite large. I'd like to have a "remove" button that lets me click a node and remove it, and subsequently removes all nodes that are no longer reachable from a forward edge (that were previously reachable).

Essentially, given a graph with:
A, B, D, C

A->B
A->C
B->C
B->D

If I click "remove" on "B" it will also remove "D" as it is no longer reachable.

What you actually did

Right now I don't have a good solution to this. Huge fanout can really bog my browser down and I end up having to create smaller queries and manually expand out with the "expand" button.

Why that wasn't great, with examples

I model process trees in dgraph. Fanout is generally small, but once in a while a process will have massive fanout (like a background process). I'd like to be able to selectively prune out those processes without having to make overly complex queries.

Any external references to support your case

Refactoring Backlog

Implement proper Redux in FrameItem

Currently GraphContainer is a container, FrameItem is not.
However, FrameItem is doing query execution and processing, storing it all in internal state (not redux).

Apart from violating 'pure redux' conventions this introduces several problems:

  • child components depend on parent to do logic for them
  • changing behaviour is not obvious: FrameItem has to be updated to add any new feature
  • it's hard to find where certain logic is - it's not always in reducers and fetch results are not in store

Overall this problem slows down development

Cluster state screen

Users should be able to see their zeros, alphas, connection stats, leaders, etc in ratel

Dgraph-ratel crashes with a blank screen when click on an edge a Facet

When I am trying to click on edge that has a facet, the UI v1.0.10 crashes and turns to a white screen. I have attached a screen shot of the brower and the error printed by the console is below. Any help on solving this issue will be highly appreciated ?

TypeError: "i is undefined"
r https://d1ocqy7wcgv7nr.cloudfront.net/static/js/main.js:1:1267573
r https://d1ocqy7wcgv7nr.cloudfront.net/static/js/main.js:1:1267519
Rn https://d1ocqy7wcgv7nr.cloudfront.net/static/js/main.js:1:644941
n https://d1ocqy7wcgv7nr.cloudfront.net/static/js/main.js:1:658757
Zn https://d1ocqy7wcgv7nr.cloudfront.net/static/js/main.js:1:659138
yr https://d1ocqy7wcgv7nr.cloudfront.net/static/js/main.js:1:665662
mr https://d1ocqy7wcgv7nr.cloudfront.net/static/js/main.js:1:665042
dr https://d1ocqy7wcgv7nr.cloudfront.net/static/js/main.js:1:664071
or https://d1ocqy7wcgv7nr.cloudfront.net/static/js/main.js:1:663130
enqueueSetState https://d1ocqy7wcgv7nr.cloudfront.net/static/js/main.js:1:693462
setState https://d1ocqy7wcgv7nr.cloudfront.net/static/js/main.js:1:598934
handleNodeSelected https://d1ocqy7wcgv7nr.cloudfront.net/static/js/main.js:1:1221780
configNetwork https://d1ocqy7wcgv7nr.cloudfront.net/static/js/main.js:1:1264397
r https://d1ocqy7wcgv7nr.cloudfront.net/static/js/main.js:1:708791

screen shot 2018-12-27 at 10 32 36 am

dgraph-ratel wait time not long enough

Copied from dgraph-io/dgraph#2408

"Whenever I run a slightly time-consuming query, the dgraph-ratel fails to render the result due to timeout.
Other clients could wait for as long as it needs for the result to arrive.
Can you give an option to set wait timeout in dgraph-ratel UI?"

Allow modifying predicate schema via UI

We should allow users to set the data type, and indices on the predicates via the UI. Also, they should be able to delete the predicate and start fresh.

In addition, we can also show them some stats about the predicate on demand, i.e. number of edges, size of indices etc. We'd need to build an endpoint to get this information.

Use Ratel with server that has TLS client auth "REQUIREANDVERIFY"

Does anyone know how I can add my "client" certificate on Chrome for example when using the Ratel web interface. If I only use SSL (not client auth required) for the Dgraph servers, I can accept a untrusted source in Chrome but if I require a valid client cert / key, I am not sure how I can make queries through Chrome.

Version: dgraph:dev (nightly?)
Memory: 64GB
OS: Docker on Ubuntu 16.04

Support “expanding” a node on click

When Data Explorer is displaying sample data and a user selects one of the sample nodes that node should “expand” showing all its outbound predicates

Mutation running twice

When we make a mutation. In the Console panel and then we go to "Schema or Explore" or another.
And then we go back to the Console. Ratel performs a new mutation. Duplicating the data.

Ratel has visual issues on 1.0.6 release - Some features added in last commits are missing

  • Sidebar menu has icons missing
  • Drop all btn is missing
  • Some bootstrap changes are missing
  • Ordering (sorting) arrows are missing

Check if the process is using NPM, this project has a NPM lock that Yarn can't deal out.

PrintScreen from Chrome - Tested on Edge, Firefox and Opera too.

image

update

Ratel has been downgraded I believe

I saw a comment from Manish speaking that he remade some things by modifying the binaries of Dgraph 1.0.6. So I decided to test again. Resolved several things, only features are missing and only a few imperceptible icons are missing.

History / Current Frame UI no longer makes sense

Query history has been moved to the left, below the main editor.

It is no longer clear:

  • which frame is shown in the right panel,
  • what happens when history item is clicked,
  • is editor text related to the view on the right or not.

Proposed fixes:

  • add color highlight in the history to indicate selected frame
  • add notification when selected frame's code has been changed
  • add a button to re-run current frame
  • add a button to update the editor with selected frame code
  • (hard) add animations when a frame is executed / selected / created

Hopefully this will be enough

Exit full screen button doesn't work.

To reproduce:

  1. Run a query
  2. Click full screen
  3. In the upper right corner click full screen button

Expected behavior: full screen gets closed
Current behavior: delete frame btn disappears, full screen gets replaced with shrink. Clicking shrink finally closes the full screen mode.

DGraph Graph visualization is not displayed when too many node types

  1. See in the image that there are too many tags; i think the height of the view area is limited which is restricting the view of the graph
  2. can we have the graph visualization to the right of the Json (like we had in prev version). With the current way of display, we endup in scrolling too much

image

Using https://play.dgraph.io/ some predicates doesn't shows Sample data or Stats and had UI breaks

I have not tested all predicates, but many have given this problem.

It happens with:

art_director.films_art_directed
casting_director.films_casting_directed
collections
company_role_or_service.companies_performing_this_role_or_service
content_rating.country
content_rating.rating_system
content_rating_system.jurisdiction
content_rating_system.ratings
costume_design_by
costumer_designer.costume_design_for_film
crewmember.films_crewed
director.film
distribution_medium.films_distributed_in_this_medium
distributors
dubbing_performances
editor.film
estimated_budget
executive_produced_by
featured_locations
featured_song
festival.individual_festivals
festival_sponsor.festivals_sponsored
festivals
filming
format
format.format
gross_revenue
all => http://www.w3.org/2000/01/
locations
music_contributor.film
other_crew

Taking too long to complete:

festival_focus.festivals_with_this_focus 
format.format
name
performance.actor

Breaks the UI:
loc

Center of the graph zoom must be mouse position

d3-zoom is probably doing the right thing but we apply extra transformations to canvas in D3Graph/index.js.
d3-zoom doesn't know about that.
Correct fix is to initialize zoom behavior with a starting transformation.

Schema editing issues

If I do not set a Type before sending a mutation. The Schema panel displays most of them as "default". However in the property field "int" appears. That is, the main panel does not reflect the properties panel. And possibly it's defining all Types as "int".

And when I try to index something that is actually "int" it returns the error:
Could not alter predicate: Indexing not allowed on predicate price of type default

Tested with:

Dgraph version   : v1.0.10-rc1
Commit SHA-1     : eff4ccfb
Commit timestamp : 2018-10-22 17:28:07 -0700
Branch           : HEAD

Look into structr

I was curious if there is any thought to building something like structr (https://structr.com/) for dgraph? It’s a web based UI that provides a very easy way to build complex entity models, set permissions, and expose the model as a REST based API. It makes creating large scale apps much easier.

Add more information about Schema and Filters.

Before Ratel had information in the Frame Footer. It would be interesting to have a total of predicates and use pagination perhaps. Filters would also be interesting to return.

Update 2020: I gonna reformulate this.

By 2018 Schema's editor had few features, but they were extremely useful for large lists of predicates. For example. There was a search. Which filtered the predicates by name. And there was also pagination.

Pagination is great for giant schemas. For example, 21million RDF has over 250 predicates. Scrolling to locate a specific predicate is a bad experience.

There was also a box that we chose how many entries would be shown. 10, 20, 30 and etc.

At the bottom of the predicate, the list was information about how many entries were being displayed and which page we were on.

There were "previous" and "next" buttons.

It would be interesting to have a Filter by predicate type, an advanced search so to speak. For example, I want to see only [uid] type predicates that begin with B. Or 'See only predicates that are not part of some Type so I can fix it'. That way you can have better control of Schema.

Here is a pic of it

Captura de Tela 2020-01-13 às 22 21 53

image

Move schema out of EditorPanel

Needed for data explorer and general changes of the console view.
Currently schema is a sub component of EditorPanel making both too complicated to work with

Data Explorer

Data explorer tab shows predicates and allows exploring associated data

Add JSON config file for Ratel

Please add a --config=/path/file.json option to ratel for more consistancy. Consider renaming -addr to something more descriptive eg. --host. Mind the --, please.

Btw. is telemetry missing in --help option or no more valid?

Elaborate a way to calculate and present (show) Sizes on Ratel. | used space

image

I was talking to Karandeep Singh in Slack, and I noticed there's this demand. He even talked to others and saw other people too.

Hence I remembered that tools like phpmyadmin have (as an example of an HTML viewer) a field that displays the size of the entire DB and tables. It would be interesting to have a set of space usage statistics. And each predicate also have its evaluation of space usage separate.

PS. Also taking into consideration Shards (if possible)

I know this would be technically complex to put in Ratel, but it's interesting.

Recommend Projects

  • React photo React

    A declarative, efficient, and flexible JavaScript library for building user interfaces.

  • Vue.js photo Vue.js

    🖖 Vue.js is a progressive, incrementally-adoptable JavaScript framework for building UI on the web.

  • Typescript photo Typescript

    TypeScript is a superset of JavaScript that compiles to clean JavaScript output.

  • TensorFlow photo TensorFlow

    An Open Source Machine Learning Framework for Everyone

  • Django photo Django

    The Web framework for perfectionists with deadlines.

  • D3 photo D3

    Bring data to life with SVG, Canvas and HTML. 📊📈🎉

Recommend Topics

  • javascript

    JavaScript (JS) is a lightweight interpreted programming language with first-class functions.

  • web

    Some thing interesting about web. New door for the world.

  • server

    A server is a program made to process requests and deliver data to clients.

  • Machine learning

    Machine learning is a way of modeling and interpreting data that allows a piece of software to respond intelligently.

  • Game

    Some thing interesting about game, make everyone happy.

Recommend Org

  • Facebook photo Facebook

    We are working to build community through open source technology. NB: members must have two-factor auth.

  • Microsoft photo Microsoft

    Open source projects and samples from Microsoft.

  • Google photo Google

    Google ❤️ Open Source for everyone.

  • D3 photo D3

    Data-Driven Documents codes.