
- Jan 2019 - Beta availability of Debrief with Scripting.
- May 2015 - Switch to new Color Map for tracks and symbols.
- Mar 2015 - Release of Natural Earth

- Nov 2014 - UI Makeover, switch to [DPF] (http://www.debrief.info/tutorial/index.html#debrief_file_format.html) file suffix, printed form of cheat sheets
- Nov 2014 - Introduce automated Track Jump Removal, plus Dynamic Infill Segments
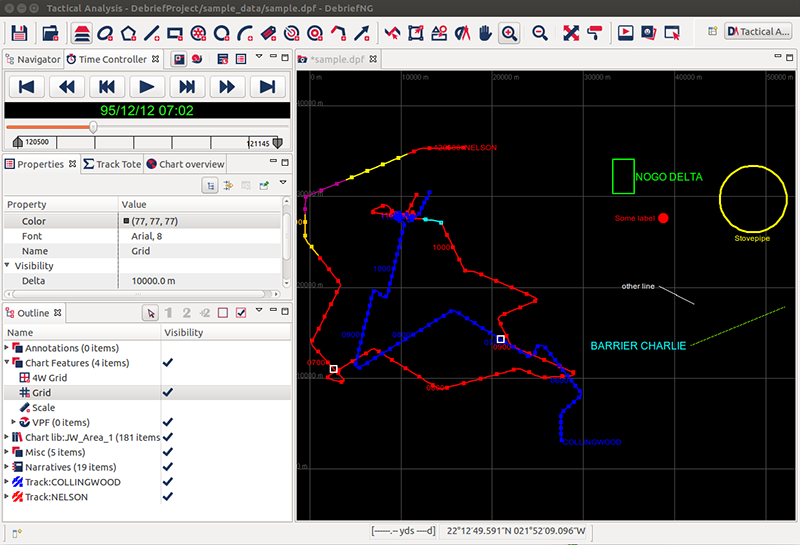
- Sep 2014 - Formally replace Layer Manager with standard Eclipse Outline View
- Apr 2014 - Integrate Semi Automated Track Construction (TMA)
- Dec 2013 - Intregration of time-synced audio, video, stills players (beta)
- Oct 2013 - Rotated labels on legs
- Aug 2013 - Support for auto-calculated range/brg labels
- Jul 2013 - Dragging mouse from BR to TL performs zoom-out, instead of zoom-in
- Jun 2013 - Debrief can now calculate course/speed for a track if the data isn't produced by the recording device.
- Jun 2013 - Added support for reading Polygon shape from REP file
- Sept 2012 - Support irregular arcs in Range Ring Highlighter
- Sept 2012 - Allow REP position line to include text label at end
- Aug 2012 - Introduce new, easier method of Polygon editing
- May 2012 - Introduce ability to plot XY graphs of planning tracks
- Apr 2012 - Introduce capability to use Debrief for exercise planning
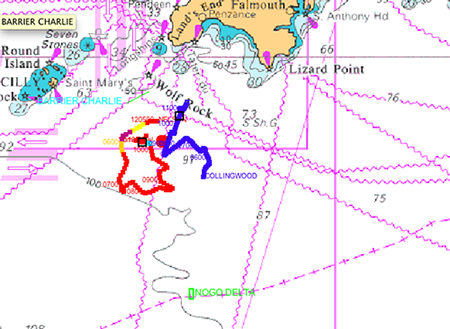
- Apr 2012 - Debrief can now display a Navigation Chart Backdrop
- Mar 2012 - Add attribute to Track object, to display a direction of travel arrow.
- Aug 2011 - Introduce Wizard for creation of new Narrative entries
The development of Debrief has been supported by Oxygen XML

The development of Debrief has also been supported by the YourKit Java Profiler


