![]()


Dask is a flexible parallel computing library for analytics. See documentation for more information.
New BSD. See License File.
JupyterLab extension for Dask
License: BSD 3-Clause "New" or "Revised" License
![]()
Dask is a flexible parallel computing library for analytics. See documentation for more information.
New BSD. See License File.


![dependabot[bot] avatar](https://avatars.githubusercontent.com/in/29110?v=4 "dependabot[bot]")


Hello,
I'm having troubles to get my dashboard setup on a SageMaker notebook instance.
Tests I've done:
- Checked serverextension list:
(JupyterSystemEnv) sh-4.2$ jupyter serverextension list
config dir: /home/ec2-user/.jupyter
    jupyterlab_git  enabled
    - Validating...
Error loading server extension jupyterlab_git
      X is jupyterlab_git importable?
config dir: /home/ec2-user/anaconda3/etc/jupyter
    dask_labextension  enabled
    - Validating...
      dask_labextension 1.0.3 OK
    ipyparallel.nbextension  enabled
    - Validating...
      ipyparallel.nbextension  OK
    jupyter_server_proxy  enabled
    - Validating...
      jupyter_server_proxy  OK
    jupyterlab  enabled
    - Validating...
      jupyterlab 0.32.1 OK
    nbdime  enabled
    - Validating...
      nbdime 1.1.0 OK
    nb_conda  enabled
    - Validating...
      nb_conda 2.2.1 OK

Nothing much happens doing that.
The pop up error "Failed to list clusters: might the server extension not be installed/enabled?"
show up when disabling/enabling the lab extension.
Tried:
#61 (comment)
Any ideas?
As a follow-up on #18 and #31, it would be nice if the "search button" and the cluster management section on the side panel could work across multiple (conda) environments.
Those features work very well when I'm using a single environment where everything (jupyterlab, dask, extensions, etc.) is installed.
However, my (possibly a common?) configuration consists of running jupyterlab from within its own dedicated, lightweight conda environment and using nb_conda_kernels to run kernels installed in other environments (one per project). In this case the search button is unresponsive and the cluster management section in the side panel only manages clusters in the jupyterlab environment. I could still manually copy dashboard addresses in the text field, though (and I'm happy doing this!)
Unfortunately, I have no idea on how much effort this would require to implement.
Hello,
My name is Clément Buton, I am a Post-doc working at IPNL on the Euclid European space telescope.
I am currently trying to use dask-labextension with a SLURM cluster on my laboratory grid infrastructure. So far, I have no problem using dask-labextension together with the local cluster configuration or opening a SLURM cluster client "by hand":
from dask.distributed import Client
from dask_jobqueue import SLURMCluster
cluster = SLURMCluster(cores=16,
                                          project="euclid_nisp",
                                          local_directory='$TMPDIR',
                                          walltime='01:00:00',
                                          memory="50GB",
                                          queue="normal")
cluster.scale(10)
client = Client(cluster, processes=False)
client
My problem starts when I try to configure the dask-labextension (labextension.yaml) with the SLURMCluster as follows:
labextension:
  factory:
    module: 'dask_jobqueue'
    class: 'SLURMCluster'
    args: []
    kwargs: {'cores': 16,
             'processes': 1,
             'memory': '50GB',
             'queue': 'normal',
             'walltime': '02:00:00',
             'local_directory': '$TMPDIR'}
  default:
    workers: null
    adapt: null
      # minimum: 0
      # maximum: 10
  initial: []
I get the following error message when I try to create a new cluster (i.e. click on the +new button): "cannot get address of non-running Server" (cf a copy of my screen jupyterlab-dask-slurm.pdf) which seems to be related to dask.distributed.
I add bellow the versions of the libraries and extensions I am currently using:
(py37) ✘-1 ~/dask-slurm
11:09 $ jupyter serverextension list
config dir: /home/euclid/cbuton/.miniconda/envs/py37/etc/jupyter
    dask_labextension  enabled
    - Validating...
      dask_labextension 0.4.0a1 OK
    jupyter_server_proxy  enabled
    - Validating...
      jupyter_server_proxy  OK
    jupyterlab  enabled
    - Validating...
      jupyterlab 1.0.1 OK
    jupyterlab_slurm  enabled
    - Validating...
      jupyterlab_slurm 0.1.1 OK
    nbserverproxy  enabled
    - Validating...
      nbserverproxy  OK

(py37) ✔ ~/dask-slurm
11:10 $ conda list
jupyterlab 1.0.1
jupyterlab-server 1.0.0
dask 2.0.0
dask-core 2.0.0
dask-jobqueue 0.5.0
dask-labextension 0.4.0a1
Any help would be deeply appreciated.
Thanks in advance, and thanks again on the really nice work you guys are doing,
Sincerely,
Clément
The orange buttons in the sidebar are currently hardcoded. It would be great to have them be defined when we talk to the scheduler. This would allow us to add new plots in Dask without having to update this package, and to have plots that are only defined in some situations (such as if a GPU is present)

Currently we query /individual-plots.json to see if the dashboard is up and running.
    // If this is a url that we are proxying under the notebook server,
    // it is easier to check for a valid dashboard.
    if (url.indexOf(settings.baseUrl) === 0) {
      return ServerConnection.makeRequest(
        URLExt.join(url, 'individual-plots.json'),
        {},
        settings
      ).then(response => {
        if (response.status === 200) {
          return true;
        } else {
          return false;
        }
      });
    }
I think that originally the plan was to check this to see what plots were available. Is this still possible? I'm adding a new plot here (dask/distributed#2922) and suspect adding some more that might only be present sometimes.
Currently we hard-code these plots here:
dask-labextension/src/dashboard.tsx
Lines 417 to 426 in b68342b
But we might get them from the individual-plots route
$ curl localhost:8787/individual-plots.json
{
  "Individual Task Stream": "/individual-task-stream",
  "Individual Progress": "/individual-progress",
  "Individual Graph": "/individual-graph",
  "Individual Profile": "/individual-profile",
  "Individual Profile Server": "/individual-profile-server",
  "Individual Nbytes": "/individual-nbytes",
  "Individual Cpu": "/individual-cpu",
  "Individual Nprocessing": "/individual-nprocessing",
  "Individual Workers": "/individual-workers"
}
The greedy/auto cluster client is a little too black-magic for my tastes but I think what would be very cool is if you could drag a cluster into a notebook and have it create a new code cell:
import dask
from dask.distributed import Client

client = Client('tcp://address:port')The instructions installation provided in the README.md fails:
JupyterLab >= 0.35 distributed >= 1.24.1
This extension includes both a client-side JupyterLab extension and a server-side Jupyter notebook extension. Install these using the command line with
jupyter labextension install dask-labextension
jupyter serverextension install dask_labextension
$ jupyter serverextension install dask_labextension
Please supply at least one subcommand: disable, enable, listWould be great to have the git tags for 0.3.2 and 0.3.3 published to GitHub (if possible).
If I engage the "Auto start Dask" option then my notebook gets the client state in it automatically. However, if I then restart my notebook I seem to lose that state.
Short term: I would like to see a new release of the client-side of dask-labextension. There is functionality in master that I personally find valuable.
Long term: How should we handle releases generally. I personally don't know much about publishing JS packages. Is it ok to continue to rely on @ian-r-rose or @jacobtomlinson ? Is it easy to automate this process?
Following discussion in #36 and especially comment #36 (comment).
First time I used dask-labextension was from a Pangeo binder, or maybe dask-examples binder. From there, nothing to do, windows (Task Stream and Progress) already opened, and they connect automatically when a LocalCluster is started, nice!
So I tried to deploy the extension on a Jupyterlab running on CNES HPC cluster in notebooks using dask-jobqueue. In order to make it work, I have to:
Is this the intended behavior? I'm specifically thinking of the second point, I guess that declaring a default layout of view in JLab must be somehow feasible, and it is not related to this extension.
For the first point, I can see a New button from the extension left panel, but it does nothing. Must it be configured somewhere? Readme says:
Options for how to launch these clusters are set via the dask configuration system.
Maybe the docs should be a little more precise about this.
Anyway this is a great extension when using Dask, and on going work could make it still better, so thanks!
I recently had to rebuild my lab conda environment and the dask-labextension buttons (though not all) seem to be unresponsive.
# Name                    Version                   Build  Channel
jupyterlab                0.35.5           py37hf63ae98_0
jupyterlab_server         0.2.0                    py37_0
I heard from @mrocklin that there may be tornado issues and I tested with both tornado 5 and 6
Hi,
I use latest jupyter lab (0.4.1) with Python 3.5 on Windows.
I installed this extension as in readme instructions, but when I launch jupyter lab, I get blank screen.
Console shows this:
Uncaught (in promise) Error: No provider for: jupyter.services.commandpalette.(…)
    Application.resolveService @ main.bundle.js:276
    (anonymous function) @ main.bundle.js:238
    Application.activatePlugin @ main.bundle.js:238
    (anonymous function) @ main.bundle.js:324
    Application.start @ main.bundle.js:324
    (anonymous function) @ lab:57
When I breakpoint main.bundle.js:276, I see token = Token {_name: "jupyter.services.commandpalette"} while id is undefined.
If I uninstall this extension everything is back to normal, and jupyter lab works as expected.
Would be good to rename the PyPI (and other packages) to use - instead of _ in the name. This is follow up on issue ( conda-forge/dask_labextension-feedstock#1 ).
It would be useful to be able to start and stop clusters from within the sidebar rather than within a notebook. This would allow clusters to persist between notebooks and between notebook sessions.
So, how do we start, stop, scale, and adapt clusters within the sidebar? Presumably this requires ...
@ian-r-rose is this something that you have time to help with? I'm quite happy to help out with this, but I suspect that would benefit from having you (or someone with your experience) lead.
I'm interested in a workflow where users never have to create a Dask client, it just gets created for them silently in the background based on the current active Cluster in the server extension. So an order of operations might look like the following:
As a result, the user always uses the cluster specified in the labextension. They have to explicitly choose not to use this if they want to use the local scheduler or a client of their own making.
This behavior would be off by default, but we could turn it on for things like tutorials, pangeo, and so on.
Is this useful, or is it too magical?
Dear all,
I was able to follow (and modify) this gide to set up Pangeo on the HPC system of my university (which uses LSF). I was able to deploy it and run it but not to use/connect the dask dashboard. I've installed dask_labextension but the buttons remain grey.
Any thoughts?
Thank you!
jupyter serverextension list says that everything is OK/enabled
So, for tutorials or science setups with JupyterHub I'd like to be able to provide users with a pre-defined layout of panes and dashboard link on startup. These seem to be saved locally on my machine somehow. Is there a way to set these up and then persist a file somewhere with the information inside a docker container?
I have the dask-labextension only partially working with a JupyterLab / TheLittlestJupyterHub environment. It appears to be a problem with how the proxies are configured. An url like this works correctly:
https://cosima.munroelab.ca/user/jm0634/proxy/46793/status
but using
https://cosima.munroelab.ca/user/jm0634/dask/dashboard/9c845b0c-a6a2-4bd9-a12c-20228ae6040d/status
leaves the bokeh app connecting but none of the graphs appearing. Any suggestions on how to debug this issue? Thanks.
If a client is started up within a notebook without specifying the tcp address, e.g.:
from dask.distributed import Client

client = Client(n_workers=8, threads_per_worker=8)
is there any way to connect the extension to it? I don't see the client showing up in the left side extension window, and I don't know how to search for it.
Relatedly, what is the search bar for? I'm not clear what I'm supposed to be searching for there, or if it's related to my question.
It would be nice to have the possibility to change directly from dashboard the number of cores and not only the number of workers and also the type of cluster like LocalCluster vs LocalCUDACluster
This could very well be a user error but i am having trouble naively installing dask-labextension:
jlab-1.0) bzaitlen@dgx15:~/GitRepos/jupyterlab-nvdashboard$ pip install dask_labextension
(jlab-1.0) bzaitlen@dgx15:~/GitRepos/jupyterlab-nvdashboard$ jupyter labextension install dask-labextension
An error occured.
KeyError: '@jupyterlab/apputils'
Useful dependencies
(jlab-1.0) bzaitlen@dgx15:~/GitRepos/jupyterlab-nvdashboard$ conda list jupyter
# packages in environment at /home/nfs/bzaitlen/miniconda3/envs/jlab-1.0:
#
# Name                    Version                   Build  Channel
jupyter-server-proxy      1.1.0                      py_0    conda-forge
jupyter_client            5.3.1                      py_0    conda-forge
jupyter_core              4.4.0                      py_0    conda-forge
jupyterlab                1.0.8                    py37_0    conda-forge
jupyterlab_server         1.0.6                      py_0    conda-forge
I'm not sure how hard it would be to allow Dask Yarn clusters. I tried it, and it fails because there is no asynchronous keyword in YarnCluster.__init__. I'm not sure if launching the cluster asynchronously would be necessary for this functionality.
There is currently some churn going on in the interfaces for a generic distributed cluster info dict (cf. #78, #77 #73).
At the same time, this extension takes that information, and converts it to a ClusterModel dictionary, a JSON-serializable representation of the cluster information to display on the front end. This conversion happens here:
dask-labextension/dask_labextension/manager.py
Lines 240 to 290 in b68342b
And it produces a dictionary with the typescript interface here:
dask-labextension/src/clusters.tsx
Lines 776 to 820 in b68342b
Once the churn on the upstream side dies down, we should update the IClusterModel interface to be as close as possible to the generic cluster info dictionary, to which should help cut down on further confusion and maintenance.
n.b. This would be a breaking change, as both the client-side and the server-side would have to be updated with the new interface.
I installed this extension, but not with a distributed==0.17.5. All the buttons were greyed out when I tried to use it. Updating to distributed==0.19.2` resolved this and allowed me to use this extensions.
@sccolbert noticed a flicker when resizing plots

"It's like the canvas is being resized (which clears it white automatically), but the plot is not being redrawn until the next animation frame
so you get one frame of white before seeing the new plot"
Also
setTimeout(function () {
    // wait until bokehjs is loaded and the plot is rendered and added to the index
    // there's almost definitely a more elegant way to do this
    that._plot_ref = Bokeh.index[that._bokeh_id].model;
}, 1000);
this sometimes generates an error because Bokeh.index[that._bokeh_id] is still undefined
I'm trying to use this extension on the cloud without luck. How can I activate it?
Hi there,
I've been trying to use dask labextension's jupyter widgets to monitor Dask processing tasks and etc, but not from a LocalCluster, as it comes configured by Default, but from a Kubernetes Cluster, created by it's default Helm Chart.
I have a JupyterHub environment setted up with this Dask Scheduler+Worker in a Kubernetes Cluster (of my own) which I use to spread workers over as I need.
But it seems that the visualizations provided by this extension only allows me to monitor LocalClusters, when I try to connect to my Kubernetes Cluster using:
from dask.distributed import Client

client = Client("tcp://dask-scheduler:8786")
client
I'm then able to use normally the Dask workers spread over the Kubernetes Cluster, but the widgets inside Jupyter lab won't show any data about those workers.
is it possible to configure the extension widgets to monitor other cluster rather then the LocalCluster?
tks for any help
It would be great to have a conda-forge package for dask-labextension if possible.
Would be nice to have a few screenshots in the Readme that show what this does.
Standard naming scheme would be jupyterlab-dask?
We are currently trying to run dask, jobqueue and labextension on our cluster as a test. We could start a cluster by hand and also with the jobqueue file.
We cannot start SLURM Cluster with the dask-labextension. It is probably simular issue with this one #68 or it is just a miss configuration.
We could start the cluster by hand without troubles. When we use the dask-labextension we got the following error:
Cluster Start Error
'LocalCluster' object has no attribute 'scheduler'
It looks like he's trying to start a local cluster, but we've adjusted all labextensions.yaml files we could find.
~/.config/dask/
we copied also to /etc/dask
and also in the /usr/local/lib/python3.6/dist-packages/dask_labextension folder.
Does someone have an idea what I'm doing wrong?
labextension:
labextension:
  factory:
    module: 'dask_jobqueue'
    class: 'SLURMCluster'
    args: []
    kwargs: {'cores': 1,
             'processes': 1,
             'memory': '40GB',
             'interface' : 'ib0',
             'queue': 'gpu',
             'walltime': '0:30:00',
             'project': 'gpu'}
  default:
    workers: null
    adapt:
      null
      # minimum: 0
      # maximum: 10
  initial:
    []
    # - name: "My Big Cluster"
    #   workers: 100
    # - name: "Adaptive Cluster"
    #   adapt:
    #     minimum: 0
    #     maximum: 50
pip list :
dask (2.2.0+12.gb5722b36)
dask-jobqueue (0.6.2)
dask-labextension (1.0.3)
jupyter serverextension list:
config dir: /usr/etc/jupyter
    dask_labextension  enabled
    - Validating...
      dask_labextension 1.0.3 OK
config dir: /usr/local/etc/jupyter
    dask_labextension  enabled
    - Validating...
      dask_labextension 1.0.3 OK
    ipyparallel.nbextension  enabled
    - Validating...
      ipyparallel.nbextension  OK
    jupyter_server_proxy  enabled
    - Validating...
      jupyter_server_proxy  OK
    jupyterlab  enabled
    - Validating...
      jupyterlab 1.0.4 OK
I hoped that the #34 #31 should accomplish something allowing me to use this extension in a way that allowed me to write a scheduler URL that is only accessible from the jupyter server but not from the browser client.
For example, in a terminal in the jupyter server made available through a JupyterHub, I can wget to http://dask-scheduler.dask:8787, but from the browser, I cant access that URL. It is only available in the local network of the Jupyter server.
Was this supposed to work after #31 #34, or were those PRs not meant to accomplish this as I hoped they were with a lack for a proper understanding.

If only the lab extension is installed with
jupyter labextensions install dask-labextension
Then the error popup 'Failed to list clusters: might the server extension not be installed/enabled?'
It is not entirely clear to a new user how to remedy issue. The solution (as is in the docs) is to install the python package dask_labextension
pip install dask_labextension
For me, there was confusion between installing a python package, installing the labextension, the difference between dask-labextension and dask_labextension, and why jupyter labextension install <..> is a thing but jupyter serverextension install <...> is not a thing (and needs to be installed as python package.
Could the error message be changed to be clearer on what exactly needs to be installed? (the python package dask_labextension rather than just saying the server extension is not available?) Also, then running jupyter labextension list it reports back dask-labextension v1.0.1 enabled OK even if the require server extension is not installed.
If you've got Lab behind Hub, and a Lab page loaded, and the user Lab behind it goes away, the dask dashboard poller keeps polling at high frequency, but just gets redirected (by the hub) to the Hub login. Is there any way we could detect this condition (the problem being, I think we'd have to specifically parse the 302 redirect content looking for /login to determine when it's happened?) and back off on the refresh rate?
It certainly fills the Hub logs with spam, and I think it may be part of what's to blame for 504s happening at the nginx-ingress controller layer, if, as I suspect, the Hub's TCP accept() queues are filling up.
The current version seems to be incompatible with the latest version of jupyterlab.
I am getting:
Uncaught (in promise) Error: No provider for: jupyter.services.commandpalette.
    at JupyterLab.Application.resolveService (http://localhost:8890/lab/main.bundle.js:12831:36)
    at http://localhost:8890/lab/main.bundle.js:12793:73
    at Array.map (native)
    at JupyterLab.Application.activatePlugin (http://localhost:8890/lab/main.bundle.js:12793:39)
    at http://localhost:8890/lab/main.bundle.js:12879:67
    at Array.map (native)
    at JupyterLab.Application.start (http://localhost:8890/lab/main.bundle.js:12879:34)
    at JupyterLab.start (http://localhost:8890/lab/main.bundle.js:1292:40)
    at http://localhost:8890/lab:81:7
Installed dask-labextensions according to the README. Running jupyterlab=0.11.2 from conda-forge on MacOS Sierra.
npm ERR! Unexpected token < in JSON at position 0
C:\dev\code\dask-labextension [master ≡]
λ npm --version
npm info it worked if it ends with ok
npm info using [email protected]
npm info using [email protected]
npm info ok
3.10.3
As discussed in #21 (comment) I'm seeing CORS errors when using this extension:
18 Cross-Origin Read Blocking (CORB) blocked cross-origin response <URL> with MIME type text/html. See <URL> for more details.
Cross-Origin Read Blocking (CORB) blocked cross-origin response http://server:59863/statics/images/dask-logo.svg?1535956405943 with MIME type text/html. See https://www.chromestatus.com/feature/5629709824032768 for more details.
I'm opening a separate issue here to discuss possible workarounds/fixes
We currently ask users to configure clusters startup using kwargs in a config file. Unfortunately, dask's config normalizes underscores to hyphens, making the keys invalid python identifiers..
We can deal with it as a special case here, and replace hyphens with underscores before passing in the kwargs, but a nicer solution might be to have this fixed upstream.
xref dask/dask#4422, dask/dask#4366
A common workflow for me when using distributed is to layout my JupyterLab with a couple of dask panes so I can keep an eye on the cluster. I'm often starting new clusters and pasting new /status urls in the dask-labextension sidebar. When I paste in a new url the current dask panes show a 404 message and AFAICS the only way to get them to recognise the new connection is to close the existing panes, open new panes and then recreate the layout as I had it previously.
It would be great if the dask panes could recognise a new url and connect to it automatically. If there's a reason that can't work automatically, perhaps rather than a 404 message the panes could have a refresh button which would allow them to connect to a new url?

Hello!
@mrocklin, I saw your talk at PlotCon a few months ago where you showed off this extension, and really enjoyed it. Have you tried to install it on a recent version of jupyter lab since they eliminated the --py kwarg from jupyter labextension install?
@blink1073 (sorry to keep bugging you) showed me how to install an extension from an npm package in jupyterlab/jupyterlab#2446 , but I didn't see dask-labextension on npmjs.com, so I don't think that method applies.
Thanks!
Oliver
I think this is the right place to put this issue. Happy to repost if not.
I'm running Jupyter Lab on a compute node without internet access, forwarding the interface through to my browser with ssh tunneling.
As far as I can tell, everything is working but I am getting the error below every 2 seconds. I have the dask-labextension installed as well as nbserverproxy. Everything is up to date as of yesterday.
[E 12:39:53.359 LabApp] 500 GET /proxy/38753/statics/images/dask-logo.svg?1543520390075 (10.148.0.2) 2.79ms referer=http://localhost:8888/lab?
[E 12:39:55.361 LabApp] {
      "Host": "localhost:8888",
      "Connection": "keep-alive",
      "User-Agent": "Mozilla/5.0 (Macintosh; Intel Mac OS X 10_14_1) AppleWebKit/537.36 (KHTML, like Gecko) Chrome/70.0.3538.110 Safari/537.36",
      "Dnt": "1",
      "Accept": "image/webp,image/apng,image/*,*/*;q=0.8",
      "Referer": "http://localhost:8888/lab?",
      "Accept-Encoding": "gzip, deflate, br",
      "Accept-Language": "en-US,en;q=0.9",
      "Cookie": "_xsrf=2|e448eca0|0b525a9a188b60ba2e504858d9d20a2f|1541648386; username-localhost-8888=\"2|1:0|10:1543519136|23:username-localhost-8888|44:ZDE4NmFiNWFmNjJkNGU0NmIyYWU0ZjU5NjQ4ZmRiNTg=|7e22ad6e8f01000cb4ec4cff1a01660ad181a4e2b848e8d66300483c718cefcc\""
    }
If I use an auto-started Dask client, and then I shutdown the cluster, it would be nice if I also called client.close() in the kernel (this is also awaitable if we're in an event loop at this time).
As discussed on pangeo's gitter with @ian-r-rose, I'm playing around with updating a binderhub to use JupyterLab 1.0+. I used the Pangeo binder cookiecutter here as a starting point, but updated things to use newest JLab. The resulting repository is here: https://github.com/djhoese/tutorial-intro-python-satpy
When starting the service I get the error in the screenshot below:

There is a good chance I'm missing one last thing to make this work. @TomAugspurger was also planning on looking at some of this today so there may be something on the Pangeo Binder instance that needs to be updated.
NOTE: I modified my jupyter lab workspace.json to remove the Dask dashboard panes. Not sure if that could cause issues.
Currently the scheduler web address is hard coded to 127.0.0.1:8787. It would be good to make this a user input.
IIUC this is using nbserverproxy currently. As jupyter-server-proxy is the successor of nbserverproxy recently and made a 1.0 release, it would be good to switch to using jupyter-server-proxy instead.
This appears to be ready for a release on PyPI.
@ellisonbg is there a release procedure that you recommend for Jupyter lab extensions?
I've installed this extension with the extension manager in Jupyterlab 0.34.7.

When I try to view the panes dask-labextension presents, I see greyed out buttons:

When I try to drag them or double click on them, nothing happens. I've tried changing "Dask Dashboard URL" to http://127.0.0.1/status, the value presented by client.
How do I view the panes dask-labextension presents?
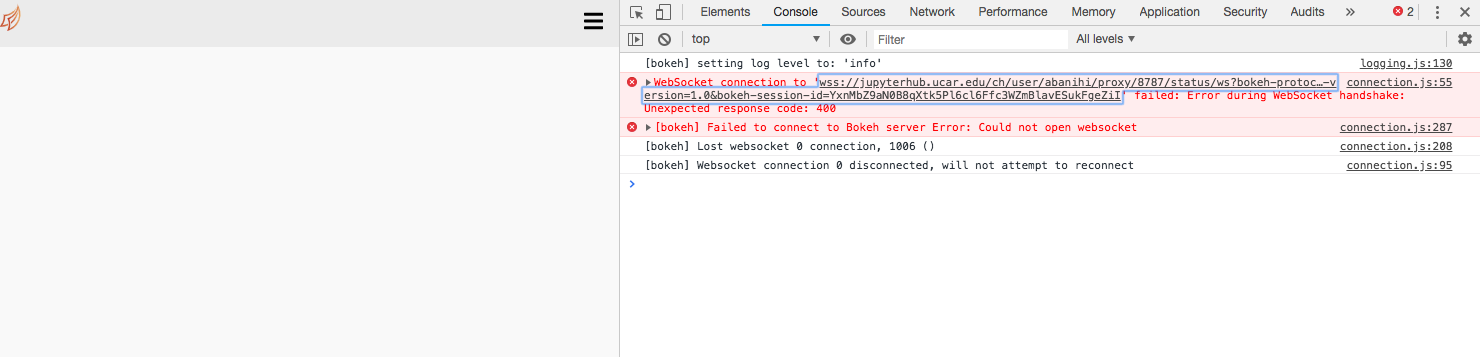
When I try to use the extension via JupyterHub I get the following websocket error
I can confirm that the extension was properly installed:
$ jupyter serverextension list
config dir: /ncar/usr/jupyterhub/20190118/etc/jupyter
    dask_labextension  enabled
    - Validating...
      dask_labextension 0.3.1 OK
    jupyterlab  enabled
    - Validating...
      jupyterlab 0.35.4 OK
    nbserverproxy  enabled
    - Validating...
      nbserverproxy  OK
@jhamman pointed out that he thought the websocket problem was fixed in
bokeh/bokeh#6023. I am wondering whether this has to do with dask-labextension or it is something that would need to be addressed upstream in Bokeh.
Ccing @jbaksta as he is the Jhub's admin, and knows more about the Jhub setup than me.
Hi, I have a similar issue as in #21. But it looks like I am not getting any of the COR error or schema issues. I also looked at #27 and confirmed that the distributed version is up to date and
r = requests.get('http://127.0.0.1:8787' + '/individual-graph') works .
The buttons are just grayed out for me, and no views are loading aside from the sidebar.
In the console I get,
http://127.0.0.1:8787/ does not appear to host a valid Dask dashboard
If I append status to the dashboard URL I get these two outputs.
http://127.0.0.1:8787/status does not appear to host a valid Dask dashboard
Found dashboard link at 'http://127.0.0.1:8787/status
I am using JupyterLab version 0.35.3, through an SSH tunnel.
After installing the dask-labextension, some static content (mainly the sidebar) is broken
conda create -n environment jupyterlab dask nodejs dask_labextension
conda activate environment
jupyter labextension install dask-labextension
triggers a long "Building jupyterlab assets" which end without further output.
Afterwards, static assets are broken (except the Dask tab)

This happens on the following setups:
Laptop:
Windows 7
Chrome / firefox
Server:
CentOS7
Chrome / Firefox
A declarative, efficient, and flexible JavaScript library for building user interfaces.
🖖 Vue.js is a progressive, incrementally-adoptable JavaScript framework for building UI on the web.
TypeScript is a superset of JavaScript that compiles to clean JavaScript output.
An Open Source Machine Learning Framework for Everyone
The Web framework for perfectionists with deadlines.
A PHP framework for web artisans
Bring data to life with SVG, Canvas and HTML. 📊📈🎉
JavaScript (JS) is a lightweight interpreted programming language with first-class functions.
Some thing interesting about web. New door for the world.
A server is a program made to process requests and deliver data to clients.
Machine learning is a way of modeling and interpreting data that allows a piece of software to respond intelligently.
Some thing interesting about visualization, use data art
Some thing interesting about game, make everyone happy.
We are working to build community through open source technology. NB: members must have two-factor auth.
Open source projects and samples from Microsoft.
Google ❤️ Open Source for everyone.
Alibaba Open Source for everyone
Data-Driven Documents codes.
China tencent open source team.