


GPS data overlay on videos
The Ultimate Cycling Software
Table of Contents
Download
Download the latest executable jar file (gps-overlay-on-video.jar) from here
Overview
The idea came after I bought a GoPro camera and started to record some of my rides with the bicycle which were also tracked with a GPS device. For tracking the rides I was using the Strava application on my phone or a Garmin Edge 510. After watching the videos I was asked why I'm not showing the speed and altitude information overlaid onto video? Cool, great idea, I wanted to add all kind of telemetry data acquired via the GPS onto the video, but couldn't find a software for it, running on my Mac. So I decided the write one :) The generated video is able to show the current speed or the actual elevation information, eventually the grade of the slope when climbing a steeper section or the current heart rate zone. The main focus is on cycling videos, but with small effort, different gauge templates it is easy to create dashboard for different type of activities.
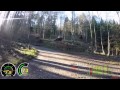
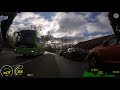
Example of videos generated with the tool, links to youtube:


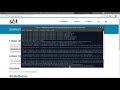
Screenshot of the tool:

How to use it
- Thank you Bigjuergo for creating the how to use 4min tutorial
- Thank you Schrottie for creating the how to in german
Basic requirements
Small list of wishes to achieve:
- show the video file and the track on the map to help synchronizing (shifting) the gps data to the beginning of the video
- add various gauges (drag'n drop into the video panel) like: speed, cadence, heart rate, altitude, acceleration, temperature, etc.
- once the gauges were added and adjusted (the size and position) allow to save the configuration as a template, so next time it is easier to just load the template and create the new video
- and the final bit, export (or generate) to newly created video with the desired gauges.
All the information is extracted from the gps data, since mainly the coordinates and timestamps are known, it is easy to calculate
- distance
- speed
- acceleration
- direction (compass)
- provide charts about the elevation
- etc.
Telemetry data sample collected with a Garmin device (Edge 820):
<trkpt lat="47.1512900" lon="8.7887940">
  <ele>902.4</ele>
  <time>2017-09-24T06:10:53Z</time>
  <extensions>
    <power>205</power>
    <gpxtpx:TrackPointExtension>
      <gpxtpx:atemp>8</gpxtpx:atemp>
      <gpxtpx:hr>160</gpxtpx:hr>
      <gpxtpx:cad>90</gpxtpx:cad>
    </gpxtpx:TrackPointExtension>
  </extensions>
</trkpt>
Credits
The application is using libraries and images created by other people or organizations:
- JXMapViewer to show the map and the track
- xuggle library to decode, encode and manipulate video files
- iconeden for the beautiful icon packs they offer
- digital true type fonts for the gauges with seven segment display
Resources
Links
Useful links and information
Generating new video with gps overlay
After synchronizing the video stream with the gps track (through the shift parameter) everything is prepared to generate a new video:

And here it is :) the first video generated with the software (Zugerberg Classic):

Gauge ideas
Besides the basic gauge types (speed, cadence, etc.) showing the current value so called chart types are introduced as well. The charts are showing all the data (for example an elevation chart) and the current value.
The very early drafts on the paper, how it started:


