Git Product home page Git Product logo

d3-area-label's Introduction

d3-area-label

A library for placing labels in areas.

image

image

image

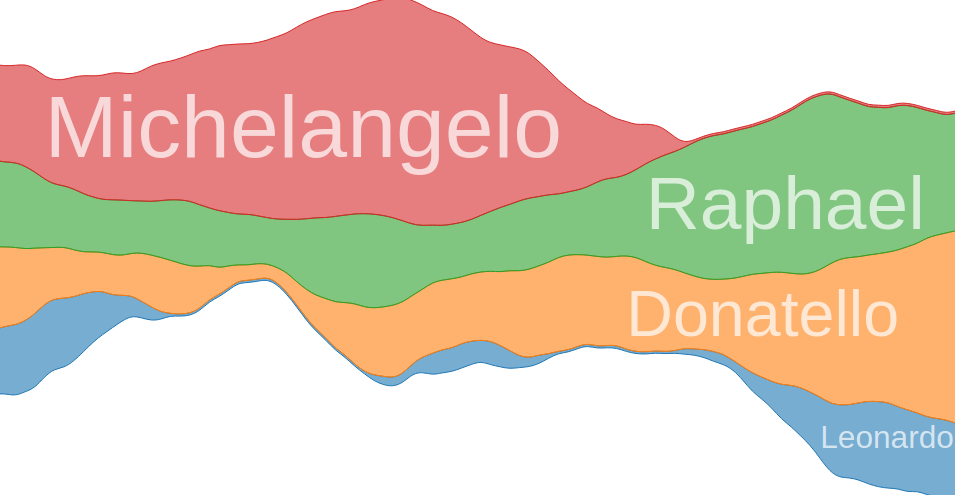
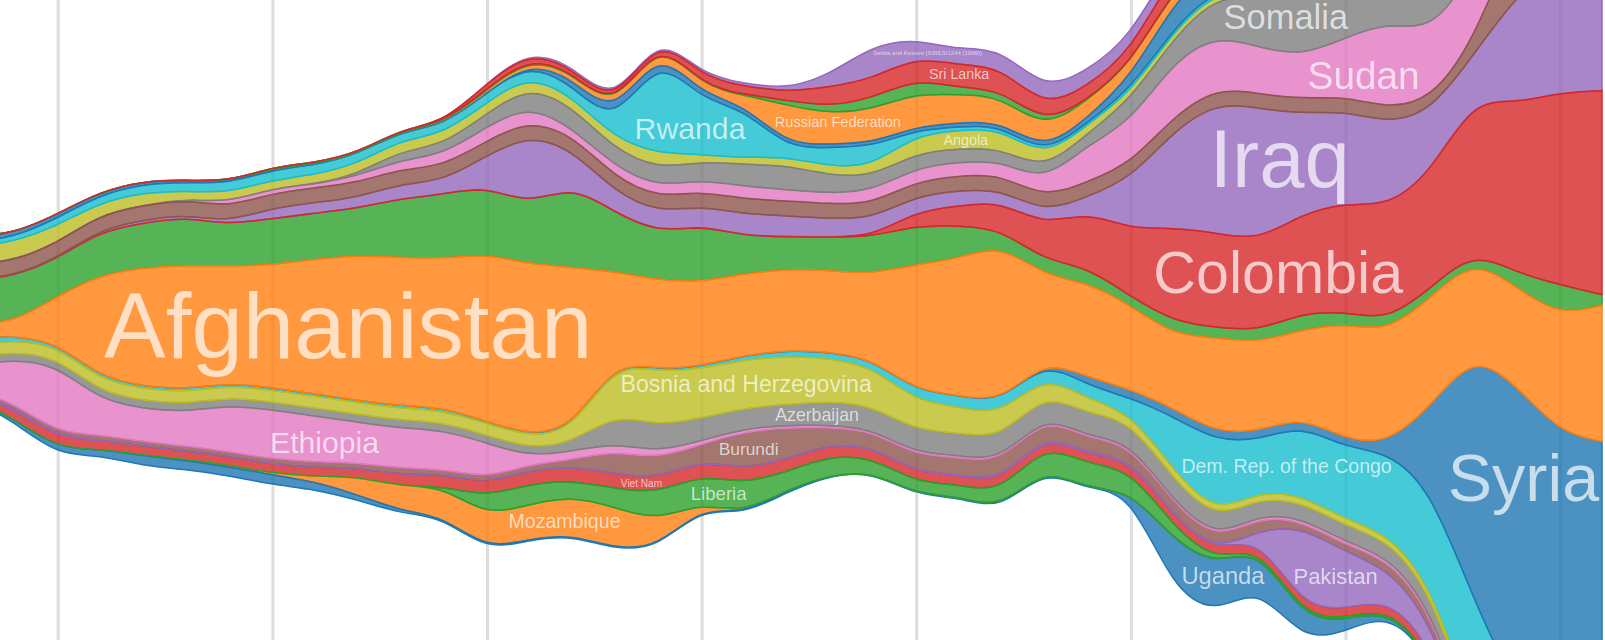
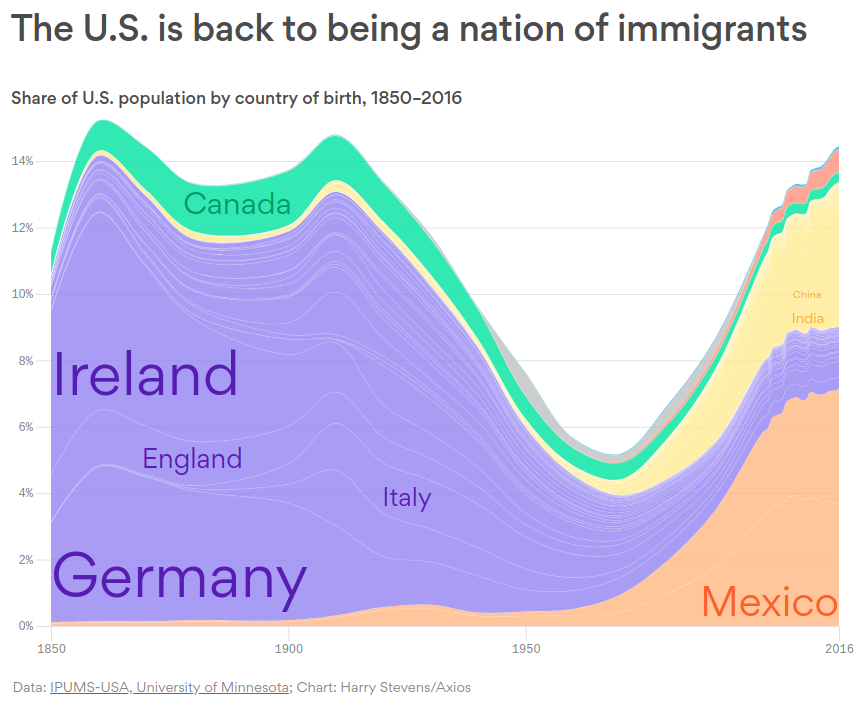
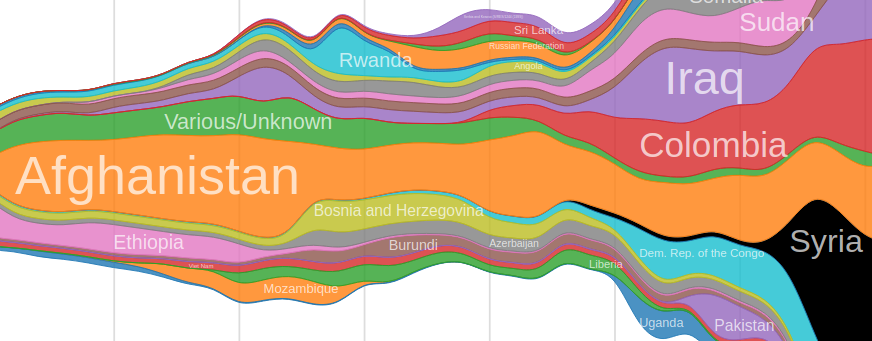
You can use this to position labels on a StreamGraph or Stacked Area Chart.

Example usage:

const labels = svg.selectAll('text').data(stacked)
labels
  .enter().append('text')
    .attr('class', 'area-label')
  .merge(labels)
    .text(d => d.key)
    .attr('transform', d3.areaLabel(area)) // <---------- Call the function like this.

For more details and context, see test/index.html or run the example on bl.ocks.org.

How it Works

The label placement algorithm works as follows:

  • Measure the width and height of the bounding box of the text.
  • Use the bisection method to search for the maximum size rectangle that fits within the area and has the same aspect ratio as the measured bounding box.
    • For each iteration of the bisection method (where a specific size is given for testing), loop through all X coordinates that may potentially be used as the left edge of the label bounding box and perform the following test.
      • For a given X coordinate to be used as the left edge of the label, x0, find the first X coordinate that falls after the right edge of the label x1. For each X coordinate x between (and including) x0 and x1, compute the ceiling and floor to be the lowest Y coordinate of the top curve of the area and the highest Y coordinate of the bottom curve of the area, respectively.
        • If at any point (ceiling - floor) < height, where height is the height of the label bounding box being tested, break out of this iteration and move on to testing the next X coordinate.
        • If (ceiling - floor) >= height after having checked all x between x0 and x1, return the current x value as the solution. Note Only the first solution found is returned, no attempt is made to optimize this solution, because the optimization occurs at the level of scale choice; the bisection method will converge to a scale for which there is only 1 or very few solutions.
      • If no solution was found after having looped through all available X coordinates to be used as the left edge of the label, return false.

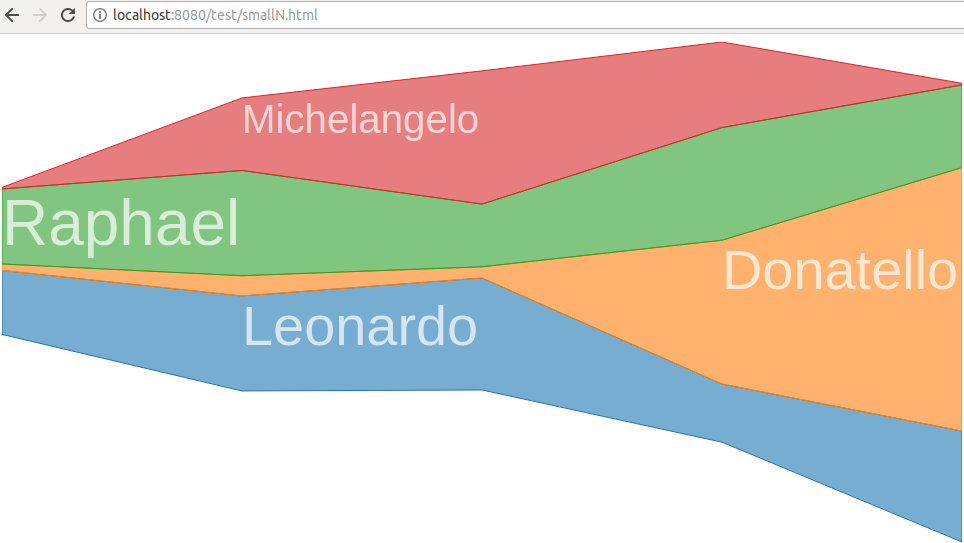
The set of possible X coordinate to be used as the left edge of the label depends on how interpolate and interpolateResolution are configured. If interpolation is turned off, the original X coordinates from the data points are the only coordinates considered for label placement. For datasets where there are large gaps between X coordinates, we can improve label placement by turning on interpolation, which will generate a certain number (interpolateResolution) of evenly spaced X coordinates and use linear interpolation to compute the corresponding Y coordinates for the top and bottom of the area curve. Cranking up the interpolateResolution value leads to more optimal label placement at the cost of more computation.

Installing

If you use NPM, npm install d3-area-label. Otherwise, download the latest release.

API Reference

# d3.areaLabel([area])

Constructs a new label position generator.

If area is specified, invokes areaLabel.area as well (equivalent to d3.areaLabel().area(area)).

# areaLabel(data)

Invoke the label position generator with the given data array.

This function computes the optimal position and size for a label and returns an SVG transform string.

# areaLabel.area(area)

Sets the x, y0, and y1 accessors applied to the data array from the given area, an instance of d3.area.

# areaLabel.x(x)

If x is specified, sets the x accessor applied to the data array and returns the label position generator. If x is not specified, returns the current x.

# areaLabel.y0(y0)

If y0 is specified, sets the y0 accessor applied to the data array and returns the label position generator. If y0 is not specified, returns the current y0.

# areaLabel.y1(y1)

If y1 is specified, sets the y1 accessor applied to the data array and returns the label position generator. If y1 is not specified, returns the current y1.

# areaLabel.minHeight(minHeight)

The minimum label bounding box height in pixels. Default is 2.

# areaLabel.epsilon(epsilon)

The tolerance within we wish to optimize the bounding box height (in pixels). Default is 0.01;

# areaLabel.maxIterations(maxIterations)

The maximum number of iterations for the bisection method algorithm, which is used to find the maximum height rectangle that fits within the area.

# areaLabel.interpolate(interpolate)

A boolean value that determines whether or not linear interpolation is used for computing label positions.

If set to false, only X coordinates that correspond to data points are considered for use as the leftmost position of the label bounding box. In cases where there is a high number of evenly spaced data points, a value of false works quite well. When there is a low number of data points, a value of false leads to embarassingly pathetic label placements.

If set to true, then a fixed number of X coordinates (interpolateResolution to be exact), not necessarily corresponding to data points, are considered for use as the leftmost position of the label bounding box. The upper and lower Y values for those X values are imputed from the nearest X values from the data using linear interpolation. When there is a low number of data points, a value of true improves label placement by leaps and bounds. A value of true also leads to more expensive computation for placing labels, so if you're encountering performance problems, try setting this to false.

Default is true.

# areaLabel.interpolateResolution(interpolateResolution)

The integer number of possible X positions to check for placing the leftmost edge of the label bounding box. The X extent of the area is subdivided evenly into this many points. When each point is checked, linear interpolation is used to estimate the data value. Default is 200.

This only comes into effect if interpolate is set to true.

# areaLabel.paddingLeft(paddingLeft)

The left padding for labels. This should be a value between 0 and 1. Default is 0.

# areaLabel.paddingRight(paddingRight)

The right padding for labels. This should be a value between 0 and 1. Default is 0.

# areaLabel.paddingTop(paddingTop)

The top padding for labels. This should be a value between 0 and 1. Default is 0.

# areaLabel.paddingBottom(paddingBottom)

The bottom padding for labels. This should be a value between 0 and 1. Default is 0.

# areaLabel.paddingX(paddingX)

A convenience method for simultaneously setting paddingLeft and paddingRight.

# areaLabel.paddingY(paddingY)

A convenience method for simultaneously setting paddingTop and paddingBottom.

# areaLabel.padding(padding)

A convenience method for simultaneously setting paddingX and paddingY.

Thanks

Many thanks to Lee Byron, Noah Veltman, Philippe Rivière, and Adam Pearce for ideas and input.

d3-area-label's People

Contributors

curran avatar legion4444 avatar

Stargazers

 avatar  avatar  avatar  avatar  avatar  avatar  avatar  avatar  avatar  avatar  avatar  avatar  avatar  avatar  avatar  avatar  avatar  avatar  avatar  avatar  avatar  avatar  avatar  avatar  avatar  avatar  avatar  avatar  avatar  avatar  avatar  avatar  avatar  avatar  avatar  avatar  avatar  avatar  avatar  avatar  avatar  avatar  avatar  avatar  avatar  avatar  avatar  avatar  avatar  avatar  avatar  avatar  avatar  avatar  avatar  avatar  avatar  avatar  avatar  avatar  avatar  avatar  avatar  avatar  avatar  avatar  avatar  avatar  avatar  avatar  avatar  avatar  avatar  avatar

Watchers

 avatar  avatar  avatar  avatar  avatar  avatar

d3-area-label's Issues

Design API

Should this follow the same pattern as other D3 modules for setting parameters?

How to best expose the positioning result?

Is the current API too limiting?

[Question] Using this package for server-side D3 rendering

Hello and thank you for writing an excellent package!

I'm attempting to use it for generating graphs of Spotify users' listening history (example). As I built out the rendering code, the large quantity of data and rendered SVG components led to huge slowdowns of my browser. Due to that and other operational constraints, I decided to instead render the graphic on the server-side and send the SVG file to my front end. I am using JSDOM to simulate a DOM for D3 rendering (something similar to this) and that's generally working alright.

However, the one issue I'm having is with this line: https://github.com/curran/d3-area-label/blob/master/src/area-label.js#L79

SVGElement.getBBox() is undefined in the context of JSDOM. This of course makes sense, as JSDOM does not actually lay out and render elements, and rather handles only DOM manipulation. I have been tweaking the dependency code of d3-area-label and struggling to reproduce the functionality of getBBox in a way that can enable the package to properly position and scale labels.

As you mentioned in #26, measuring text labels is quite tricky. That said, I thought it would be worth reaching out to ask if you have any insight on how I might be able to tweak d3-area-label to support JSDOM or another non-browser environment.

Please let me know if you have any thoughts, and thanks again for creating this!

Optimize for thin areas

We can break out early if there's no X coordinate in the whole area where the height is less than maxHeight. Running into this case a lot; degenerate streams after filtering.

Strategize Algorithm

Related to leebyron/streamgraph#3

The algorithm should find the maximum size possible, and position the label in the center of available space.

Prior art:

Stacked area label placement #2 by Noah Veltman

function getBestLabel(points) {

  var bbox = this.getBBox(),
      numValues = Math.ceil(x.invert(bbox.width + 20)),
      bestRange = -Infinity,
      bestPoint;

  for (var i = 1; i < points.length - numValues - 1; i++) {

    var set = points.slice(i, i + numValues),
        floor = d3.min(set, d => y(d[0])),
        ceiling = d3.max(set, d => y(d[1]));

    if (floor - ceiling > bbox.height + 20 && floor - ceiling > bestRange) {
      bestRange = floor - ceiling;
      bestPoint = [
        x(i + (numValues - 1) / 2),
        (floor + ceiling) / 2
      ];
    }
  }

  return bestPoint;
}

Streamgraph label positions by Noah Veltman

function getBestLabel(points) {
  var bbox = this.getBBox(),
      numValues = Math.ceil(x.invert(bbox.width + 20)),
      finder = findSpace(points, bbox, numValues);

  // Try to fit it inside, otherwise try to fit it above or below
  return finder() ||
    (points.top && finder(y.range()[1])) ||
    (points.bottom && finder(null, y.range()[0]));
}

function findSpace(points, bbox, numValues) {

  return function(top, bottom) {
    var bestRange = -Infinity,
      bestPoint,
      set,
      floor,
      ceiling,
      textY;

    // Could do this in linear time ¯\_(ツ)_/¯
    for (var i = 1; i < points.length - numValues - 1; i++) {
      set = points.slice(i, i + numValues);

      if (bottom != null) {
        floor = bottom;
        ceiling = d3.max(set, d => y(d[0]));
      } else if (top != null) {
        floor = d3.min(set, d => y(d[1]));
        ceiling = top;
      } else {
        floor = d3.min(set, d => y(d[0]));
        ceiling = d3.max(set, d => y(d[1]));
      }

      if (floor - ceiling > bbox.height + 20 && floor - ceiling > bestRange) {
        bestRange = floor - ceiling;
        if (bottom != null) {
          textY = ceiling + bbox.height / 2 + 10;
        } else if (top != null) {
          textY = floor - bbox.height / 2 - 10;
        } else {
          textY = (floor + ceiling) / 2;
        }
        bestPoint = [
          x(i + (numValues - 1) / 2),
          textY
        ];
      }
    }

    return bestPoint;
  };

I'd describe the problem as something like this: Given an aspect ratio for a rectangle, and a polygon bounded on the top and bottom by X-monotone curves, find the rectangle of that aspect ratio of maximum size that fits inside of the polygon.

Ideally the solution would also center the rectangle in the available space, but I'm not quite sure how to phrase that bit, geometrically speaking.

Algorithm sketch:

  • Measure text to find aspect ratio
  • Use Bisection method to search for the maximum scale within some epsilon, using the following function as a test:
    • Find the first instance of a rectangle with the given scale and aspect ratio.
  • Find the best point to place a label of the maximum scale and aspect ratio

Note that the algorithm should handle timeseries data where intervals are not consistant, such as the data in Syrian Refugees by Settlement Type.

Padding

It appears that sometimes text actually falls outside the bounding box, as we can see here:
image
To solve this, and as a general nice option to have, let's add an option for label padding. We probably should have vertical padding and horizontal padding able to be different values.

Use Interpolation

Currently we get rather pathetic placements for small N:
image

This is because the algorithm only considers X coordinates for the label from the set of X coordinates used in the data.

We could remedy this by interpolating more Y values using linear interpolation, and testing more X values than there are data values.

Here's a roughly similar bit of code that interpolates values that we could potentially draw from:

      var bisectDate = d3.bisector(function (d) {
        return d.date;
      }).left;
      function getInterpolatedValue (values, date, value){
        const i = bisectDate(values, date, 0, values.length - 1);
        if (i > 0) {
          const a = values[i - 1];
          const b = values[i];
          const t = (date - a.date) / (b.date - a.date);
          return value(a) * (1 - t) + value(b) * t;
        }
        return value(values[i]);
      }

Breaks in WebPack

Due to referencing d3 in the library, rather than an import:

    my.x = function(_) {
      if (arguments.length) {
        x = _;
        bisectorX = d3.bisector(x).right;
        return my;
      }

Guarantee Labels are Inside Areas

Currently, when there's a small number of data points, the labels do not always end up inside the shape.
image

I think this is because the data point that falls beyond the right side of the label rectangle is not being taken into account.

Upgrade Dependencies

I want to show that this package is still supported / maintained.

Upgrading dependencies would send this signal.

Make independent of D3 DOM Manipulation

As a user of Svelte or React, I want to be able to place labels using this library without having to use D3 selections for DOM manipulation.

Currently, the only way to use this library is to use D3 selections.

The original reasoning behind this was related to measuring the length of the text (I think).

I'm open to suggestions/PRs/ideas for how to disentangle the label placement from the DOM manipulation.

Specify extent

Sometimes we have an area that goes off screen to the left or right. We still want to be able to label these areas. What if we could pass in an extent within which areas can be placed? Currently we're using the extent of the X accessor. That could be the default behavior if no extent is specified.

Recommend Projects

  • React photo React

    A declarative, efficient, and flexible JavaScript library for building user interfaces.

  • Vue.js photo Vue.js

    🖖 Vue.js is a progressive, incrementally-adoptable JavaScript framework for building UI on the web.

  • Typescript photo Typescript

    TypeScript is a superset of JavaScript that compiles to clean JavaScript output.

  • TensorFlow photo TensorFlow

    An Open Source Machine Learning Framework for Everyone

  • Django photo Django

    The Web framework for perfectionists with deadlines.

  • D3 photo D3

    Bring data to life with SVG, Canvas and HTML. 📊📈🎉

Recommend Topics

  • javascript

    JavaScript (JS) is a lightweight interpreted programming language with first-class functions.

  • web

    Some thing interesting about web. New door for the world.

  • server

    A server is a program made to process requests and deliver data to clients.

  • Machine learning

    Machine learning is a way of modeling and interpreting data that allows a piece of software to respond intelligently.

  • Game

    Some thing interesting about game, make everyone happy.

Recommend Org

  • Facebook photo Facebook

    We are working to build community through open source technology. NB: members must have two-factor auth.

  • Microsoft photo Microsoft

    Open source projects and samples from Microsoft.

  • Google photo Google

    Google ❤️ Open Source for everyone.

  • D3 photo D3

    Data-Driven Documents codes.