Git Product home page Git Product logo

vikus-viewer's Introduction

VIKUS Viewer

VIKUS Viewer

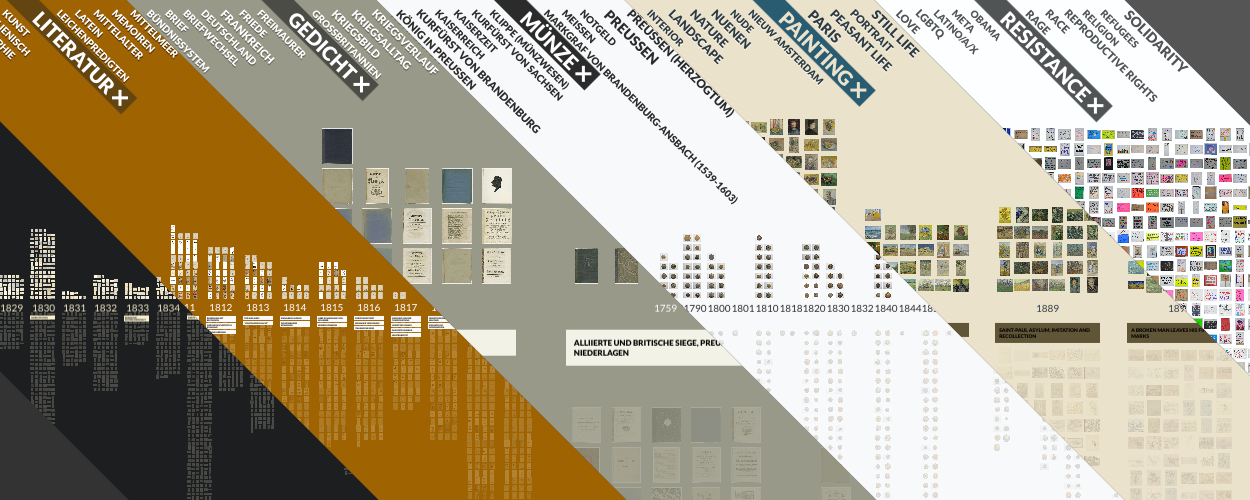
VIKUS Viewer is a web-based visualization system that arranges thousands of cultural artifacts on a dynamic canvas and supports the exploration of thematic and temporal patterns of large collections, while providing rapid access to high-resolution imagery.

Documentation

This repo contains the HTML, CSS and JS of the VIKUS Viewer software. To get started you will have to clone this repo and run a webserver. We recommend nginx for production, but any web server will work too. There is no server-side logic necessary. To minimize the loading time your should make use of GZIP compression on JS and CSV files. Also enable HTTP/2, since Multiplexing will heavily help with loading all those image assets.

IIIF

VIKUS Viewer can be used with IIIF Collections through the vikus-IIIF-generator.

Metadata

To use the VIKUS Viewer for a custom image collection, you need to prepare metadata files that describe the collection and objects, and configure the visualization. To get started, you first need to create a /data folder which will contain all metadata and image files. Have a look at the metadata generated for the Van Gogh collection (Van Gogh Museum) as a reference for the following descriptions.

This is the configuration file that defines the project name, data URLs, columns, styles, and what is shown in the detail sidebar of your collection. The URLs don't have to be absolute, but it can be handy if your assets are not hosted on the same server.

The data.csv holds all the metadata information for each object in the collection. The following fields are mandatory: id , keywords, year.

  • id is is linked to the name of the corresponding image. (id: 123 -> 123.jpg)
  • keywords comma seperated list of keywords for the tags on the top
  • year can be a number or a string, will be sorted ascending
  • _fields these are custom metadata fields (note the prefixed underscore)

All of the columns are beeing sticked together to enable the freetext search.

The timeline.csv holds the information for the timeline displayed underneath the years.

  • year can be a number or a string, is linked to the year field in data.csv
  • title the headline of the blurb
  • text first detail text when zoomed in a little bit
  • extra additional text when zoomed to the maximum

This is the information displayed on the left side when opening the visualization. You can put in any kind of Markdown.

Images

Apart from the metadata, you need to preprocess the image files, i.e., to generate sprites and textures for the different zoom levels. Please see the vikus-viewer-script for the details. After running the script you can place the resulting folders into /data or any other location. Make sure that the texture URLs in the config.json point to these folders.

Similarity (t-SNE/UMAP)

As an alternative to the temporal view, you can create a t-SNE/UMAP layout based on image similarity. The script in vikus-viewer-script creates a tsne.csv which can be put next to the data.csv in the /data folder. Image similarity is calculated via the imagenet activation logit and then run through t-SNE. An additional spacing step ensures no overlaying images in the distribution. You can also create the layout through a Jupyter Notebook in python using CLIP.

Layouts

You can add layouts or remove the lime layout in the loader.layout section of the config.json. Add a custom layout in this format: {"title": "UMAP", "url": "umap.csv", "scale": 0.8 }. The scale parameter is optional and can we tweaked depending on your layout and number of images.

Credits

VIKUS Viewer was designed and developed by Christopher Pietsch. The VIKUS Viewer software is based on the visualization code behind Past Visions, a collaborative effort by Katrin Glinka, Christopher Pietsch, and Marian Dörk carried out at the University of Applied Sciences Potsdam in the context of the Urban Complexity Lab during the research project VIKUS (2014-2017). Related Paper: Past Visions and Reconciling Views. The T-SNE view has been implemented for the Sphaera project with funding from Chronoi-REM

Libraries

License

You may use VIKUS Viewer under the terms of the MIT License. See http://en.wikipedia.org/wiki/MIT_License for more information. Copyright (C) 2017-2021 Christopher Pietsch, and contributors

Gallery

vikus-viewer's People

Contributors

aamir-s18 avatar abbe98 avatar cpietsch avatar fidelthomet avatar l0rn0r avatar mnoichl avatar nrchtct avatar sinanatra avatar

Stargazers

 avatar  avatar  avatar  avatar  avatar  avatar  avatar  avatar  avatar  avatar  avatar  avatar  avatar  avatar  avatar  avatar  avatar  avatar  avatar  avatar  avatar  avatar  avatar  avatar  avatar  avatar  avatar  avatar  avatar  avatar  avatar  avatar  avatar  avatar  avatar  avatar  avatar  avatar  avatar  avatar  avatar  avatar  avatar  avatar  avatar  avatar  avatar  avatar  avatar  avatar  avatar  avatar  avatar  avatar  avatar  avatar  avatar  avatar  avatar  avatar  avatar  avatar  avatar  avatar  avatar  avatar  avatar  avatar  avatar  avatar  avatar  avatar  avatar  avatar  avatar  avatar  avatar  avatar  avatar  avatar  avatar  avatar  avatar  avatar  avatar  avatar  avatar  avatar  avatar  avatar  avatar  avatar  avatar  avatar  avatar  avatar  avatar  avatar  avatar  avatar

Watchers

 avatar  avatar  avatar  avatar  avatar  avatar

vikus-viewer's Issues

Starting on the tsne view

Thank's for the great project, I think it's really amazing!

I'm exploring a dataset for which the time-view is not very interesting, and I would like to start off on the tsne-view instead. I was wondering, is there an easy way to accomplish this?

Remove comment and include null check for `selectedImage`

Hey Christopher,

this is a great project! We modified the Vikus Viewer and used it as a part of our project.

Some minor things:

  • It would be great to remove the console.log statements or introduce a debug config flag. (Maybe you can have a dev branch where you keep them).
  • Also, I am not sure if it is necessary to have the time information from the tsne
  • In js/canvas.js we had some errors with selectedImage. In line 374 and 663.

I removed the comments and fixed the selectedImage in this repo. If you agree, with the removal of the comments, I can a make Pull request :).

Feature request: Multiple timelines

I'd love to be able to see multiple timeline views (visualize a collection by creation date and also by accession date, for instance). Would be great to add new tabs on the left (along with "time" and "similarity") for additional timelines.

This would also allow for a grid view (a timeline view with a single column) that visualizes a collection by color, or brightness, etc. (Sort the data.csv by hue and present as a single-column timeline.)

Thanks!

Changing tsne sidebar label to "similarity" breaks TSNE view.

Hello!
The latest update that changes "tsne" to "similarity" in the .navi sidebar (2e5879c) in index.html appears to break the TSNE visualization unless viz.js or canvas.js are modified, since state.mode is set using canvas.setMode()

vikus-viewer/js/canvas.js

Lines 458 to 461 in 2e5879c

canvas.setMode = function (mode) {
state.mode = mode
canvas.project()
}

with the text of the label...

vikus-viewer/js/viz.js

Lines 123 to 127 in 2e5879c

d3.selectAll(".navi .button")
.on("click", function () {
var that = this
var mode = d3.select(this).text()
canvas.setMode(mode)

...and then referenced directly to determine whether to project TSNE...

vikus-viewer/js/canvas.js

Lines 660 to 661 in 2e5879c

if (state.mode == "tsne") {
canvas.projectTSNE();

Would using the button's class (.button.tsne, .button.time) instead of the text make more sense? Or is it better to just change the if statement on line 660 of canvas.js?
(Or am I missing something else here? Figuring out Vikus for the first time!)

Dropping performance after clicking first image

First of all thank you for this great viewer, I'm really loving the potential of this!

I'm trying it out with a dataset of around 11000 images. And it all works really smooth after the first page load.
However, performance drops once I clicked one of the images to see the detail view and zoom out again. (latest chrome on mac 10.14)
Please see my example here: http://nijdam.nu/vikus-viewer/

I did checkout out the tsne branch to see if that might improve things, but that made no difference.

On a side note, do you have a roadmap? because I'm actually wanting to sort on two columns like you do on https://uclab.fh-potsdam.de/coins/ and on other examples you also have a tsne and grid layout I'm wanting to incorporate. (give someone a finger and they want the whole hand :-)

Also I commented out the if statement on line 470 in canvas.js because otherwise I did not have any data in the detail page. (now I'm writing this I realize it's because my columns in data.csv are not prefixed with a _)

for (field in selectedImage) {
    //if (field[0] === '_')
        detailData[field] = selectedImage[field]
}

I understand there is still some work to do, and I know that you do this on a voluntairy basis so thank you for this! Really looking forward to future releases.

EDIT:
It has something to do with the line I changed to make the detail view working, really weird. Performance is ok when I revert canvas.js but now I have no data in the #detail view.

EDIT2:

I did not notice the columns year, id and keywords are automatically available as _keywords etc. I thought since I have a column keywords in data.csv the source should also be keywords, but I was wrong, source should be _keywords.

Now it looks like it is working fine, including zoom in and out.

So the only question I have left is when the other layout options will be available :-)

Sincerely,

Feature request: Operators "NOT" and "OR" for keywords

How much work, do you think, it would be add to the Vikus viewer a second and identical keywords bar that has the operator NOT built in. So, hitting a keyword there will exclude all items having the keyword -- instead of hiding all items that don't have the respective keyword (as it works now). The two bars don't necessarily need to work in combination but one could just add a toggle for the operator "NOT". And the same would also work for "OR". This would make visual exploration much more powerful.

Portrait mode size for zoom

When you zoom on portrait-mode images, they are too big for the canvas, when you zoom out, the info-box disappears, this means you cannot see the full image while also seeing the info-box.

Discussion: Hierarchical Filtering - Top Level Font-Size

When the hierarchical Filters are in their unfiltered state, the font-size differs, i guess the font-size depends on the largest internal group.
Screenshot 2020-04-23 at 17 44 21

But as soon as one selects any top-level filter, all top-levels become the same font-size.
Screenshot 2020-04-23 at 17 44 34

I think its a bit confusing that the top-levels have different font-sizes, and that those sizes change once something is selected. But maybe this is personal taste. Maybe there could be a config option to toggle this?!

Map branch not displaying sprites

Hello @cpietsch, first of all thank you for this beautiful piece of code you put together, it's being really helpful for more than one project I'm working on.

I'm trying to get the map branch to work with my data and everything looks fine except for one or two issues: the sprites don't seem to be loaded either on the timeline or the map, even though they work fine with the "default" vikus-viewer. The console is not giving me any errors about that. Other than that, when I click on a sprite placeholder on the map, it zooms in way more than expected, rendering bigImage larger than it's supposed to (that is, fitting the window left of sidebar detail). Here are some screenshots:

Screen Shot 2021-04-01 at 16 58 54 Screen Shot 2021-04-01 at 16 59 20

Do you know what might be wrong with my instance? I tried messing with the hardcoded scales and ratios such as zoomedToImageScale and zoomToImage related vars but couldn't really get it to behave the way I'd like.

Thanks again!

Feature request: keyboard to clear filter, keep view in TSNE

In tsne view, I'd like to be able to filter the view, zoom in, find an object, then press "x" to clear all filters, and see the object surrounded by all similar objects. (Currently you need to find the object, then zoom out, cancel the filters, then zoom back in...)

Alternatively, it would be great to access the filters somehow while zoomed in.

Thanks!

Add tags to URL as querystring?

skarmavbild 2019-02-06 kl 22 01 25

One way to facilitate sharing might be to expose selected tags in the URL. Basically you need to a) look in the querystring for tags and add those to the array of selected tags and b) update the querystring when selecting/deselecting tags.

Multiple pages for the same document

I ended up in another dead end: how could I display multiple pages of the same document (same data.csv line)? I'm trying to obtain the same navigation as in the https://vikusviewer.fh-potsdam.de/recs/vis/ (Seite with multiple pages and the ability to click trough previous and next page). In my data.csv I have an id column followed by several columns without any other header, but with id names in them (like in the image bellow):

ids_seite

Any advice would be really helpful.

Keyboard navigation

keyboard navigation with plus, minus and arrow keys; maybe tab for next photo

  • I saw this as a project card. Any way I could give a hand in helping with this?

Trouble launching?

When I launch this I am unable to do anything and the page is black/says Powered by VIKUS Viewer. How do I actually do things with this? Am I doing something wrong?

Recommend Projects

  • React photo React

    A declarative, efficient, and flexible JavaScript library for building user interfaces.

  • Vue.js photo Vue.js

    🖖 Vue.js is a progressive, incrementally-adoptable JavaScript framework for building UI on the web.

  • Typescript photo Typescript

    TypeScript is a superset of JavaScript that compiles to clean JavaScript output.

  • TensorFlow photo TensorFlow

    An Open Source Machine Learning Framework for Everyone

  • Django photo Django

    The Web framework for perfectionists with deadlines.

  • D3 photo D3

    Bring data to life with SVG, Canvas and HTML. 📊📈🎉

Recommend Topics

  • javascript

    JavaScript (JS) is a lightweight interpreted programming language with first-class functions.

  • web

    Some thing interesting about web. New door for the world.

  • server

    A server is a program made to process requests and deliver data to clients.

  • Machine learning

    Machine learning is a way of modeling and interpreting data that allows a piece of software to respond intelligently.

  • Game

    Some thing interesting about game, make everyone happy.

Recommend Org

  • Facebook photo Facebook

    We are working to build community through open source technology. NB: members must have two-factor auth.

  • Microsoft photo Microsoft

    Open source projects and samples from Microsoft.

  • Google photo Google

    Google ❤️ Open Source for everyone.

  • D3 photo D3

    Data-Driven Documents codes.