cozzin / cozzin.github.io Goto Github PK
View Code? Open in Web Editor NEWBlog
Home Page: https://cozzin.github.io
License: MIT License
Blog
Home Page: https://cozzin.github.io
License: MIT License

![dependabot[bot] avatar](https://avatars.githubusercontent.com/in/29110?v=4 "dependabot[bot]")

https://developer.apple.com/videos/play/wwdc2021/10181/
툴이 되게 많음

자 이렇게 따라가 봅시다

스프레이 버튼 > Energy Impact 들어가서 Energy Impact 확인할 수 있음


원격 측정 프레임워크. 릴리즈된 앱을 측정하는데 도움이 될 수 있음

class AppMetrics: MXMetricManagerSubscriber {
	init() {
		let shared = MXMetricManager.shared
		shared.add(self)
	}

	deinit {
		let shared = MXMetricManager.shared
		shared.remove(self)
	}

	// Receive daily metrics
	func didReceive(_ payloads: [MXMetricPayload]) {
		// Process metrics
	}

	// Receive diagnostics
	func didReceive(_ payloads: [MXDiagnosticPayload]) {
		// Process metrics
	}
}
앱 사용 퍼포먼스 -> 애플 서버에 전달됨 -> Xcode Organizer에서 볼 수 있음

Organizer 켜면 Battery Usage 확인할 수 있음. 최근 16개 버전 볼 수 있음

Regression Pane

어떤 부분이 이슈를 만들어내는지 보려면, Report 아래에 있는 Energy Organizer를 보면 됨

배터리 성능 측정에 대해 더 알아보기
여기서 빨간 막대는 스크롤 경험이 안좋을 수록 표시됨 (렉 걸리는 그 느낌...)

Instruments로 어느 부분이 Hang을 일으키는지 분석할 수 있음

스크롤 경험을 XCTest로 측정할 수 있음
func testScrollingAnimationPerformance() throws {

    app.launch()
    app.staticTexts["Meal Planner"].tap()
    let foodCollection = app.collectionViews.firstMatch

    let measureOptions = XCTMeasureOptions()
    measureOptions.invocationOptions = [.manuallyStop] // 이렇게 지정하면 블록 중간에 stopMeasuring 지정할 수 있음

    measure(metrics: [XCTOSSignpostMetric.scrollDecelerationMetric], // 스크롤 측정
    options: measureOptions) {
        foodCollection.swipeUp(velocity: .fast) // start
        stopMeasuring()
        foodCollection.swipeDown(velocity: .fast) // reset
    }
}
MetricKit을 구성하면 iOS 14에서는 24시간 간격으로 원격 이슈 파악 가능하고

iOS 15에서는 즉시 이슈 파악 가능함...!!!!

func startAnimating() {
	// Mark the beginning of animations
	mxSignpostAnimationIntervalBegin(
		log: MXMetricManager.makeLogHandle(category: "animation_telemetry"),
		name: "custom_animation”)
}

func animationDidComplete() {
	// Mark the end of the animation to receive the collected hitch rate telemetry
	mxSignpost(OSSignpostType.end,
		log: MXMetricManager.makeLogHandle(category: "animation_telemetry"),
		name: "custom_animation")
}
더 알아보기
Understand and eliminate hangs from your app, WWDC21 - https://developer.apple.com/videos/play/wwdc2021/10258/
Instruments 통해서 Disk I/O 확인할 수 있음

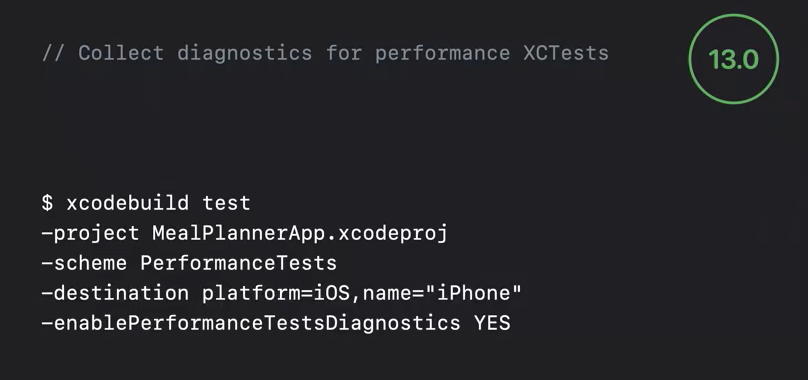
Disk Usage를 XCTest로 측정할 수 있음
baseline를 설정해서 그것보다 퍼포먼스가 안나오면 테스트 실패되게 만들 수 있음
// Example performance XCTest

func testSaveMeal() {
	let app = XCUIApplication()
	let options = XCTMeasureOptions()
	options.invocationOptions = [.manuallyStart]

	measure(metrics: [XCTStorageMetric(application: app)], options: options) {
		app.launch()
		startMeasuring()

		let firstCell = app.cells.firstMatch
		firstCell.buttons["Save meal"].firstMatch.tap()

		let savedButton = firstCell.buttons["Saved"].firstMatch
		XCTAssertTrue(savedButton.waitForExistence(timeout: 2))
	}
}
이미 출시된 버전은 Organizer를 통해 확인 가능

Report 섹션 아래의 Disk Writes
앱이 24시간 내에 1GB 이상 디스크 쓰기를 하면 Report

Xcode13 에서는 어떻게 고쳐야할지 Insights 를 제공함.

Disk Write 이슈 더 알아보기:
Diagnose power and performance regressions in your app, WWDC21 - https://developer.apple.com/videos/play/wwdc2021/10087/
Organizer > Launch time

Organizer > Termination

Instruments > App Launch

앞서 본 것 처럼 XCTest를 활용할 수도 있음
MetricKit이 앱에 구현되어 있으면 daily metric payload로 매일 받아볼 수 있음
왜 앱이 종료되는지 자세히 확인하고 싶다면?
Why is my app getting killed?, WWDC 20 - https://developer.apple.com/videos/play/wwdc2020/10078/
Organizer > Memory

Instruments > Leaks, Allocations, VM Tracker

MetricKit
// Collect memory telemetry

func saveAppAssets() {
	mxSignpost(OSSignpostType.begin,
		log: MXMetricManager.makeLogHandle(category: "memory_telemetry"),
		name: "custom_memory")

	// save app metadata

	mxSignpost(OSSignpostType.end,
		log: MXMetricManager.makeLogHandle(category: "memory_telemetry"),
		name: "custom_memory")
}
더 알아보기:
Detect and diagnose memory issues #36
https://developer.apple.com/videos/play/wwdc2021/10180/


https://developer.apple.com/videos/play/wwdc2021/10256/
FilePath


작년에 Float16 타입 도입되었는데, 이번에 Apple Silicon에 Float16에도 추가됨.
Complex: 로그, 사인, 코사인 표현 가능
이런거 보면 Swift로 만든 스크립트 작성이 편할 듯


문서화 제대로 지원 가능
interactive
오픈소스로 공개 예정

이제는 이런 에러들 없음!


간편하게 Codable 구현 가능
Protocol에 static var로 확장해두면 사용하는 곳에서 간편하게 사용 가능.

파라미터로 사용 가능!


https://developer.apple.com/videos/play/wwdc2021/10018/


제어 흐름이 위에서 아래로 흘러서 이해하기 쉬움


async 키워드 하나면 가능

여러 스레드에서 동작하면 이슈가 됨

actor를 사용하면 스레드 이슈가 없어짐

await 쓸때 일반적으로 필요하다는 뜻

async/await 도 잘 동작함
actor는 클래스와 같이 reference type임
하지만 멀티 스레드에서 안전하게 사용할 수 있도록 규칙이 적용됨
Protect mutable state with Swift actors
전처리작업에서 isIPad 등록해서 사용하는 것 보다 SizeClass 이용해서 아이템 개수를 선택할 수 있게 하면 어떨까
Auto Resizing Mask 는 어떻게 사용하는게 좋을까?
기본값으로는 어떻게 설정되어 있을까?
Custom Transition 이용하면 드래그해서 종료 가능한 모달을 만들 수 있을 것 같다.
프로토콜 형태로 만들어서 어떤 VC 이라도 사용가능하게 지원해보면 어떨까?
UICollectionView Prefetching 과정 볼 수있는 view 만들기
https://developer.apple.com/documentation/uikit/uicollectionviewdatasourceprefetching/prefetching_collection_view_data 참고
Prefetching 안한 버전
Prefetching 한 버전
Prefecthing시에 Unsplash 같은데서 이미지 가져온 다음 보여주는 방식으로 만들면 좋을 듯.
https://github.com/TaeJoongYoon/FlickrSearch 참고
2, 3번 수치로 비교할 수 있으면 좋겠다. 어떤식으로 비교할 수 있을까?
https://developer.apple.com/videos/play/wwdc2021/10180/
사용자 경험을 극대화하기 위해서!
근데 이건 도대체 뭘까?! Dirty + Compressed memory!!

더 알아보기: iOS Memory Deep Dive - https://developer.apple.com/wwdc18/416

// Monitor memory performance with XCTests

func testSaveMeal() {
    let app = XCUIApplication()

    let options = XCTMeasureOptions()
    options.invocationOptions = [.manuallyStart]

    measure(metrics: [XCTMemoryMetric(application: app)], // 타겟 앱 지정
            options: options) {

        app.launch()

        startMeasuring() // ⏱ 측정 시작!

        app.cells.firstMatch.buttons["Save meal"].firstMatch.tap()

        let savedButton = app.cells.firstMatch.buttons["Saved"].firstMatch
        XCTAssertTrue(savedButton.waitForExistence(timeout: 30)) // 측정을 위해 30초 기다림
    }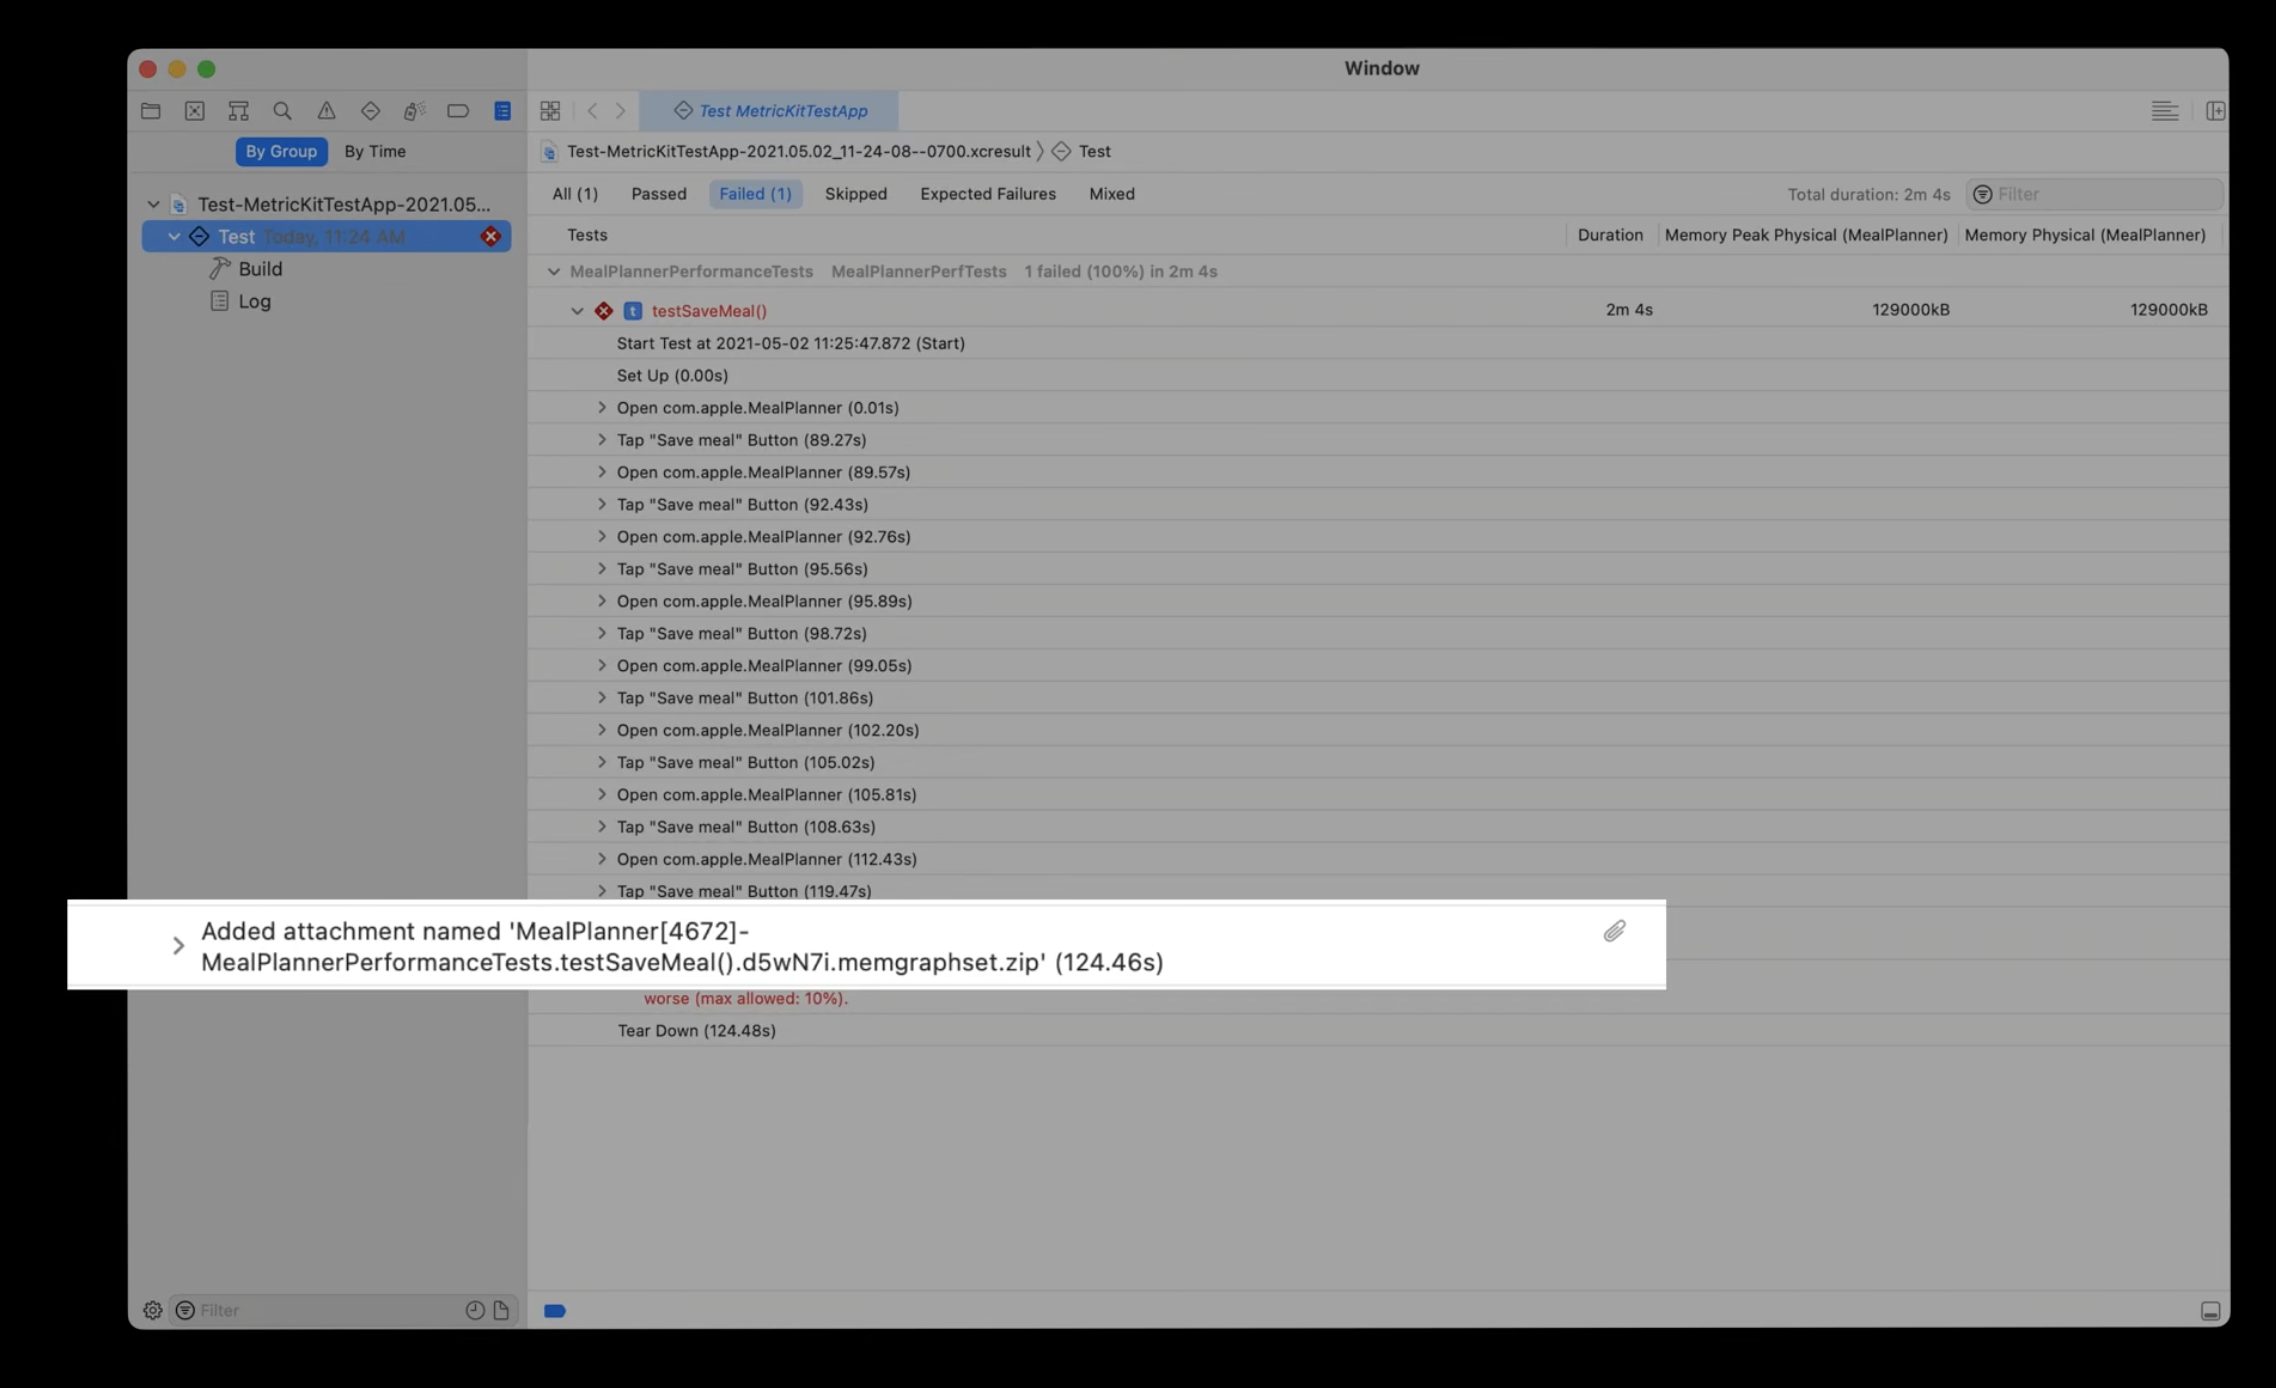
}그러고 나면 테스트 옆에 회색 다이아몬드를 눌러서 결과를 확인할 수 있음


평균 값을 baseline으로 지정할 수 있음 -> 다음 테스트와 비교할 수 있음

baseline 보다 높게 나올 경우 테스트 페일됨. 이 지표는 언제 멈추고 코드를 수정해야할지 알려줌.
baseline 부터의 편차를 regression 이라고 부름.

앞서 나온 regression 분석을 위한 새로운 도구가 나왔음
Ktrace files, Memory graphs.

Ktrace files: 일반적인 시스템 조사, 렌더링 파이프라인 파악, 메인 쓰레드 행 걸리는 이유 분석 등 다양하게 쓸 수 있음

Visual debugger로 볼 수도 있지만 command line 으로도 확인할 수 있음

아직 뭔지 잘 모르겠음...ㅠ command line 에서 이렇게 활성화 시킬 수 있음.
이렇게 해두면 nonmemroy metric에 대한 ktrace collection과 memory metrc에 대한 memgrph를 사용할 수 있다.
콘솔에 출력는게 많은데 그 중에 주목할 것들은...

예제에서는 퍼포먼스 baseline 기준을 넘지 못했음
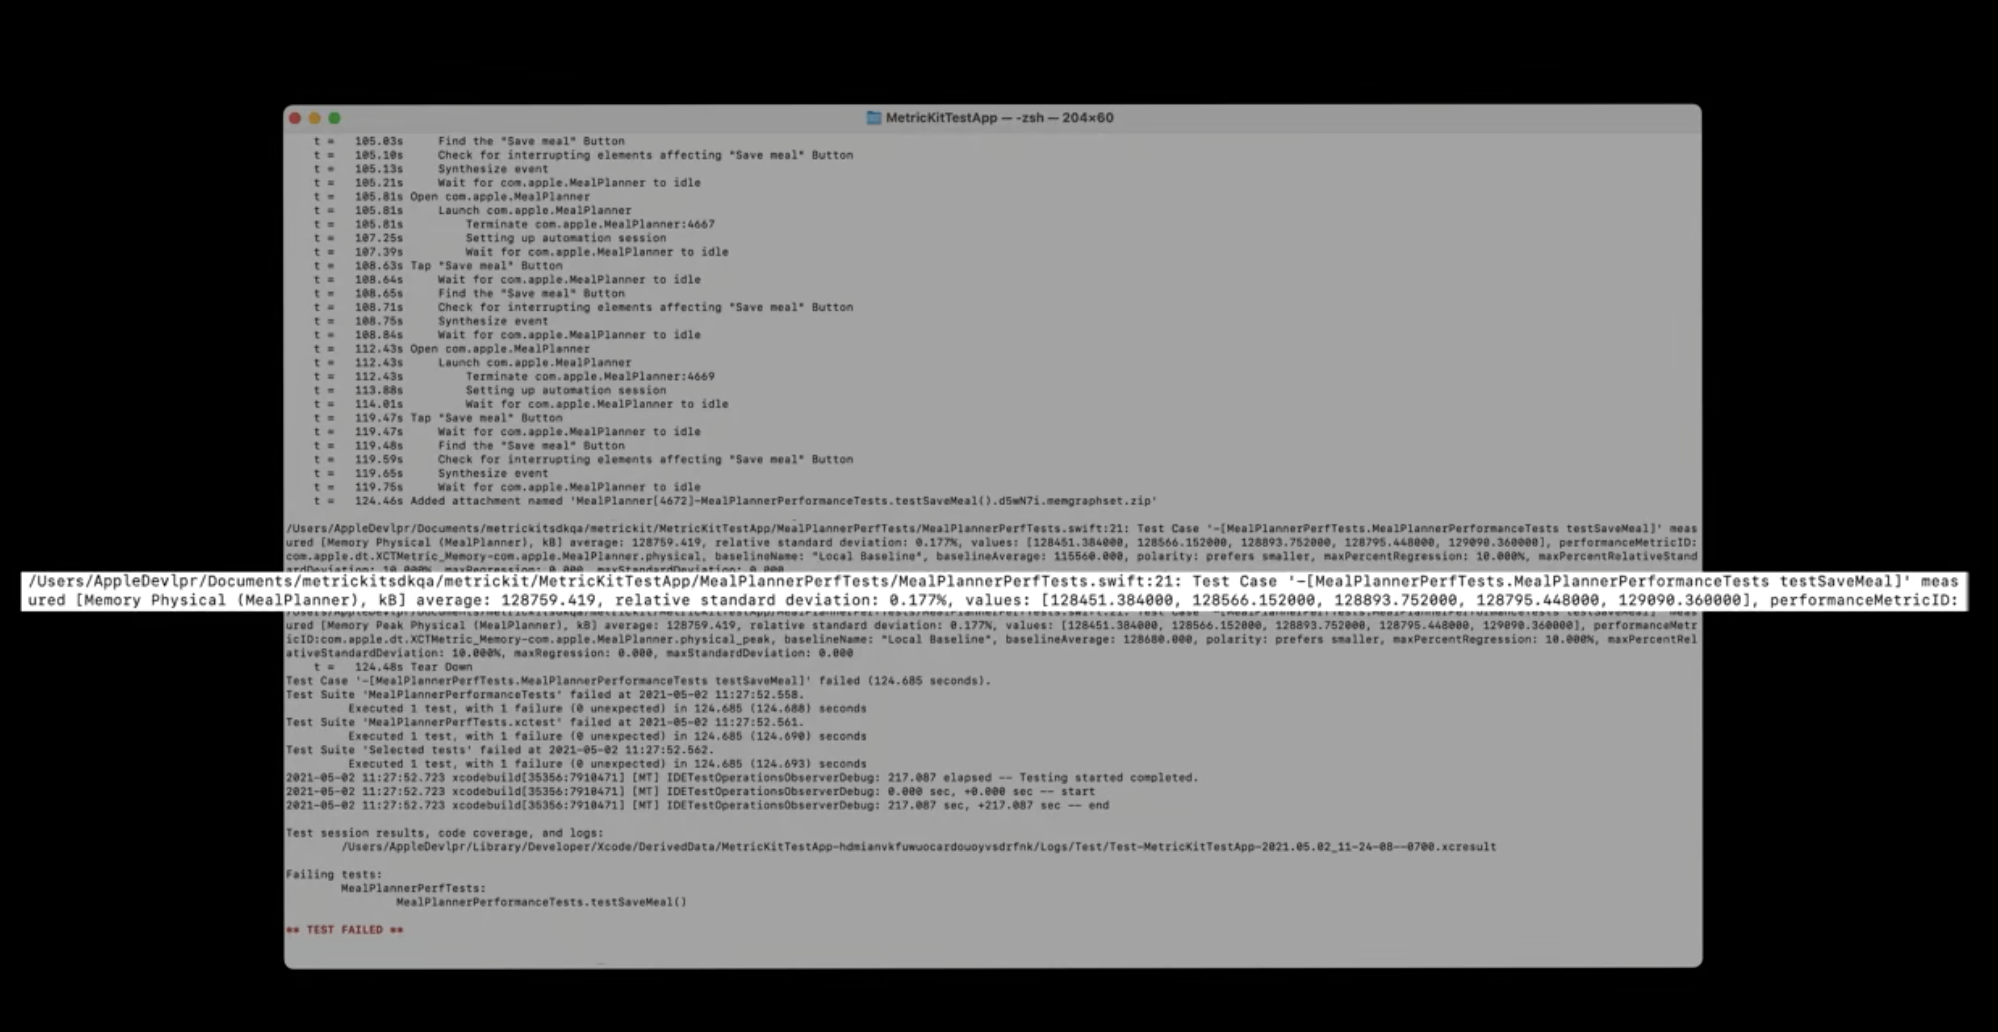

첨부된 memgraph가 있음!

자 이렇게 추출한 파일을 보고 메모리 이슈를 분석해봅시다
Leak, Heap size issue 이슈를 살펴봄
Command line tool로 메모리 분석하는 거 더 찾아보려면...
iOS Memory Deep Dive - https://developer.apple.com/wwdc18/416
객체를 allocate 하고 deallocate 하지 않은 채로 모든 reference를 잃어버리면 발생함


몇개의 leak이 발생했는지 분석해줌. 아래에는 좀 더 자세한 callstack이 나와있음
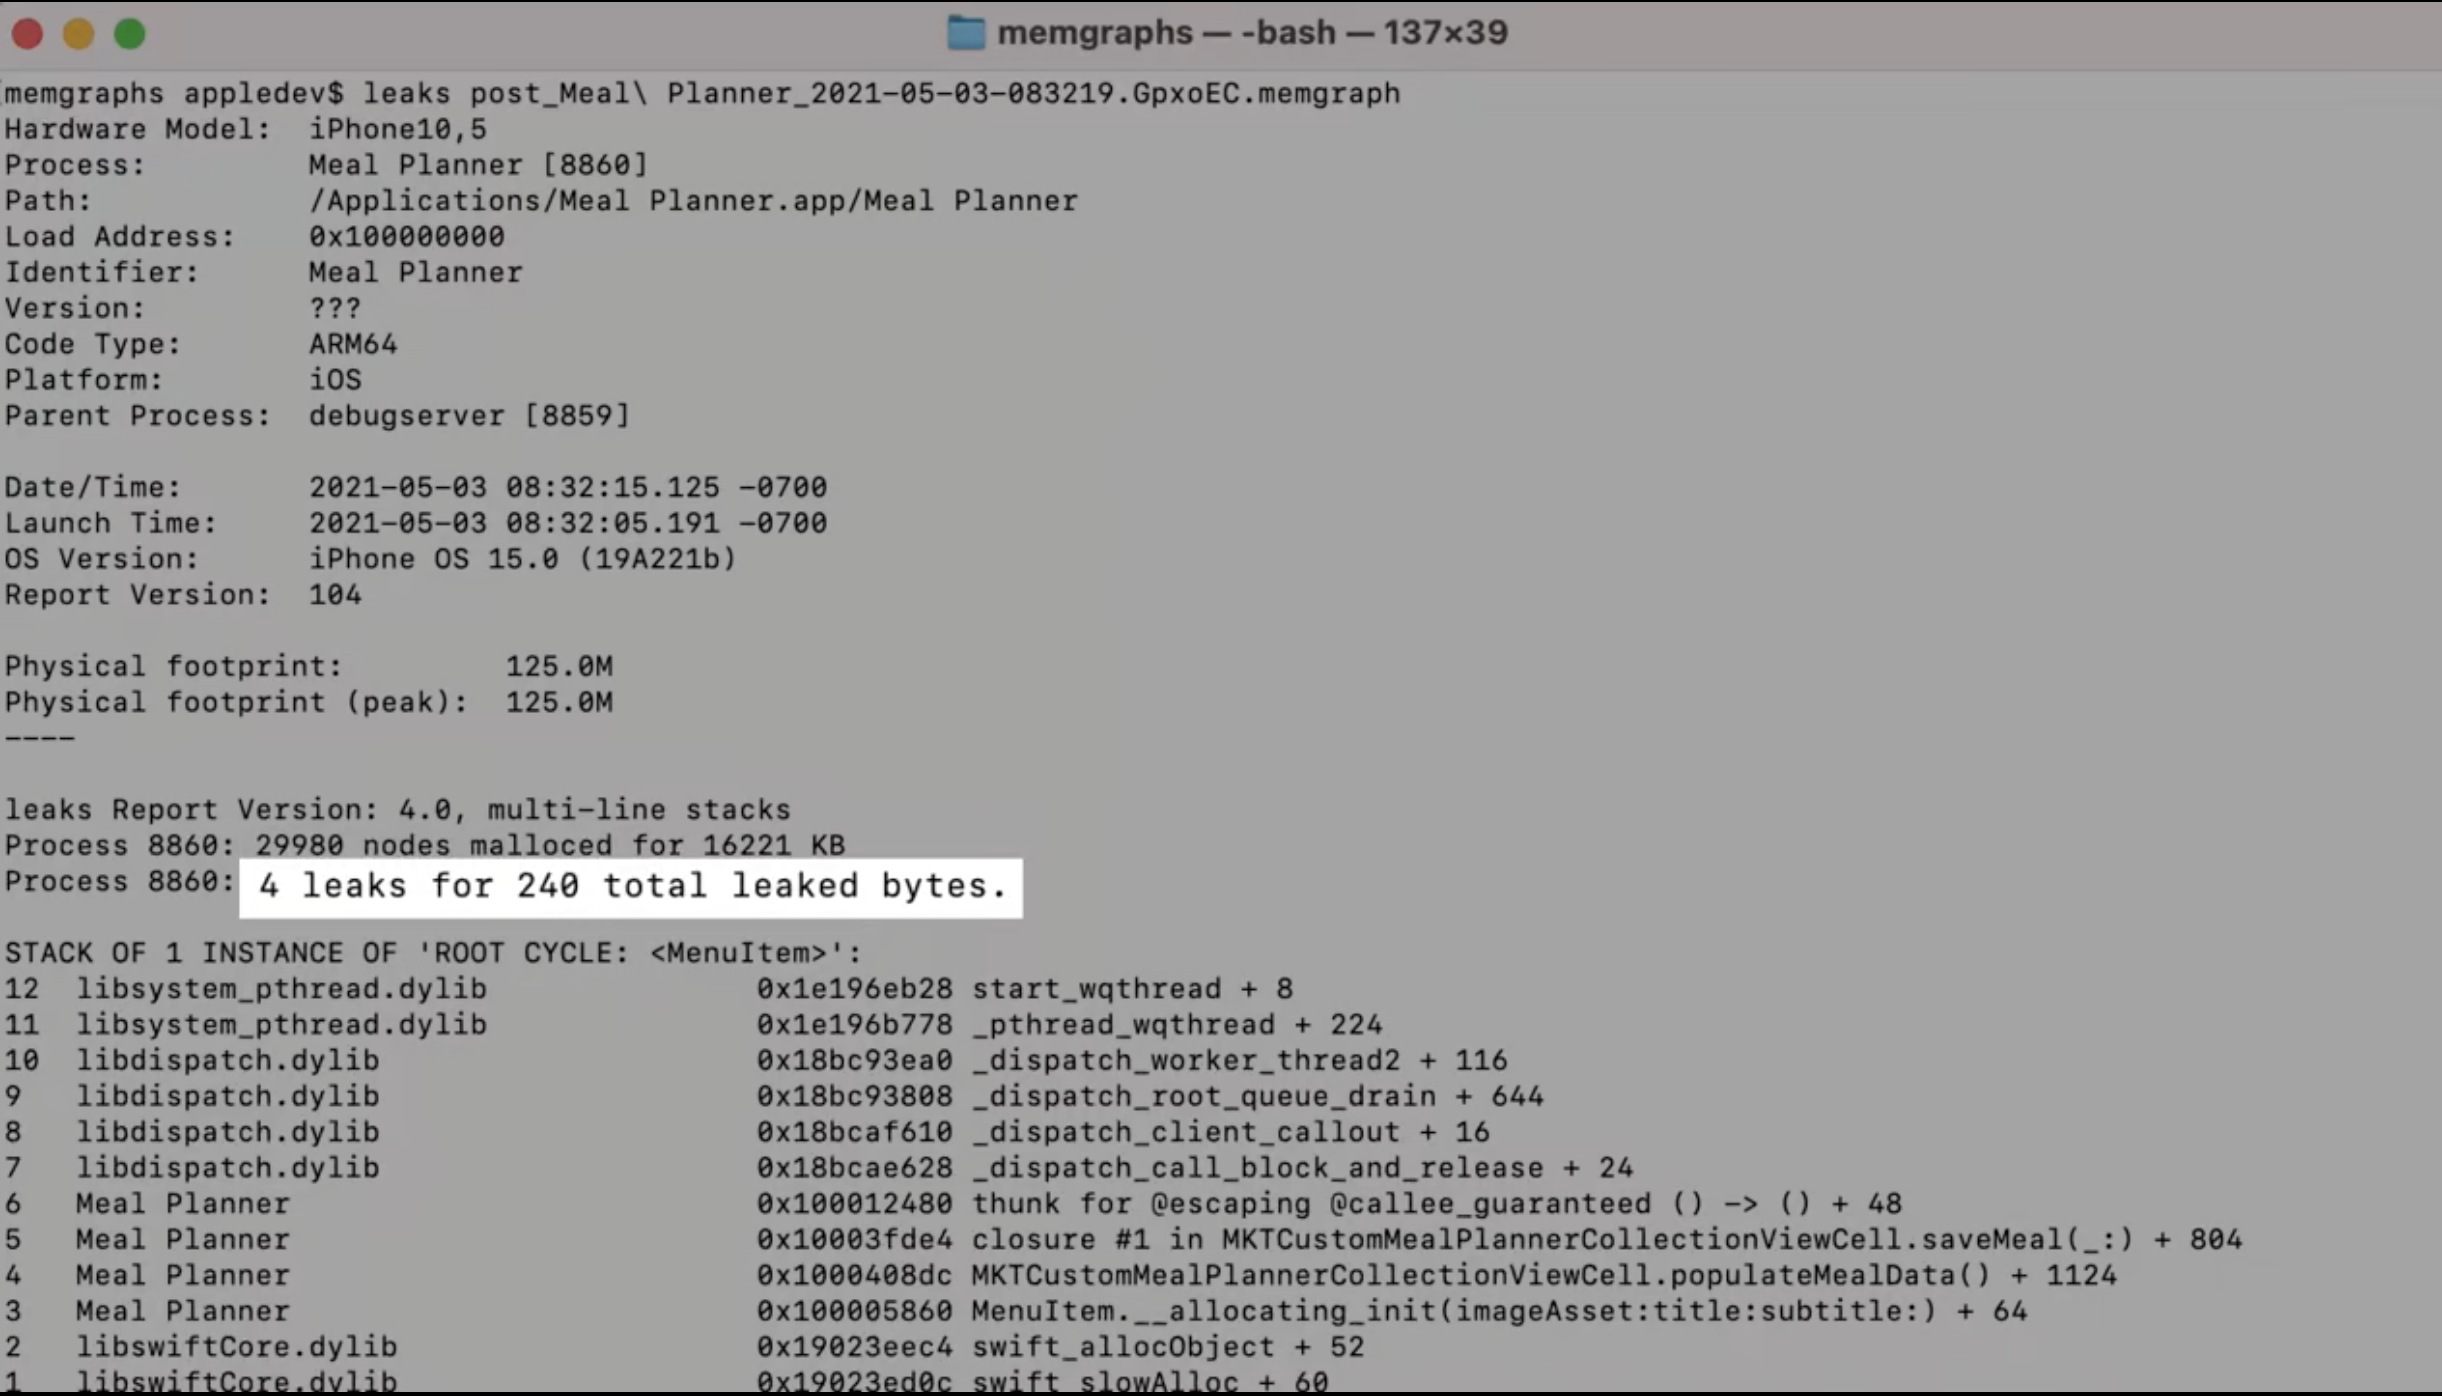
우리 앱에 있는 심볼을 발견할 때가 있음

코드를 들어가보면 서로 참조 하고 있음 :)
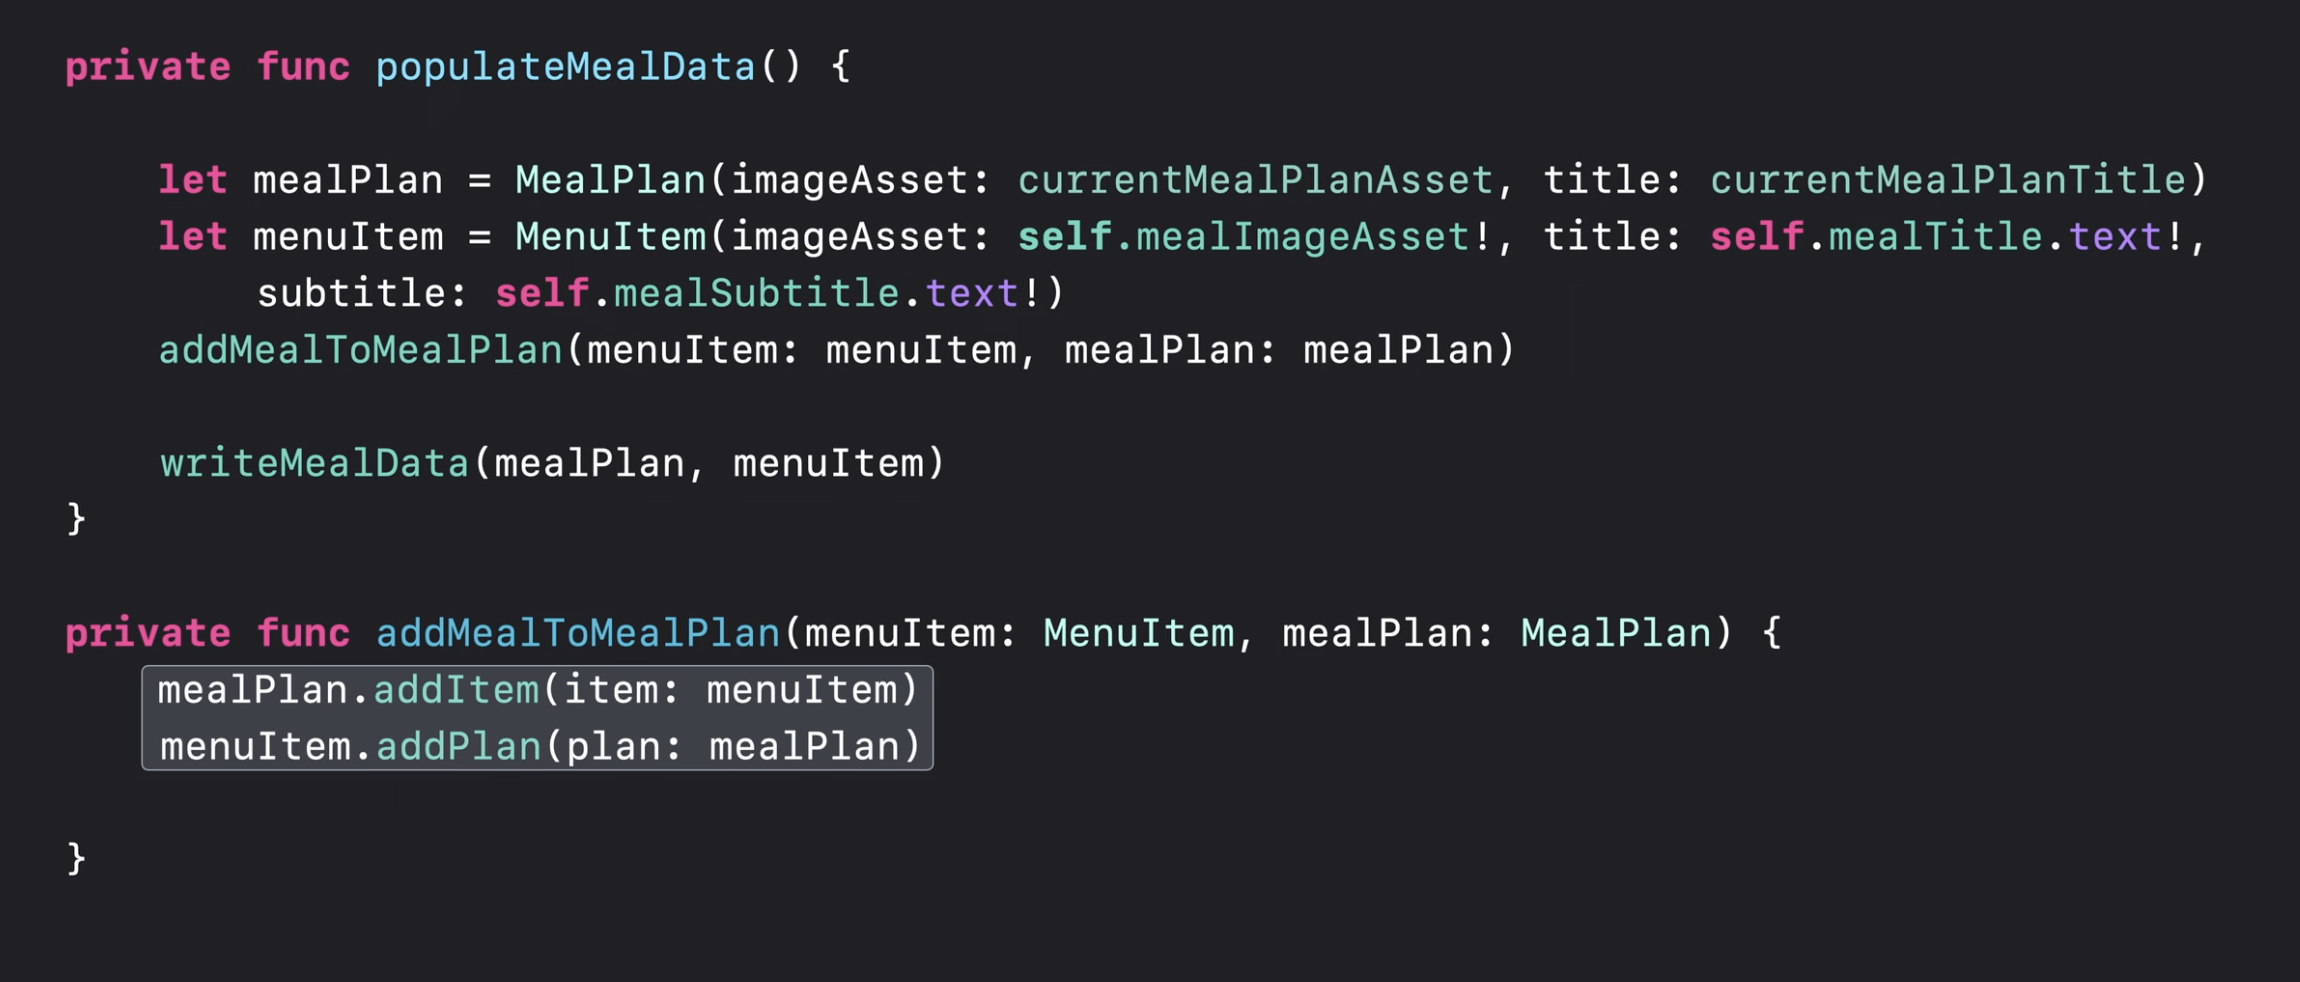
한쪽을 weak으로 바꿔주기
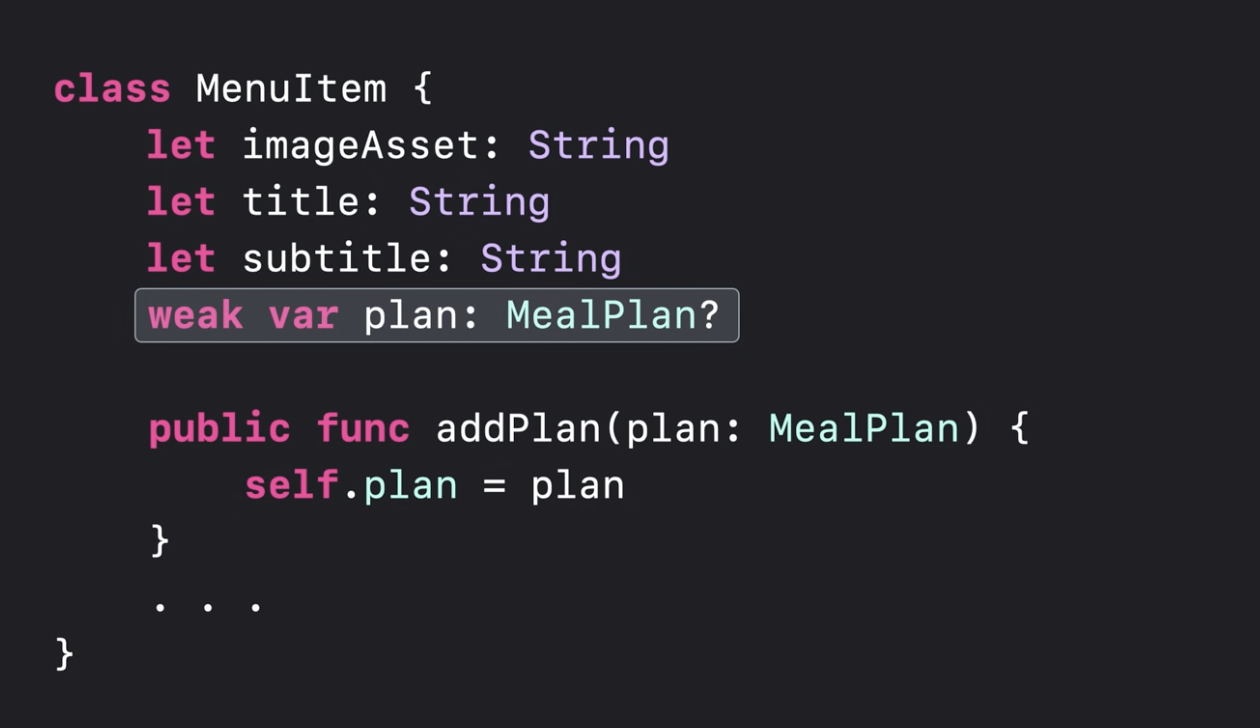
(뭔가 엄청난 가이드가 나올줄 알았는데 별건 아니었음...)
힙 공간에 이전보다 많은 메모리를 할당하는 이슈
실패한 XCTest로 돌아가서 살펴보자
어디를 봐야할지 확인하기 위해서 vmmap -summary 를 입력해봄.
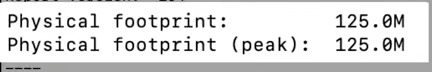
pre memgraph랑 post memgraph를 비교

13 MB 차이가 남!

스크롤을 좀 더 내려봄.
프로세스의 메모리 사용이 region 별로 나눠져 있음
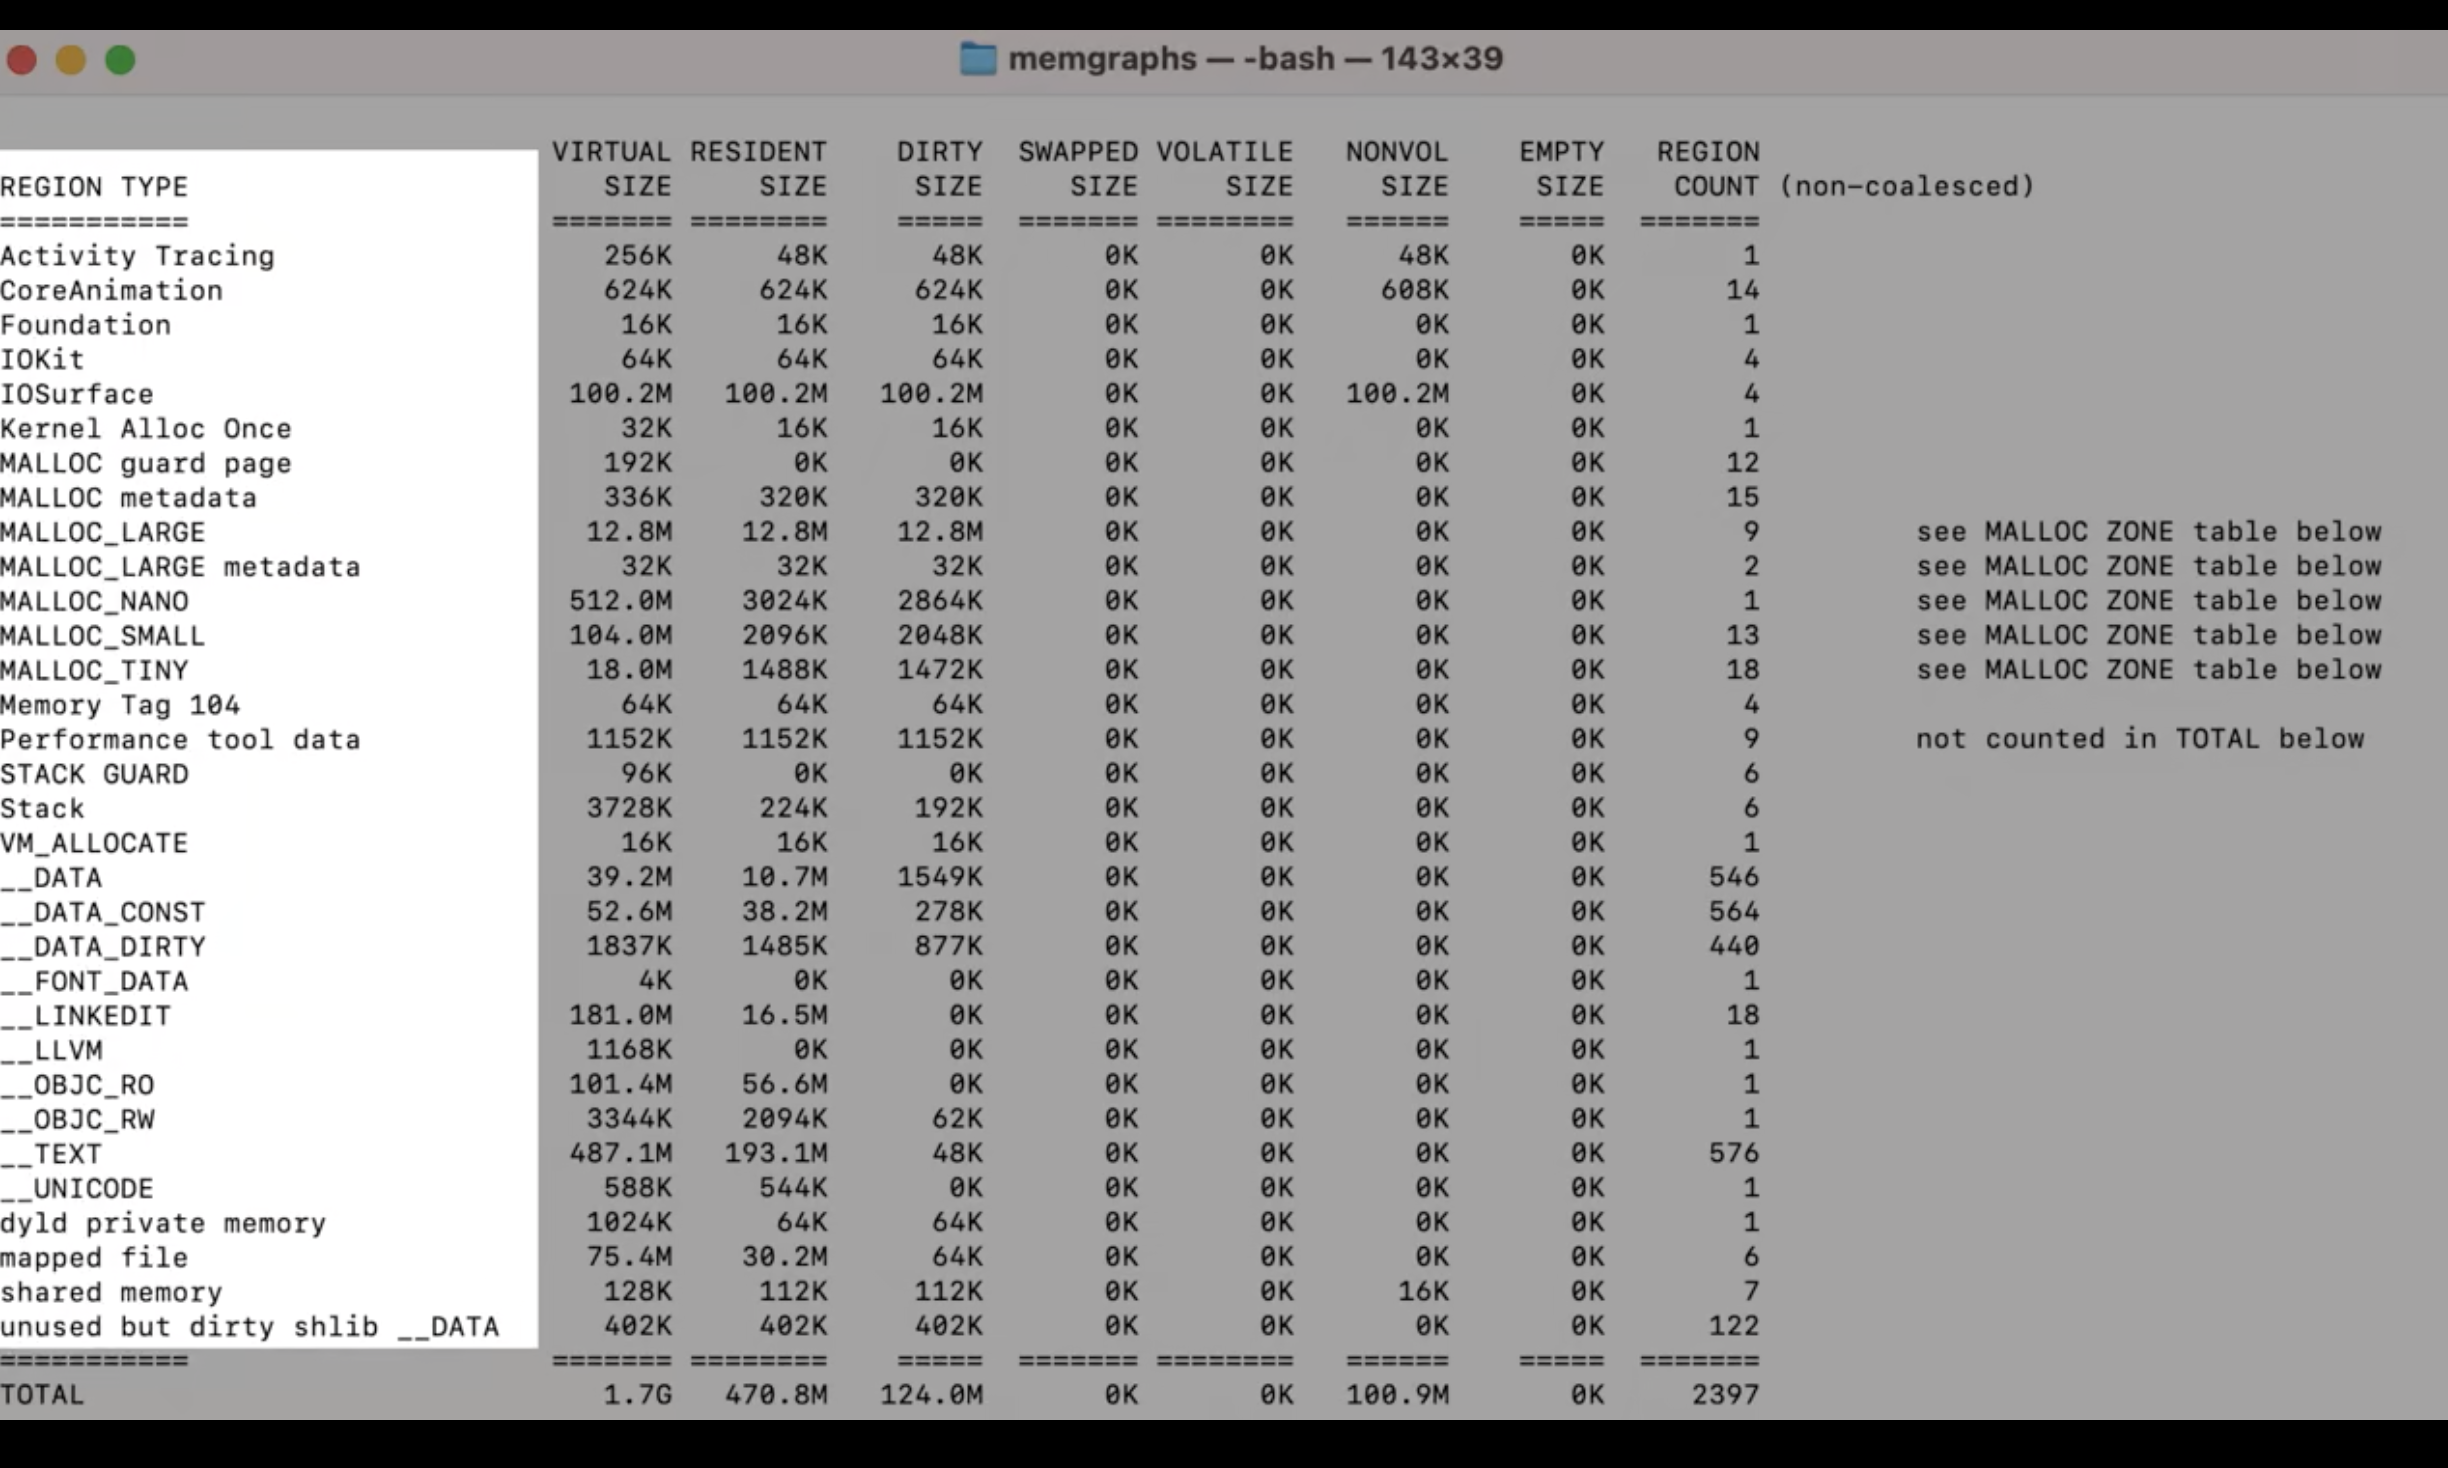
Heap allocation issue 라고 추정되기 떄문에 MALLOC_ region을 살펴보겠음
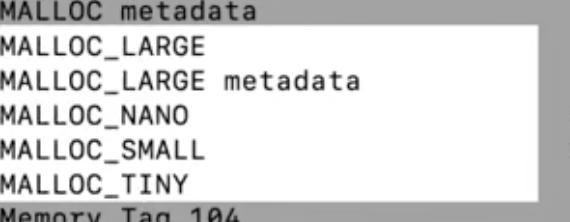
앞에 나왔던 설명 돌아보면
memory footprint = dirty memory + compressed memory 니까, 아래의 두 열을 보면됨.
(compressed = swapped 같은 의미)
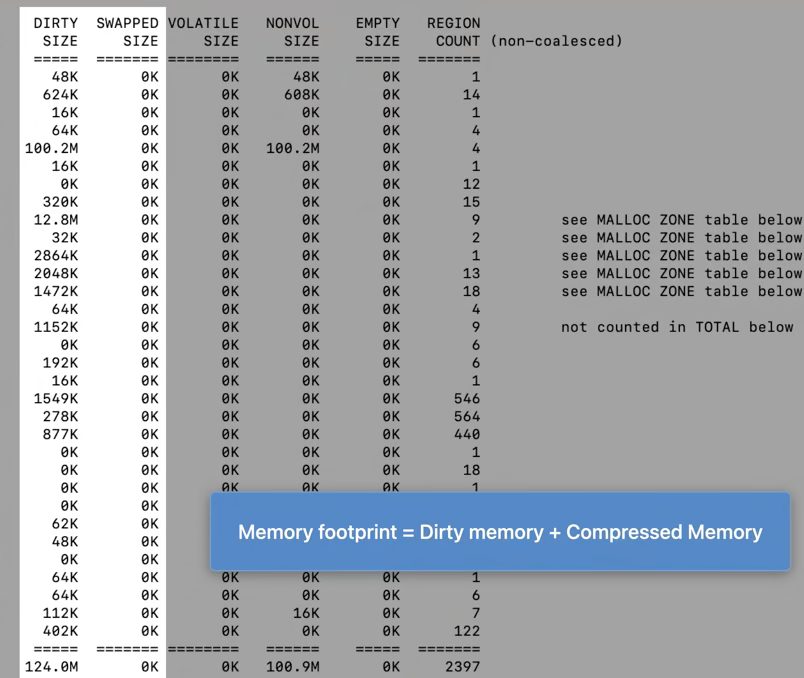
MALLOC_LARGE region에 대략 13 MB의 dirty memory가 있음 = 아주 강한 의심이 간다

어떤 object가 관여하는지 더 정확하게 파악해보자
heap -diffFrom 을 실행!

post 에는 있지만 pre memgraph 에는 없는 것들이 출력됨
좀 내려보면 메모리를 object 단위로 나눠놓은게 있음.
object의 개수, bytes 볼 수 있음
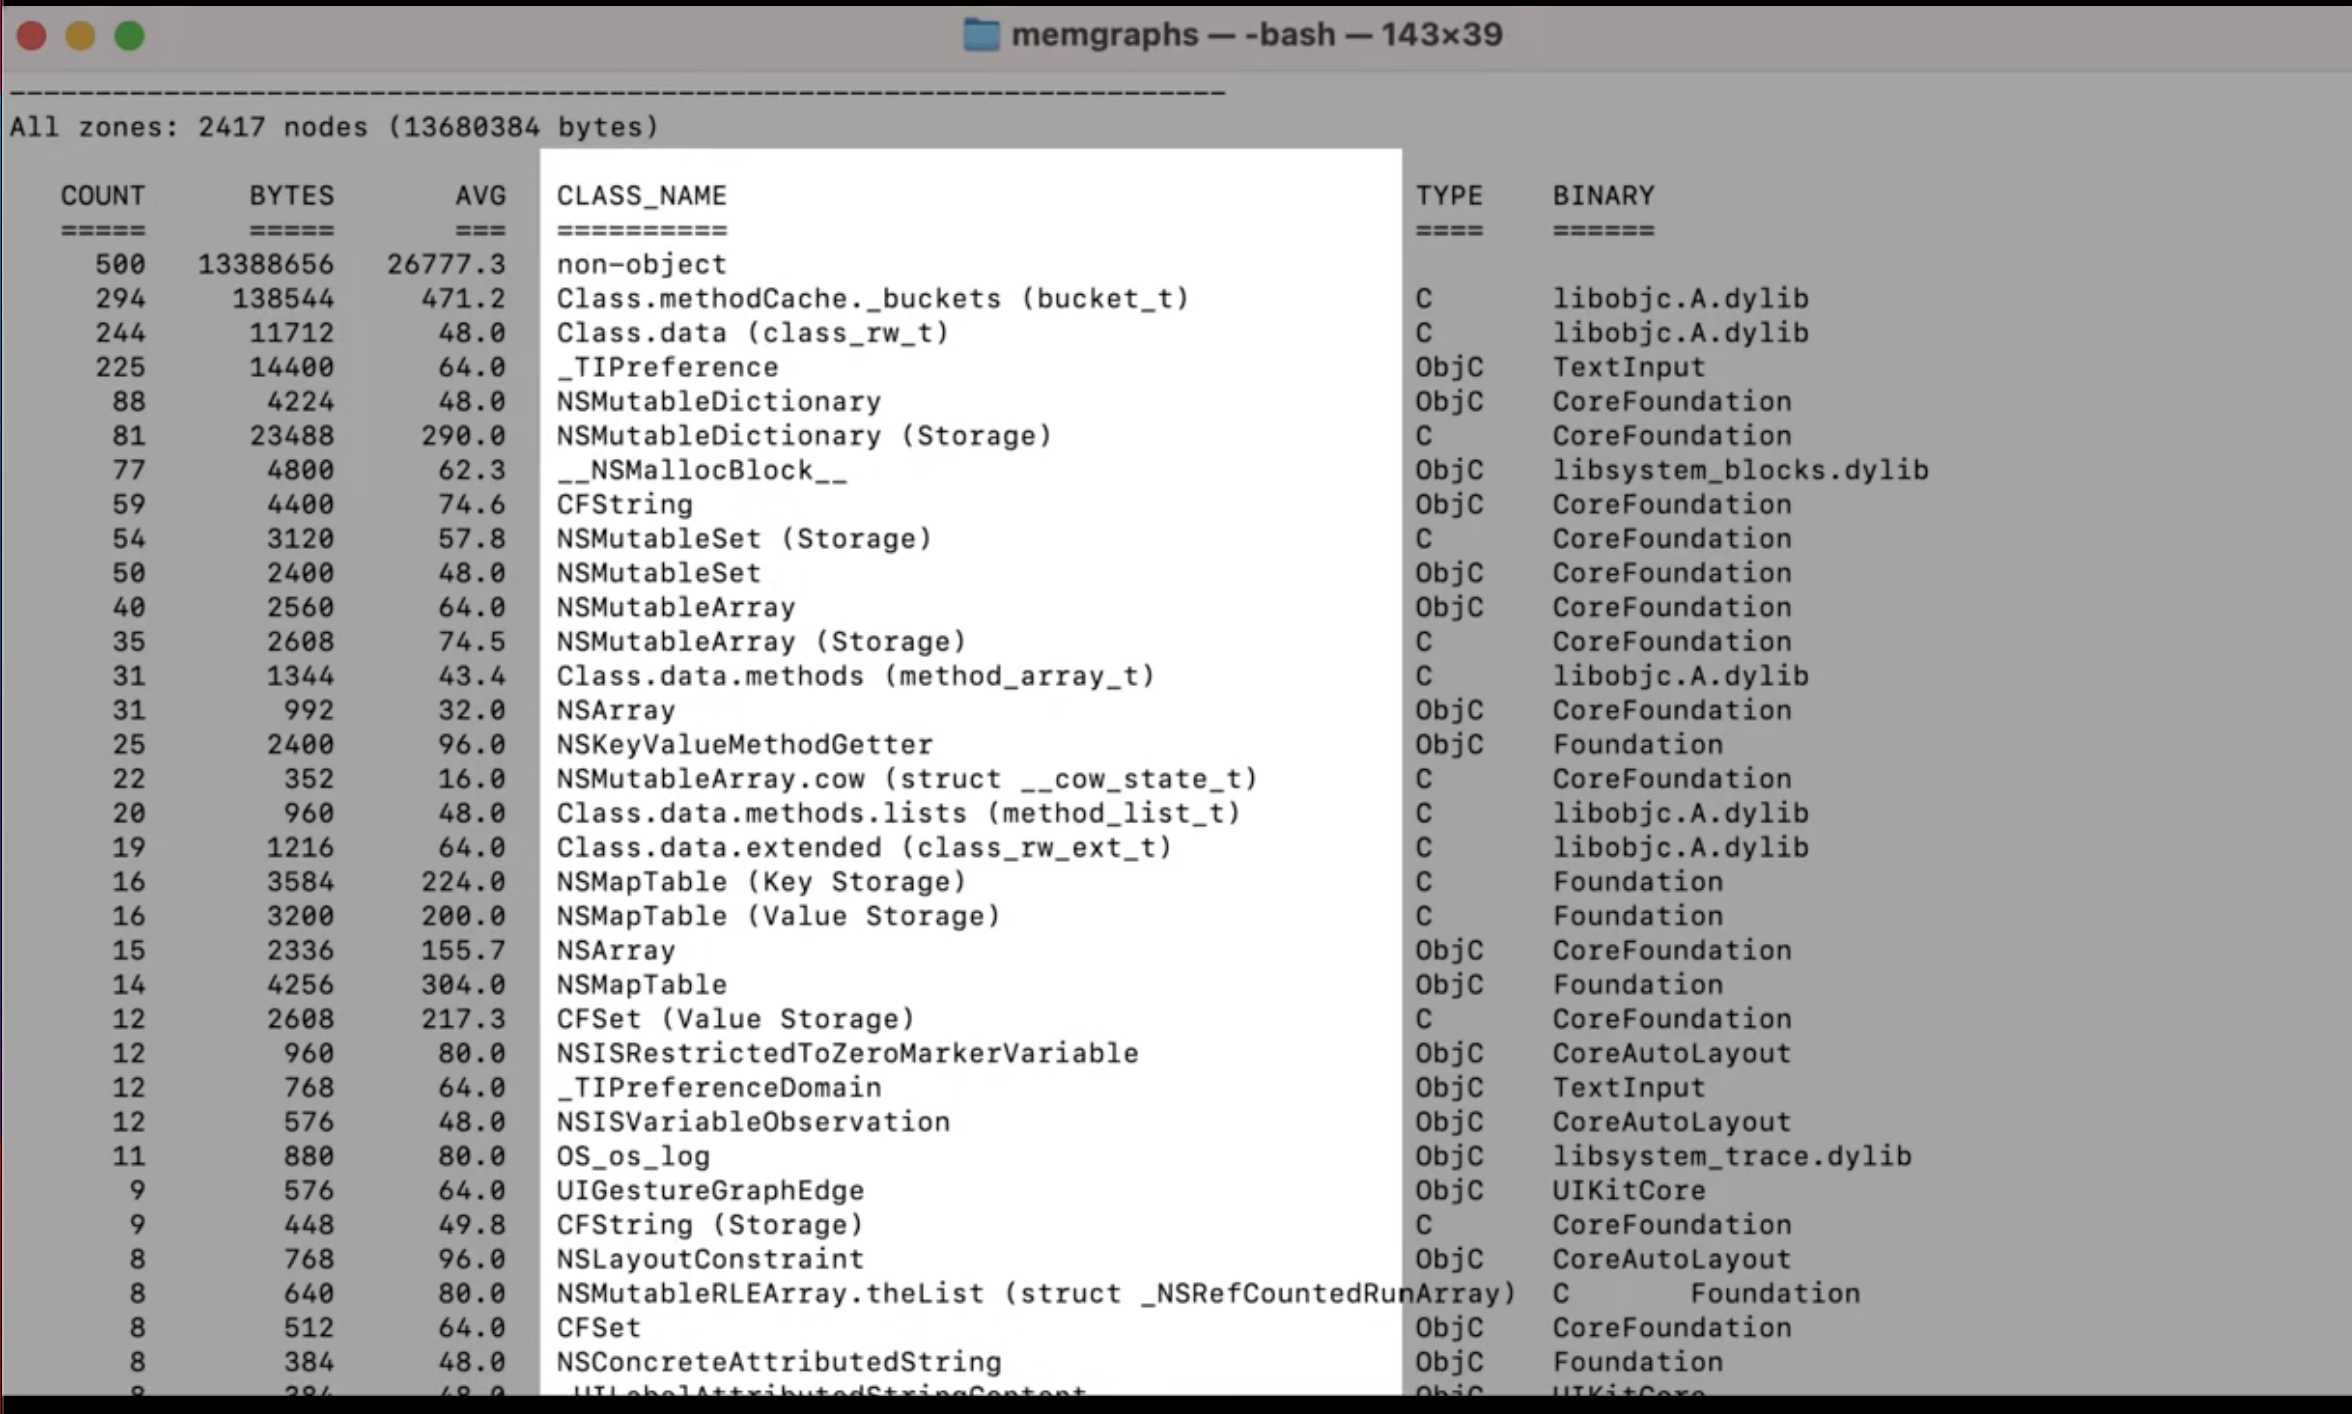
맨 위에 non-object가 13 MB 정도 차지하는 것을 볼 수 있음ㅠ
Swift에서 주로 raw malloced bytes를 의미함 (뭐지...?)
non-object가 뭔지 파악하는 방법도 있음!!
heap -address 명령어를 입력해서 분석. 최소 500kb의 non-object만 찾도록 지정

유력한 용의자... 이 주소값을 가지고 다시 찾아보자

몇 가지 방법이 있음
leaks --traceTree특정 객체에 대한 정보는 없고 주소값만 있을 때 사용해 볼 수 있음
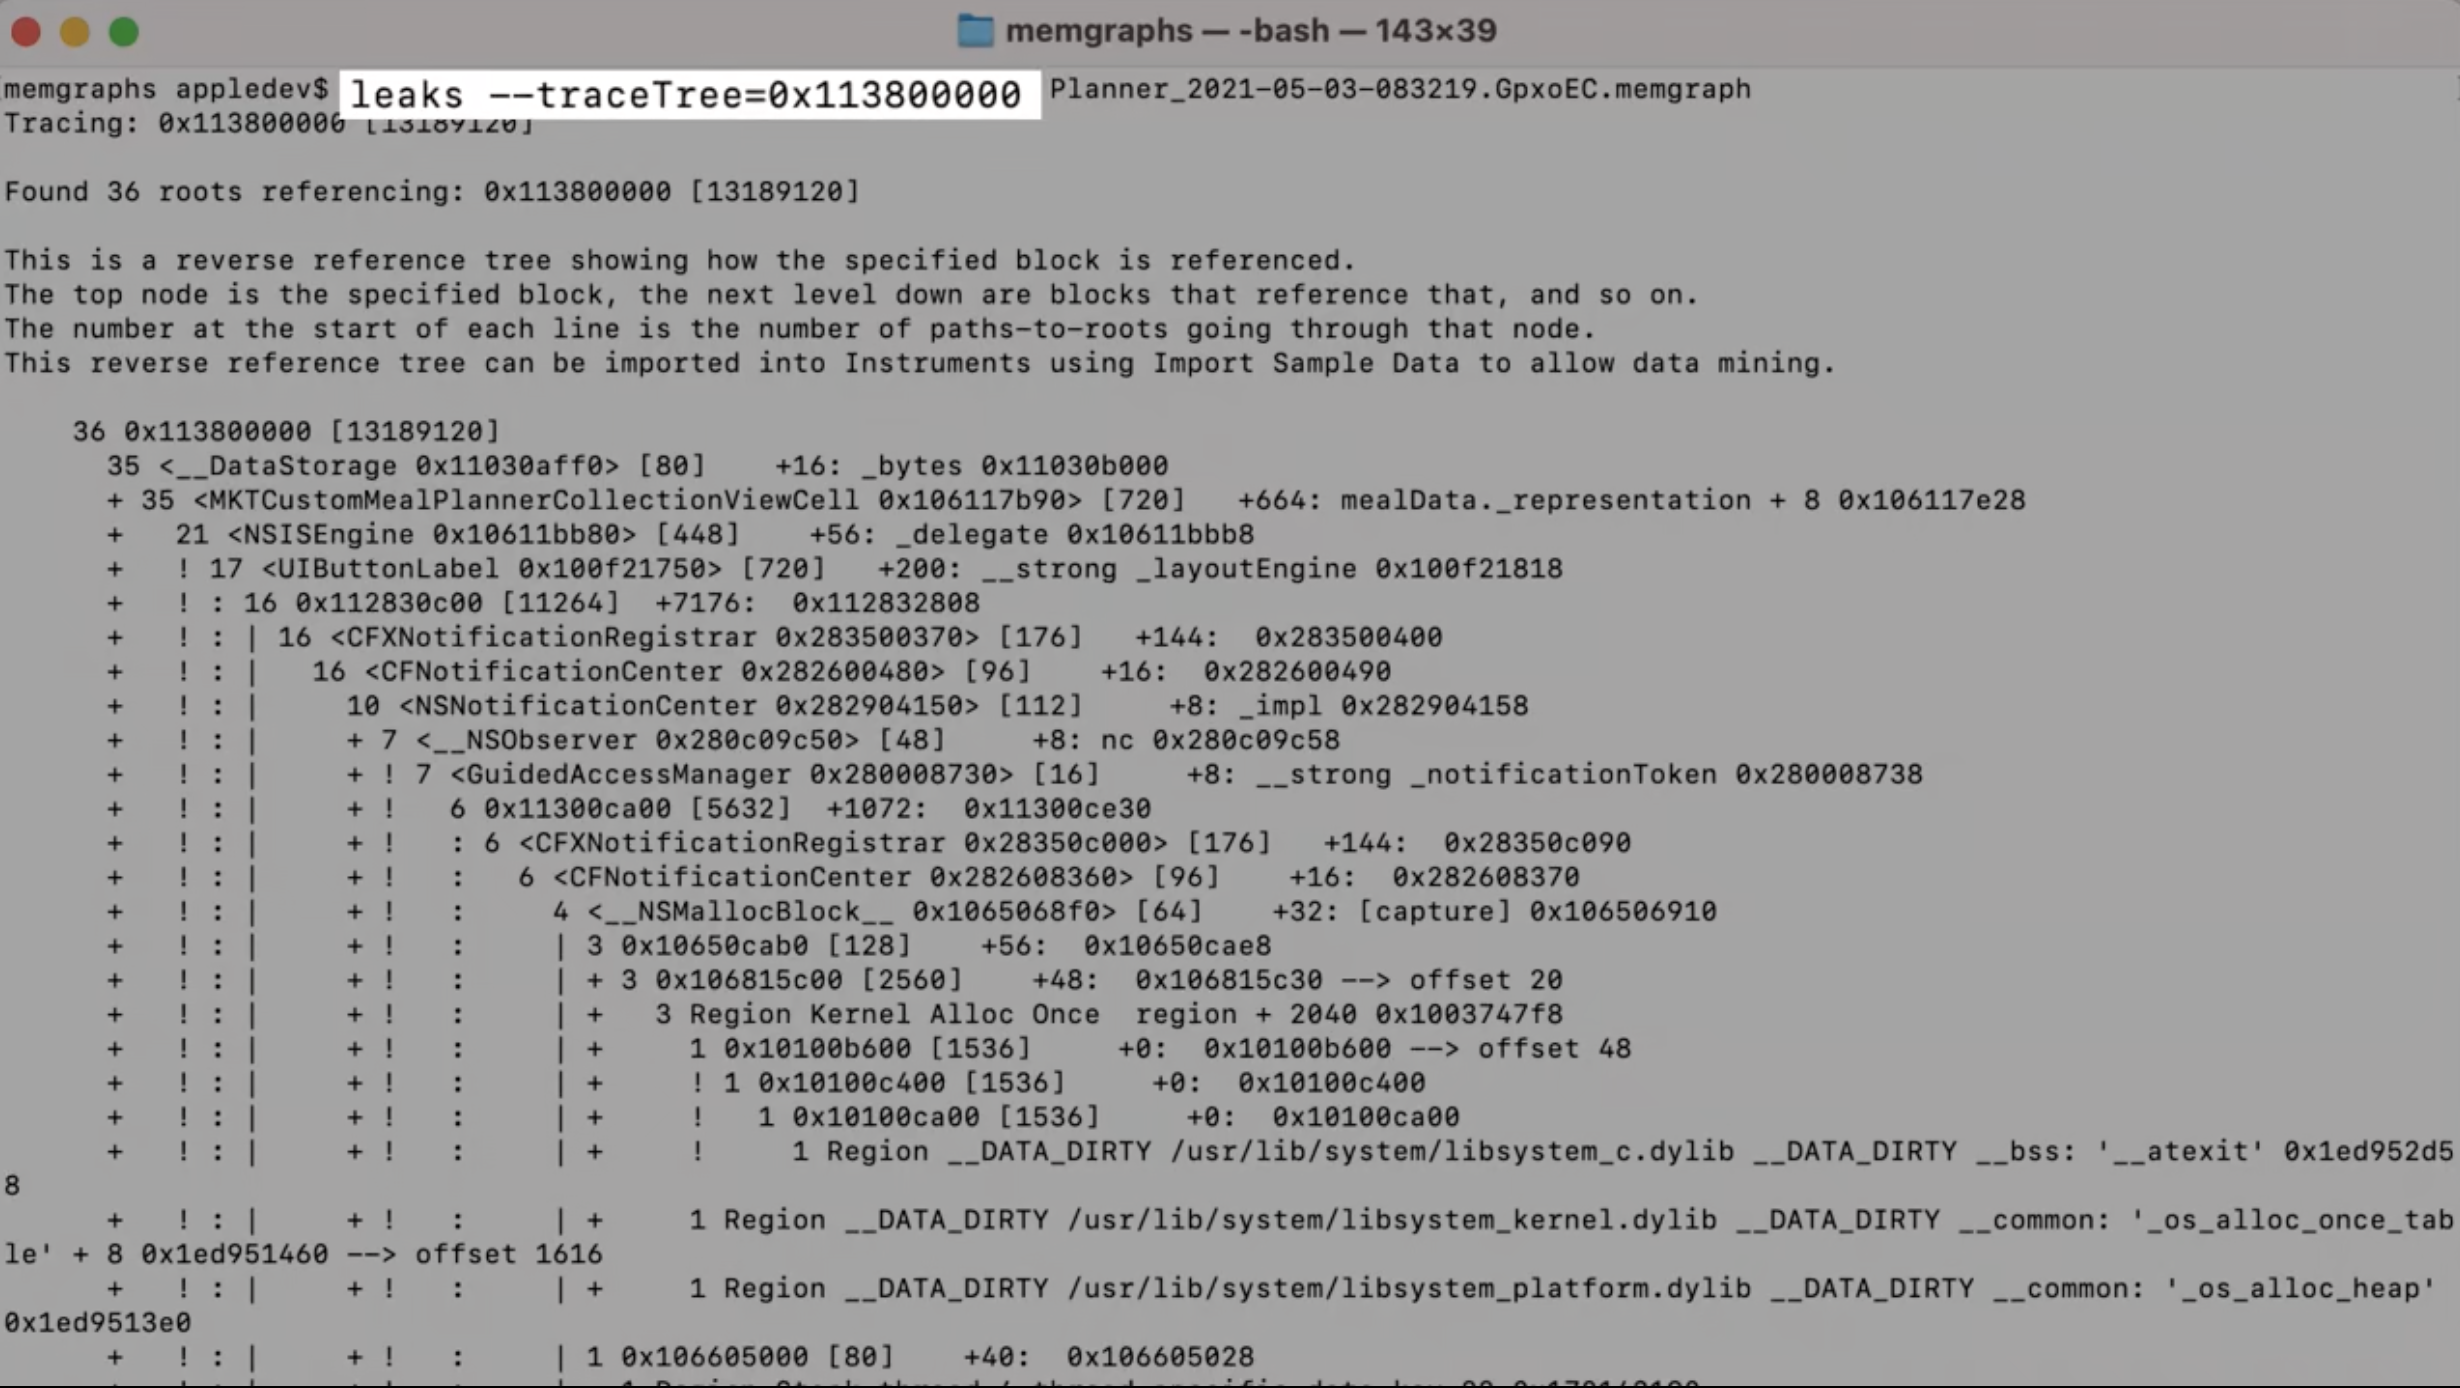
아마도 MKTCustomMeal PlannerCollectionViewCell 과 관련이 있어보임
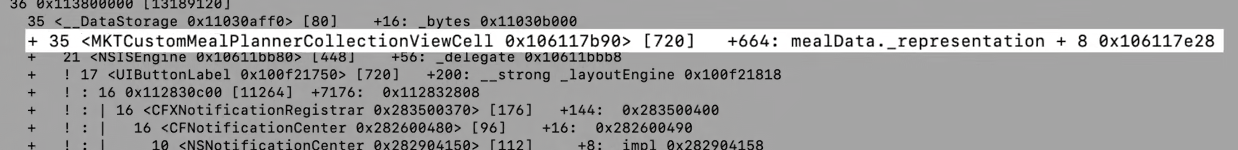
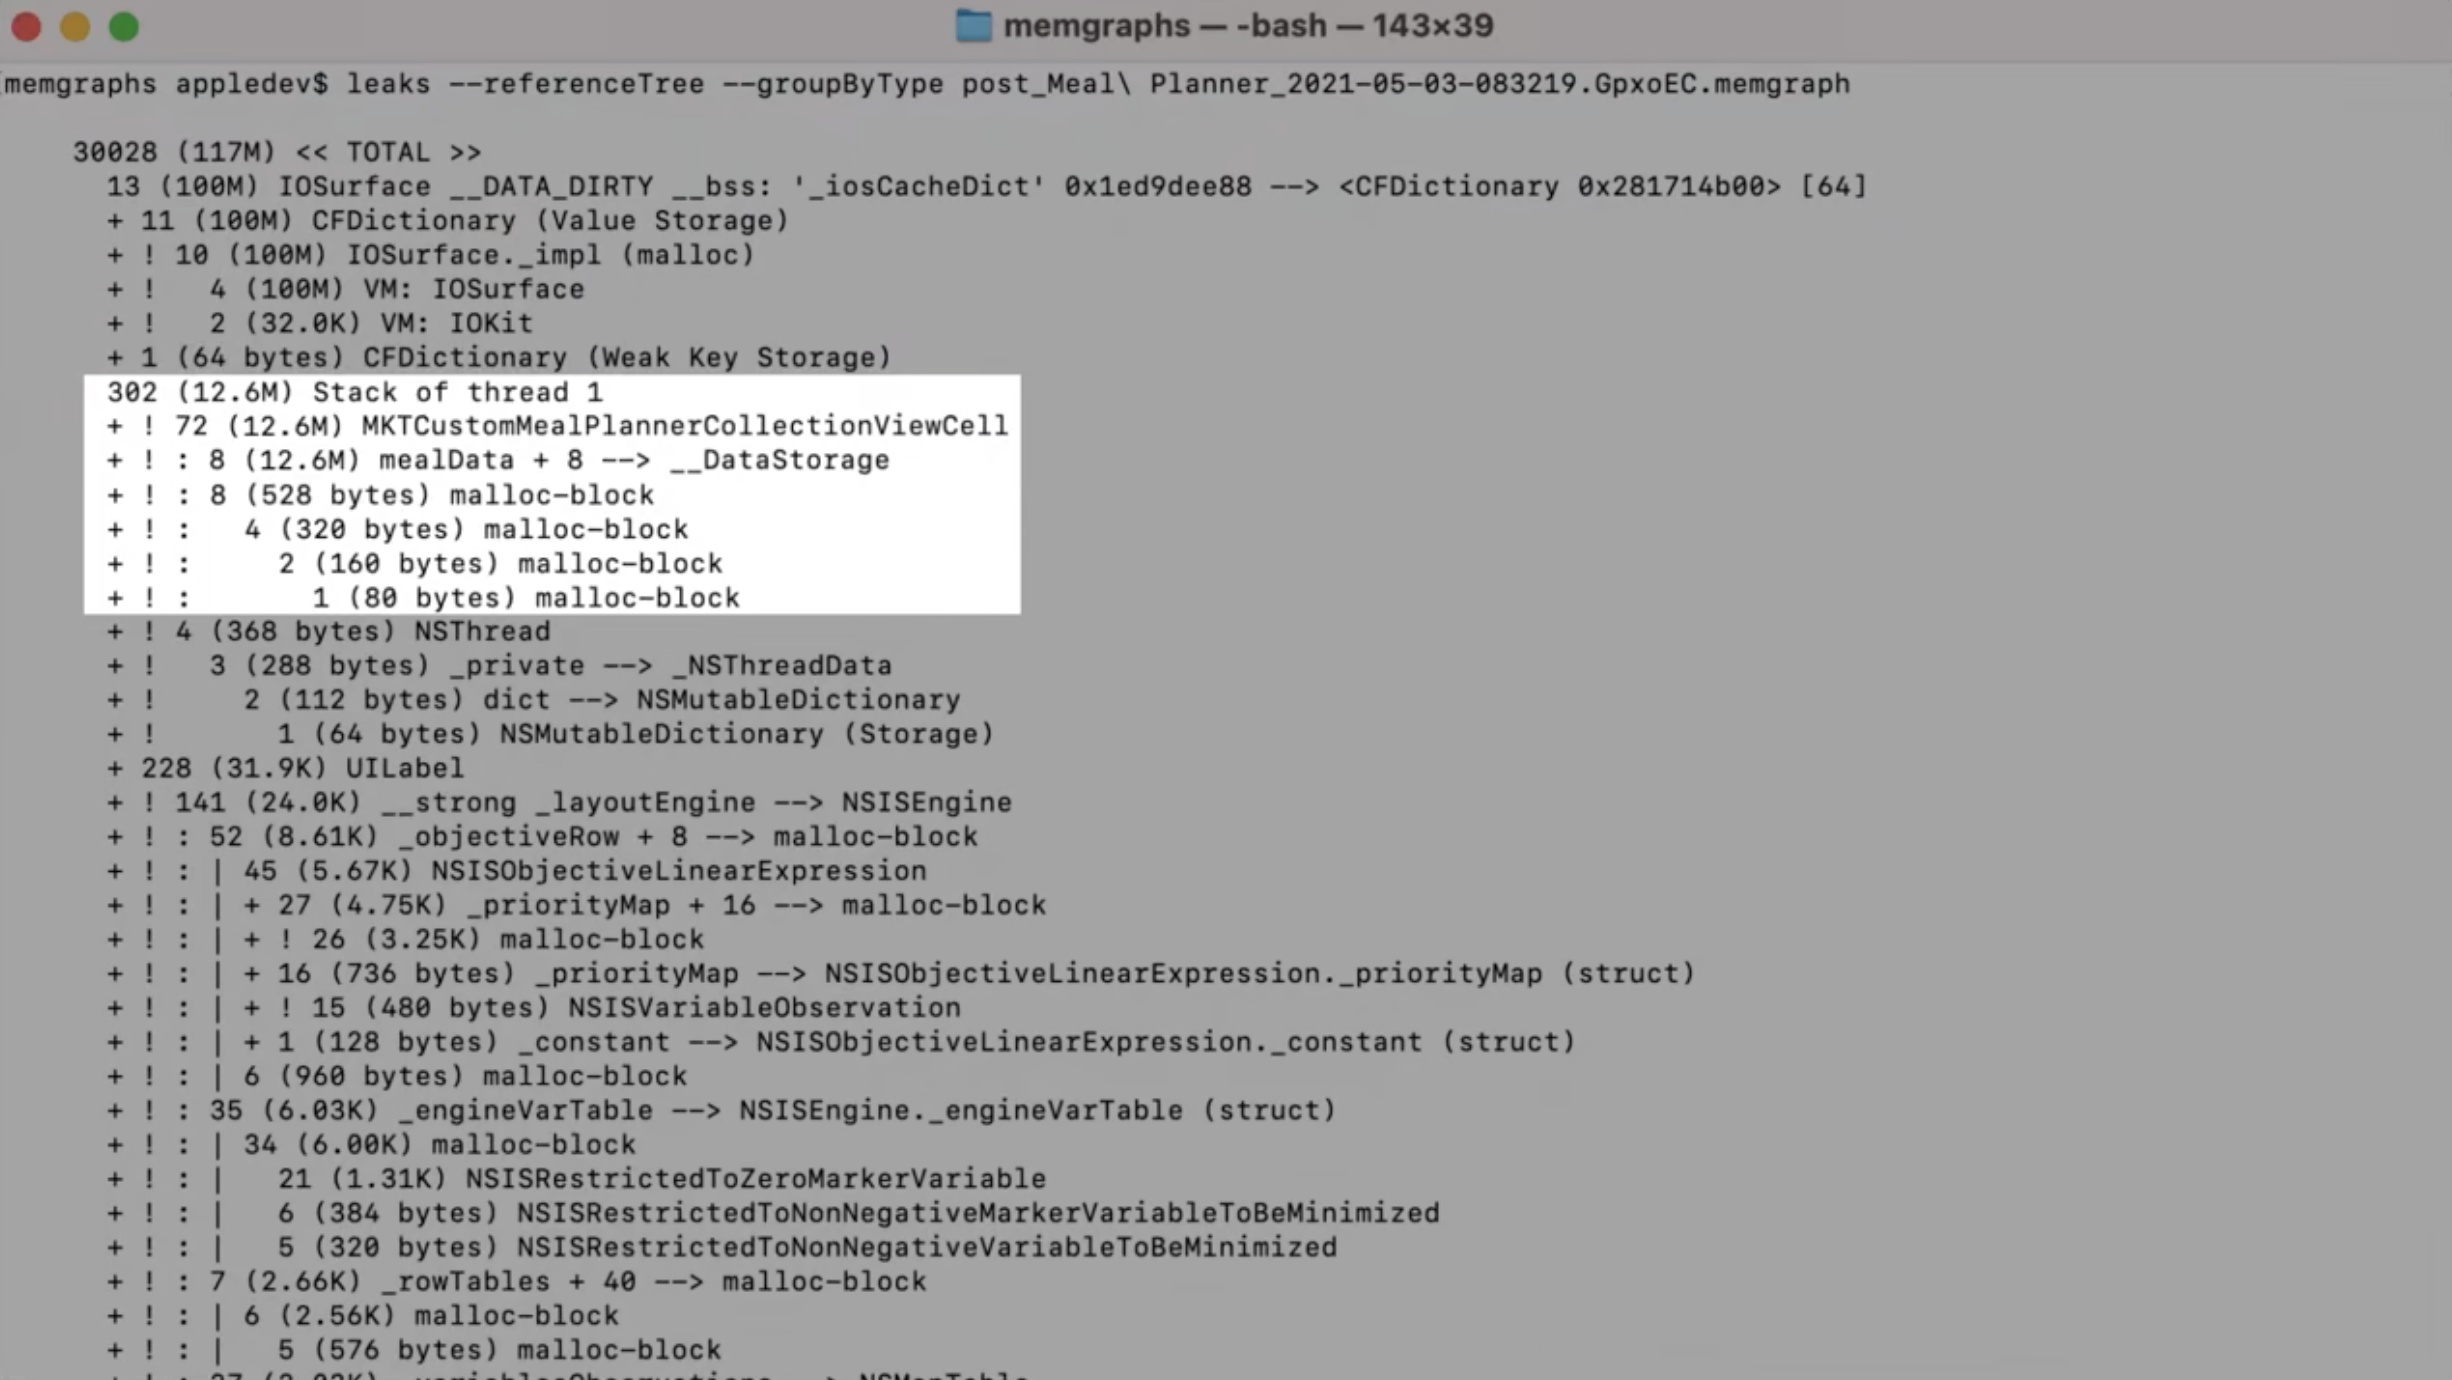
leaks --referenceTree모든 메모리의 top-down reference를 보여줌
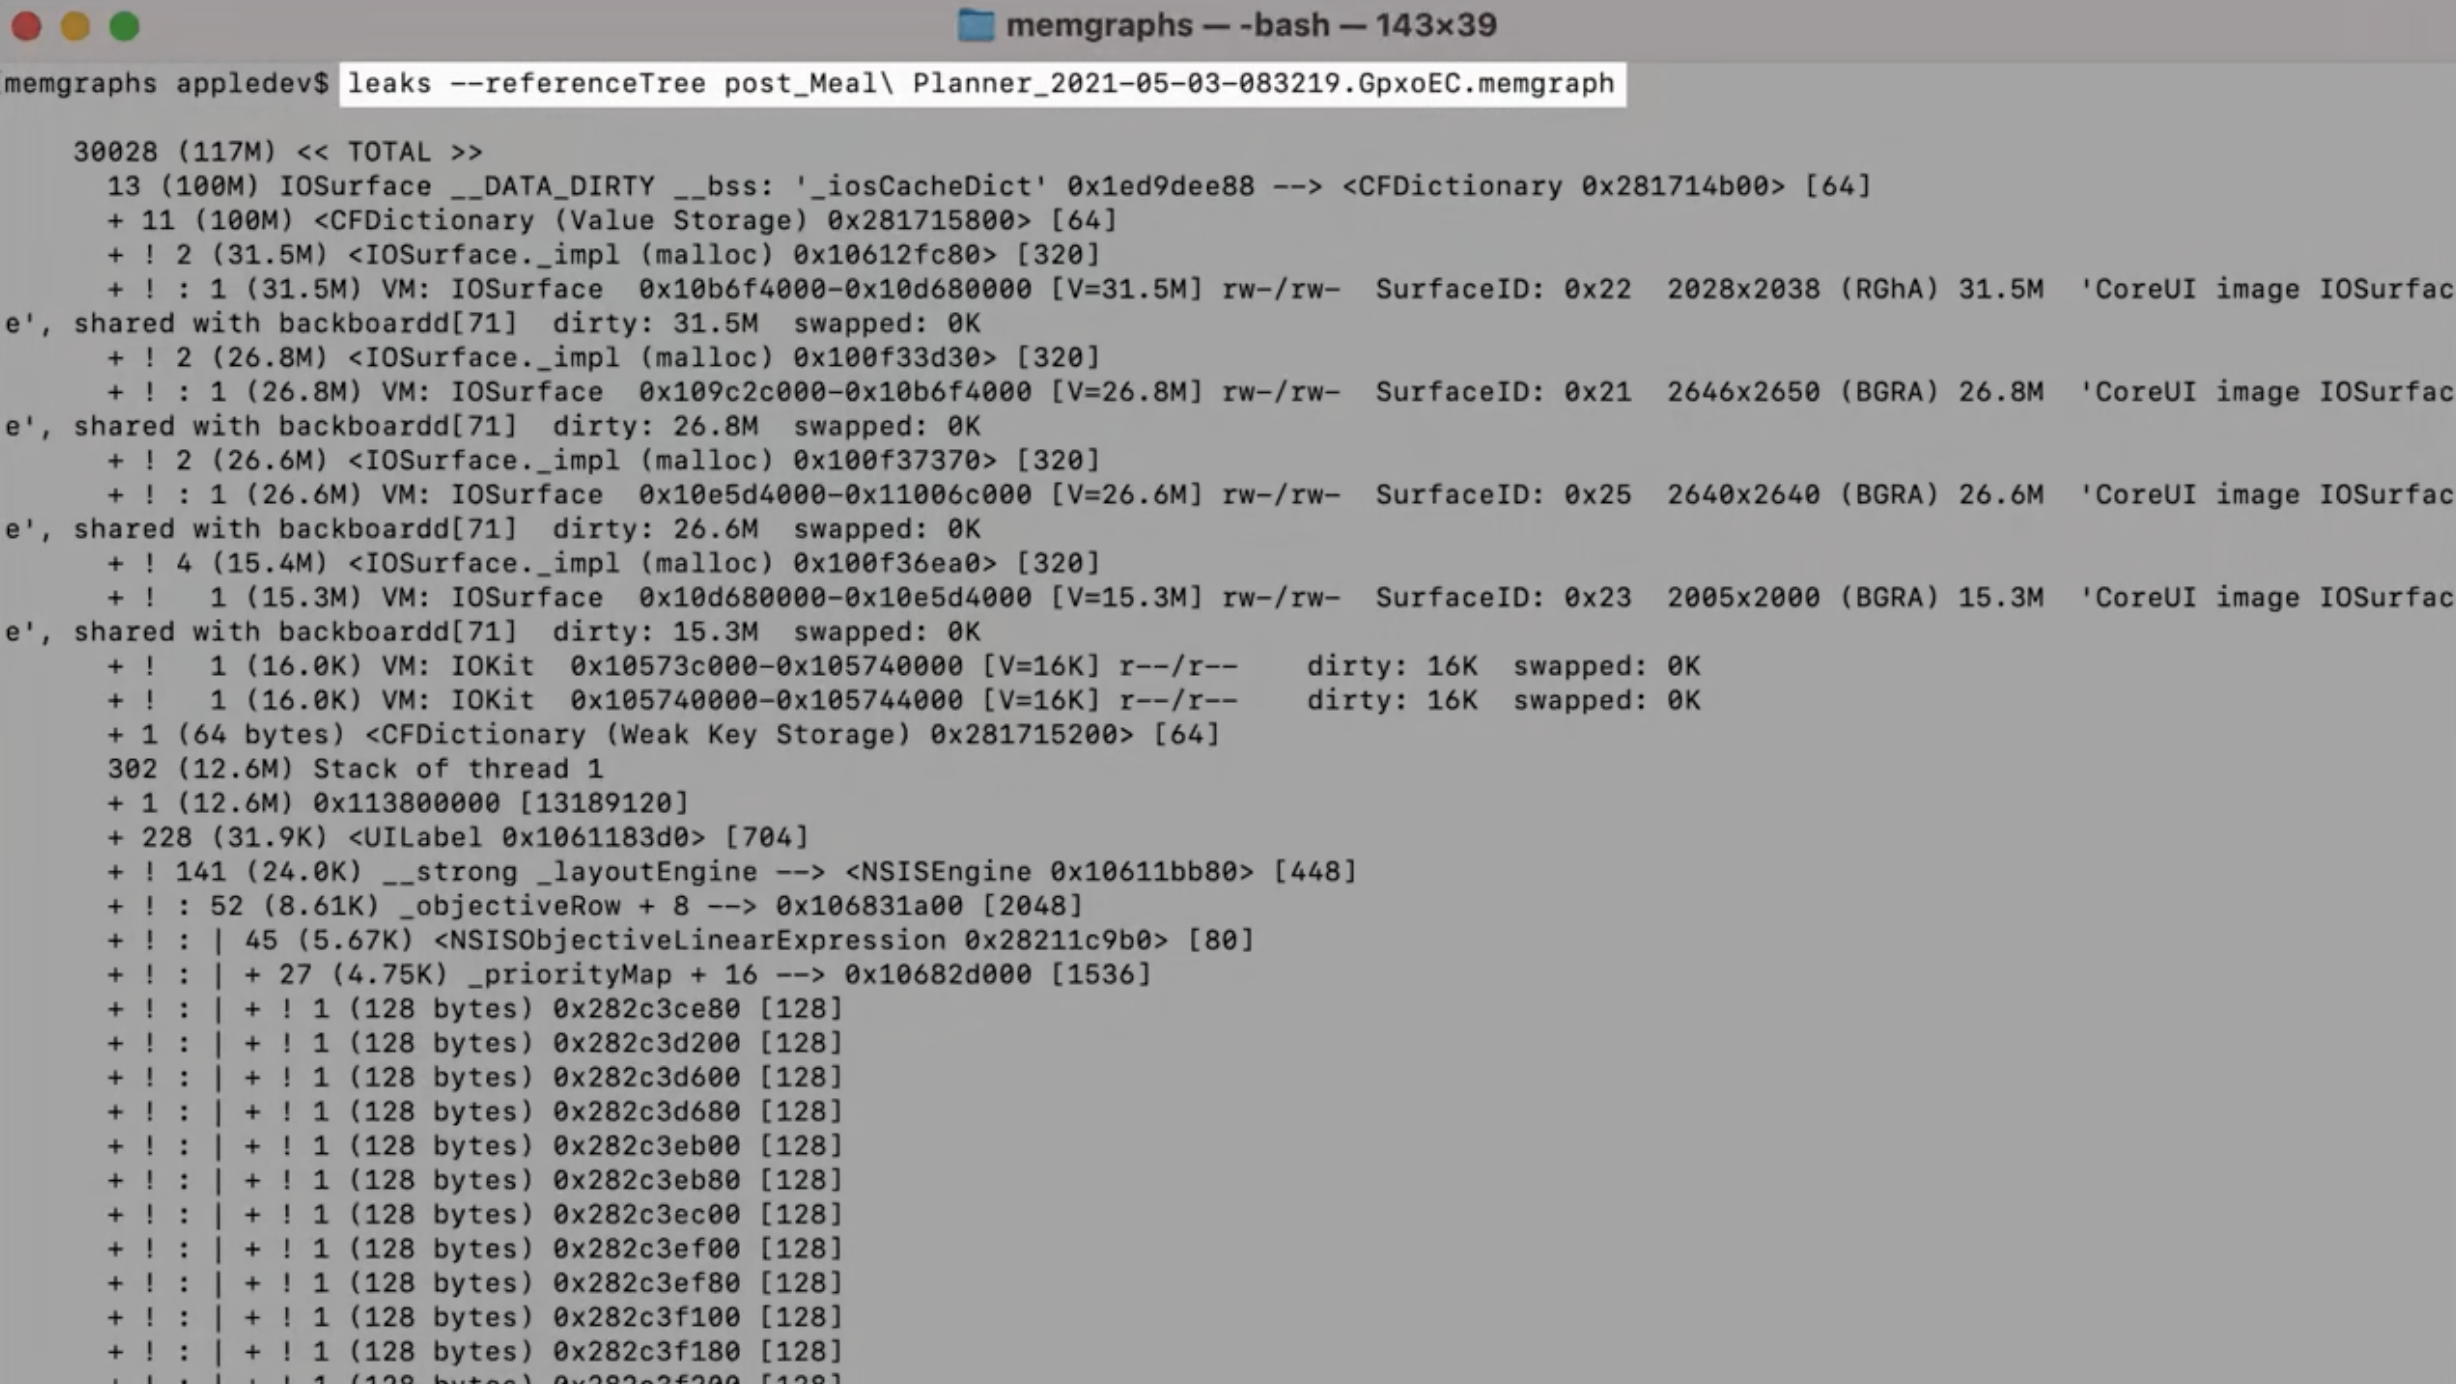
--groupByType 옵션 주면 좀 더 보기 편할 수 있음
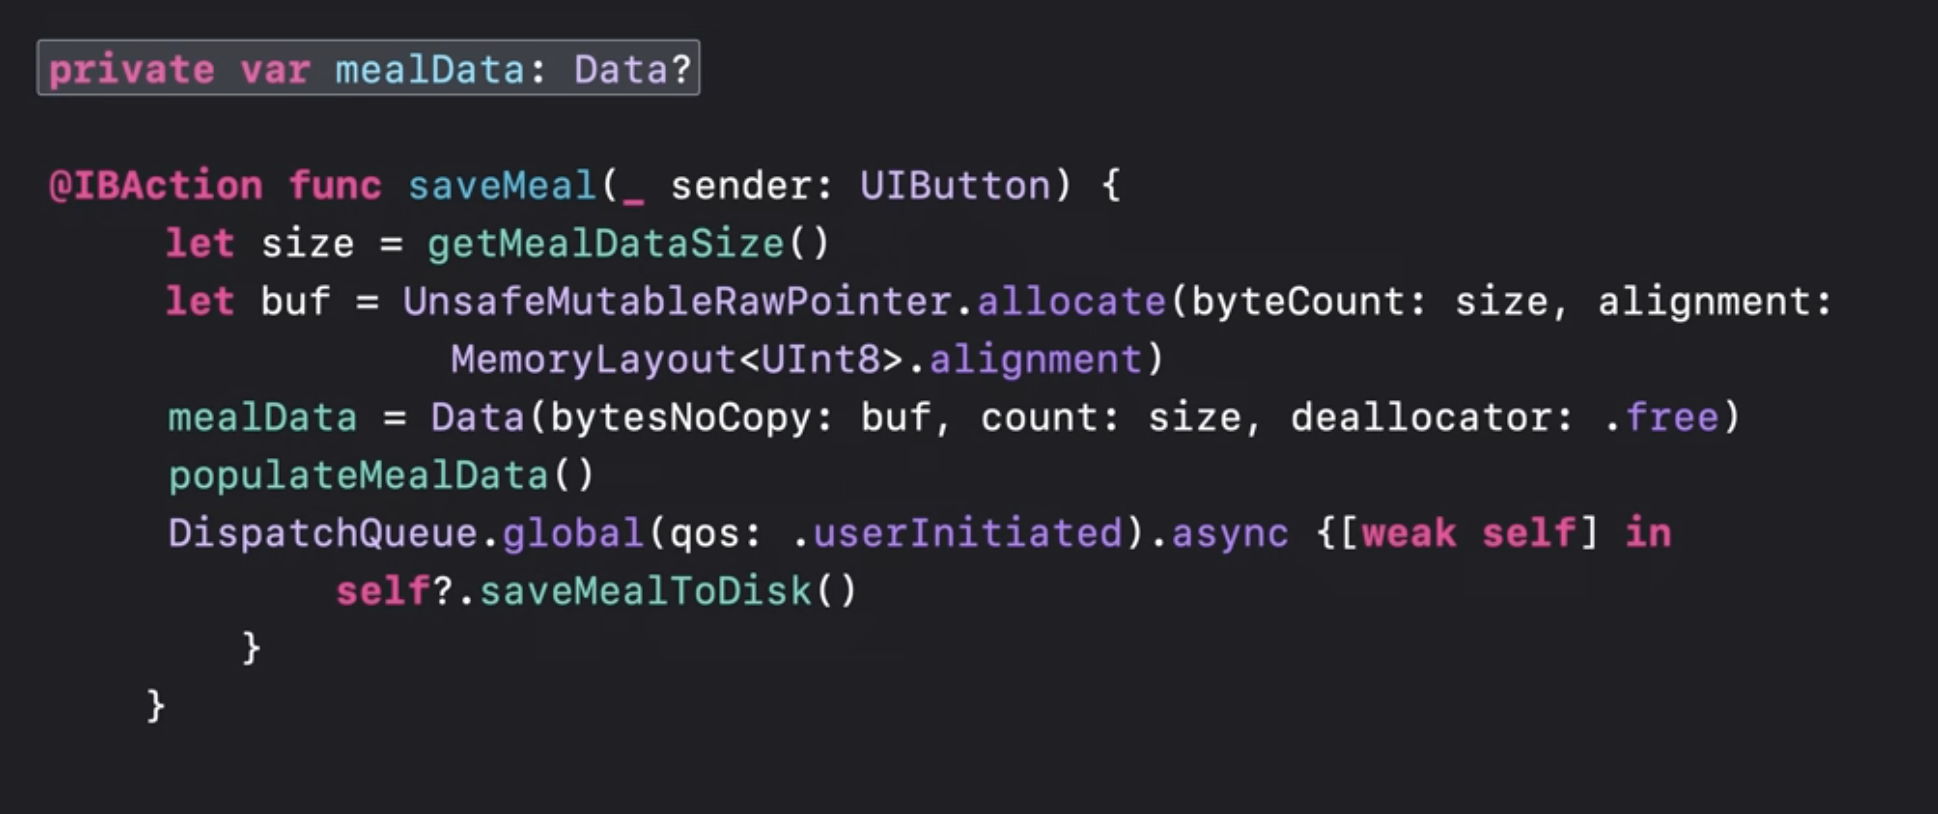
malloc_history -fullStacks이 object가 어떻게 allocate되었는지 파악할 수 있음
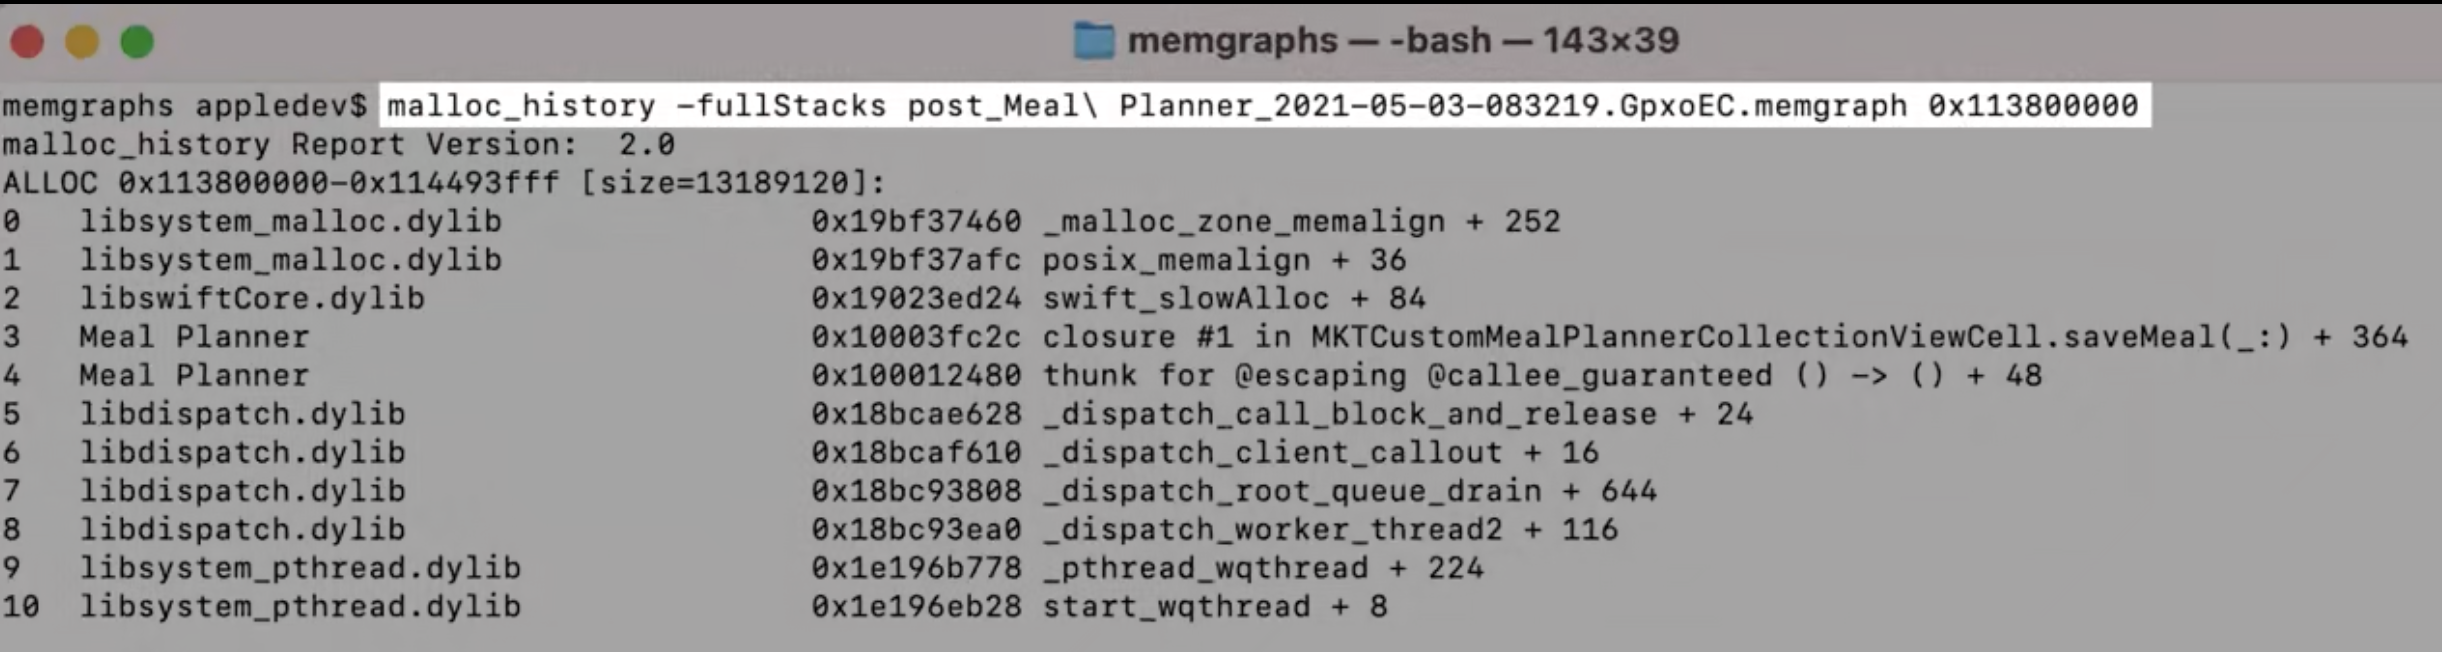
여기서 allocate 되었음을 파악할 수 있다
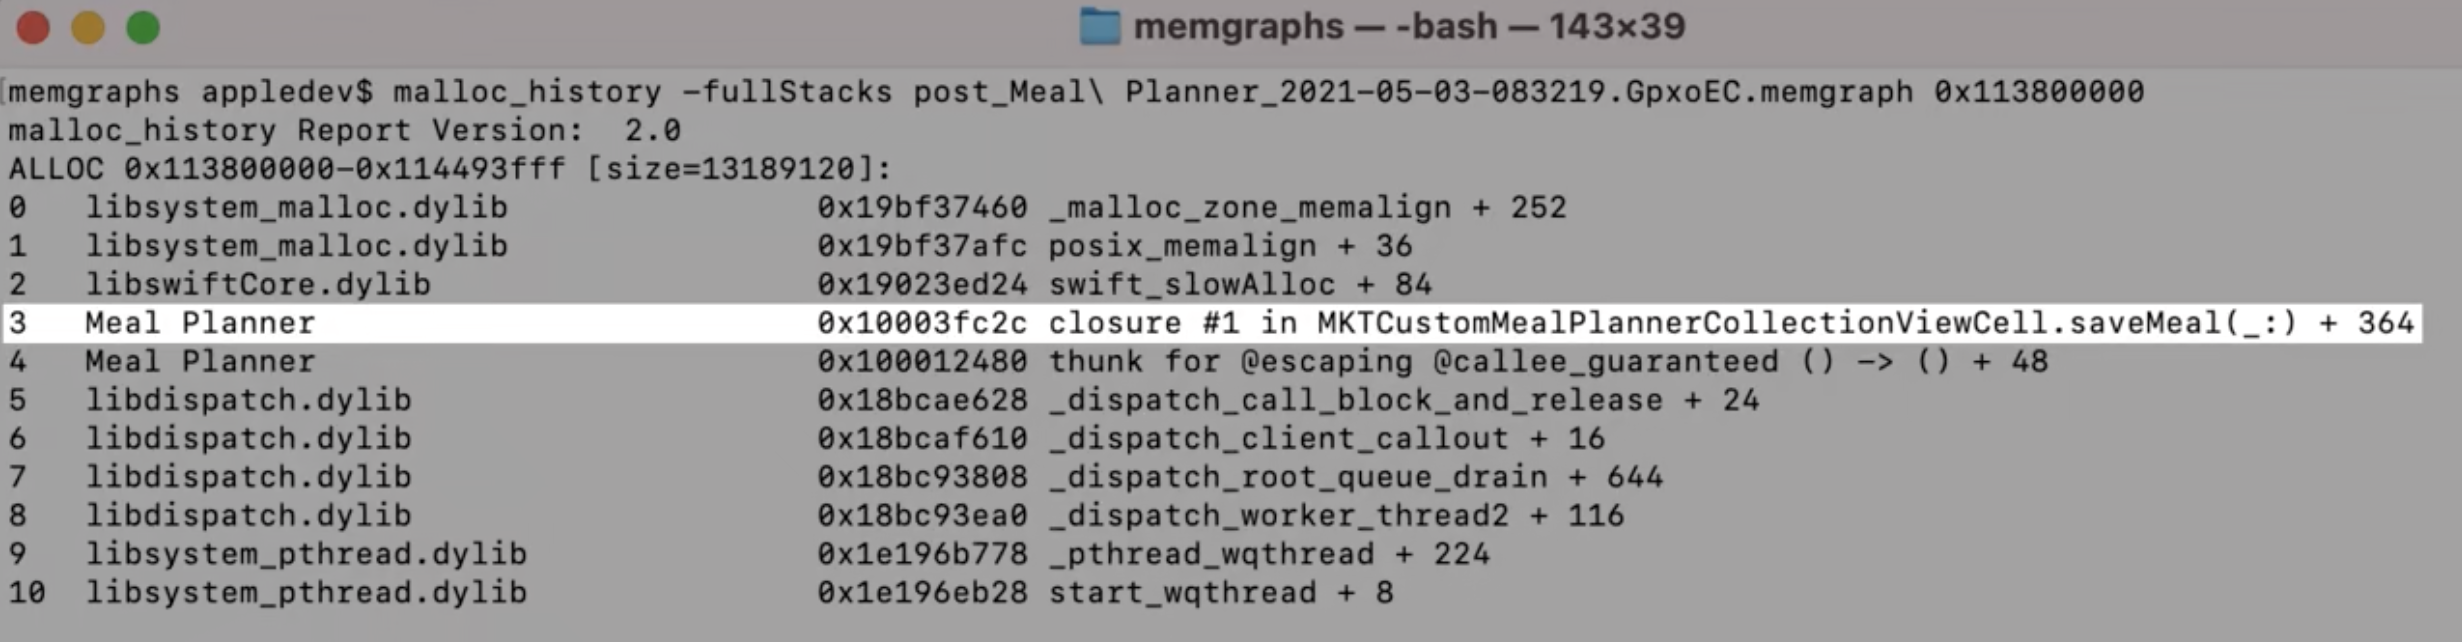
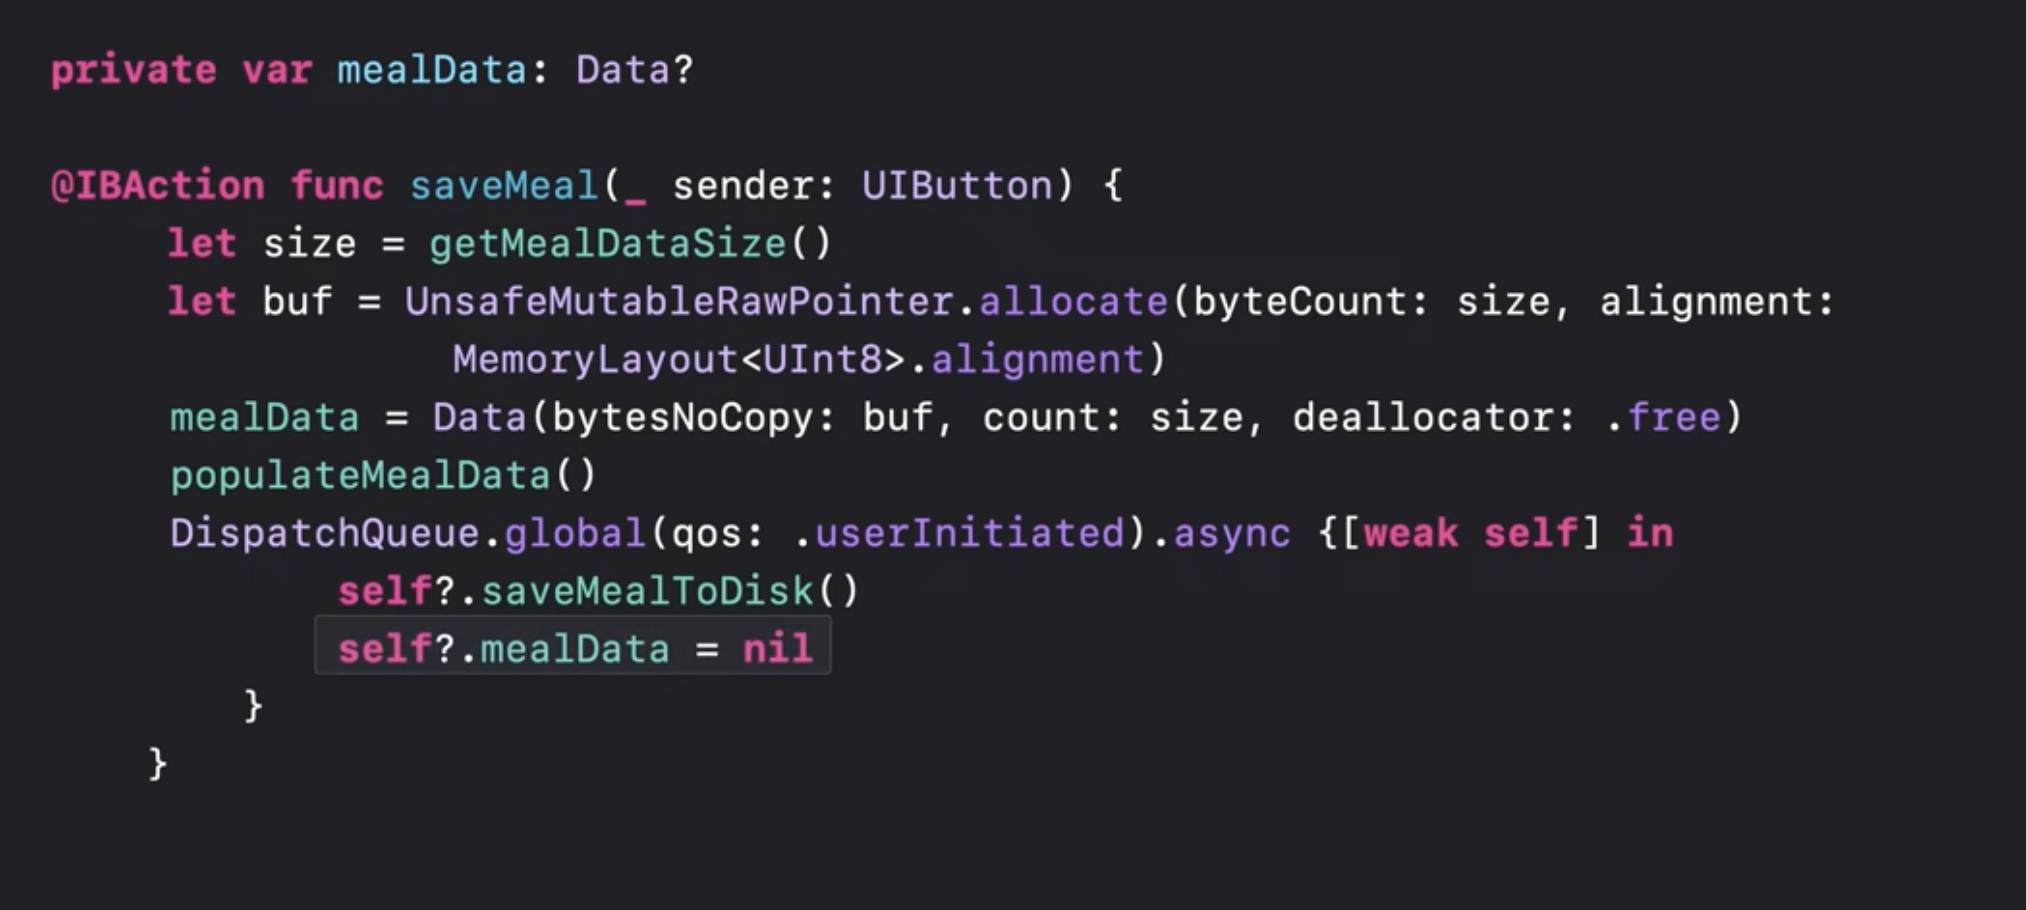
mealData는 saveMeal 되고나면 필요없는데 Cell이 유지되는 동안은 계속 남아있게 됨
saveMeal 이후에 mealData를 nil 처리 하는 방안이 있음

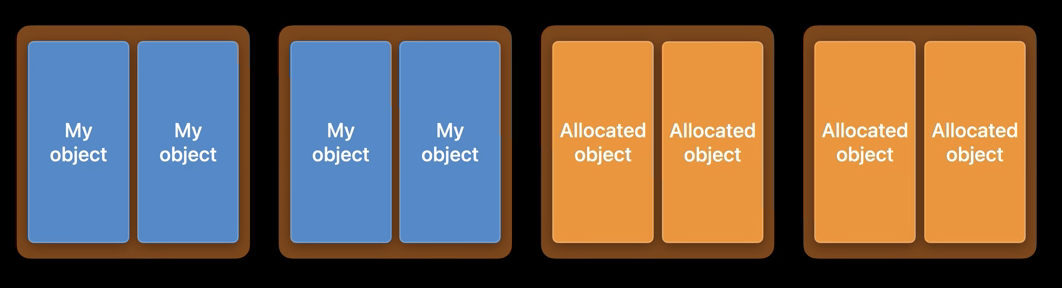
처음엔 Clean
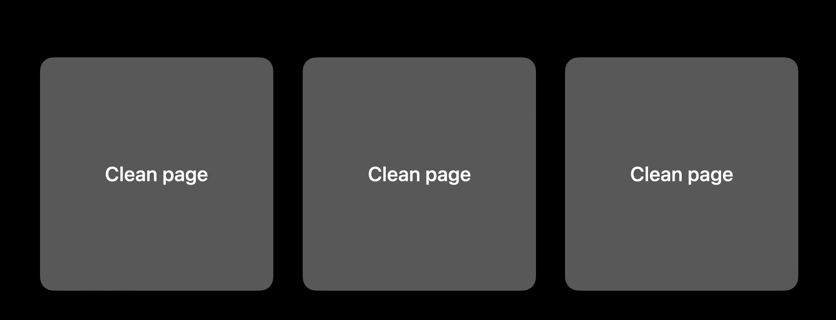
프로세스가 작동하면서 Allocated object가 page를 채움
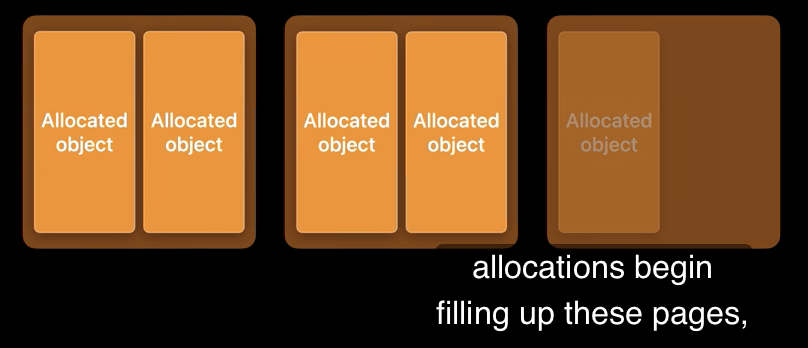
일부 Object가 deallocate 되면서 free memory가 됨.
하지만 여전히 allocated object가 있기 떄문에 여전히 dirty page.
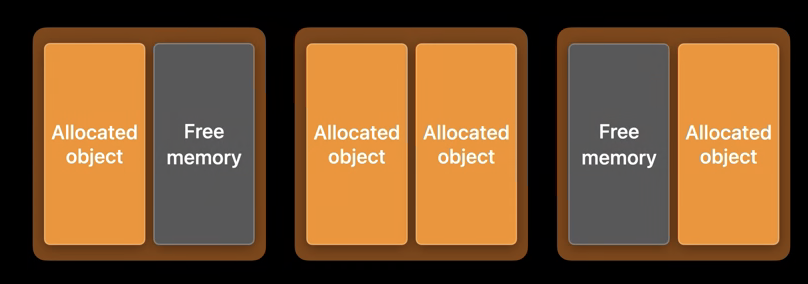
시스템은 이 빈공간을 채우려고 함.
파란색 크기의 allocation이 있다고 가정함.
빈공간을 합쳐보면 파란색 allocation을 받아줄 수 있지만, 한번에 allocate할 공간은 없음
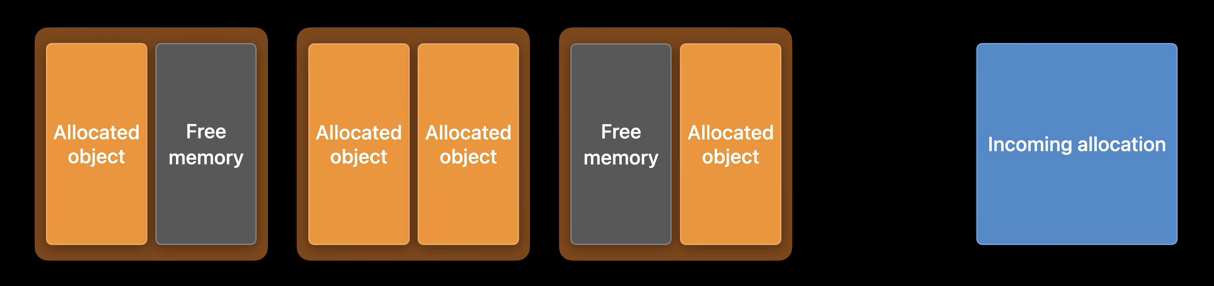
기존의 슬롯을 활용할 수 없기 때문에, 새로운 dirty page를 사용하게 되었음.
이렇게 free memory가 부분적으로 남아있는 경우를 Fragmentation 이라고 함
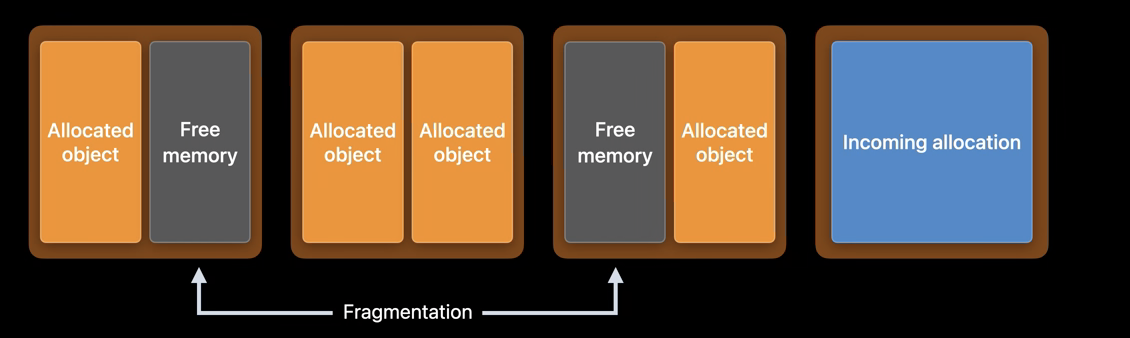
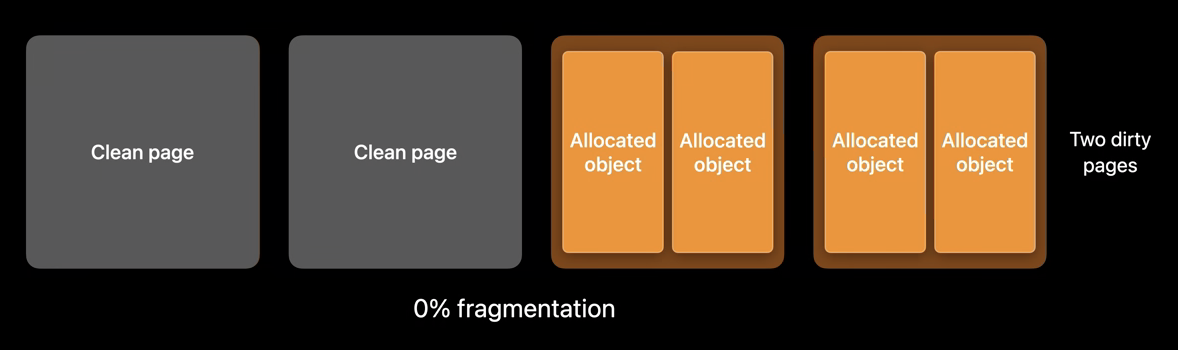
fragmentation을 줄이기 위해서는
메모리에서 유사한 lifetime을 가진 object끼리 allocate 하는 것이 가장 좋은 방법
동일한 Object는 모아서 allocate
이러면 Object가 deallocate 되었을 때 Clean Page를 확보할 수 있음
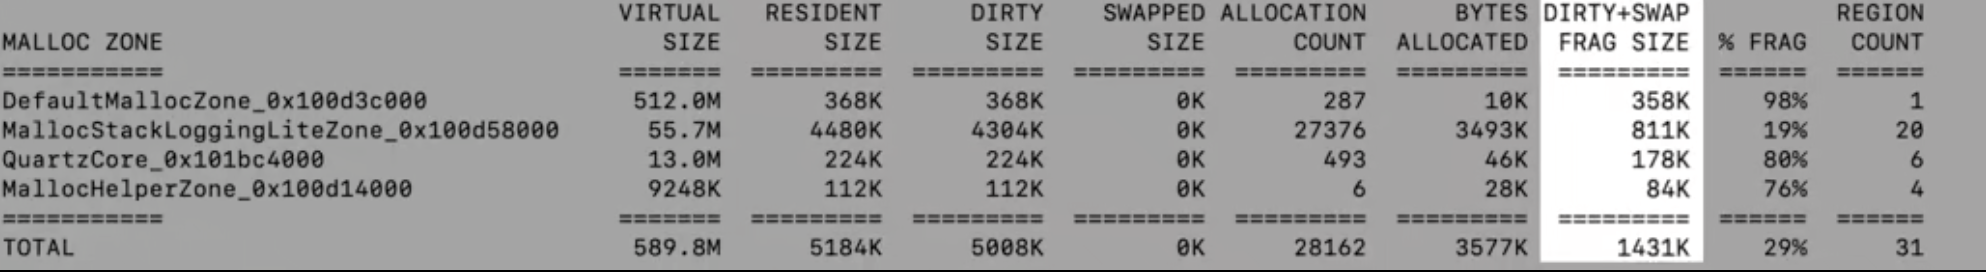
vmmap -summary 입력해서 볼 수 있음

DIRTY+SWAP FRAG SIZE를 보면 정확히 낭비되는 공간을 볼 수 있음
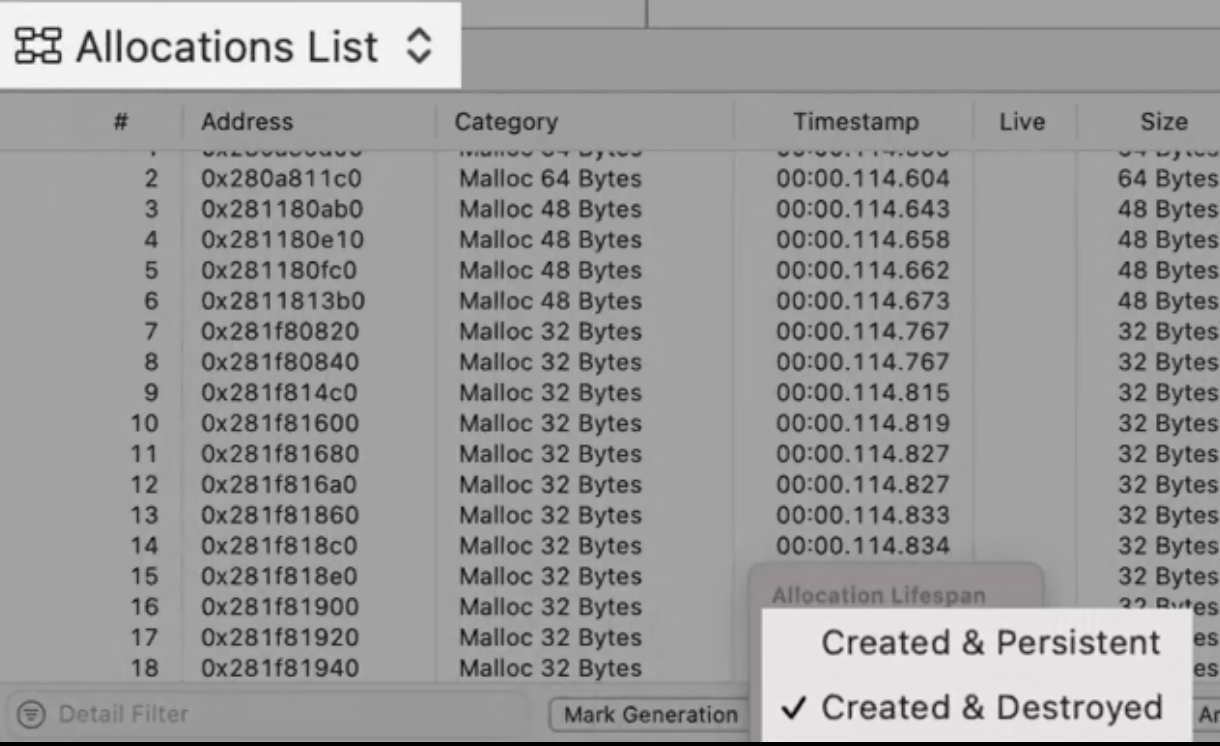
Instruments Tool > Allocations
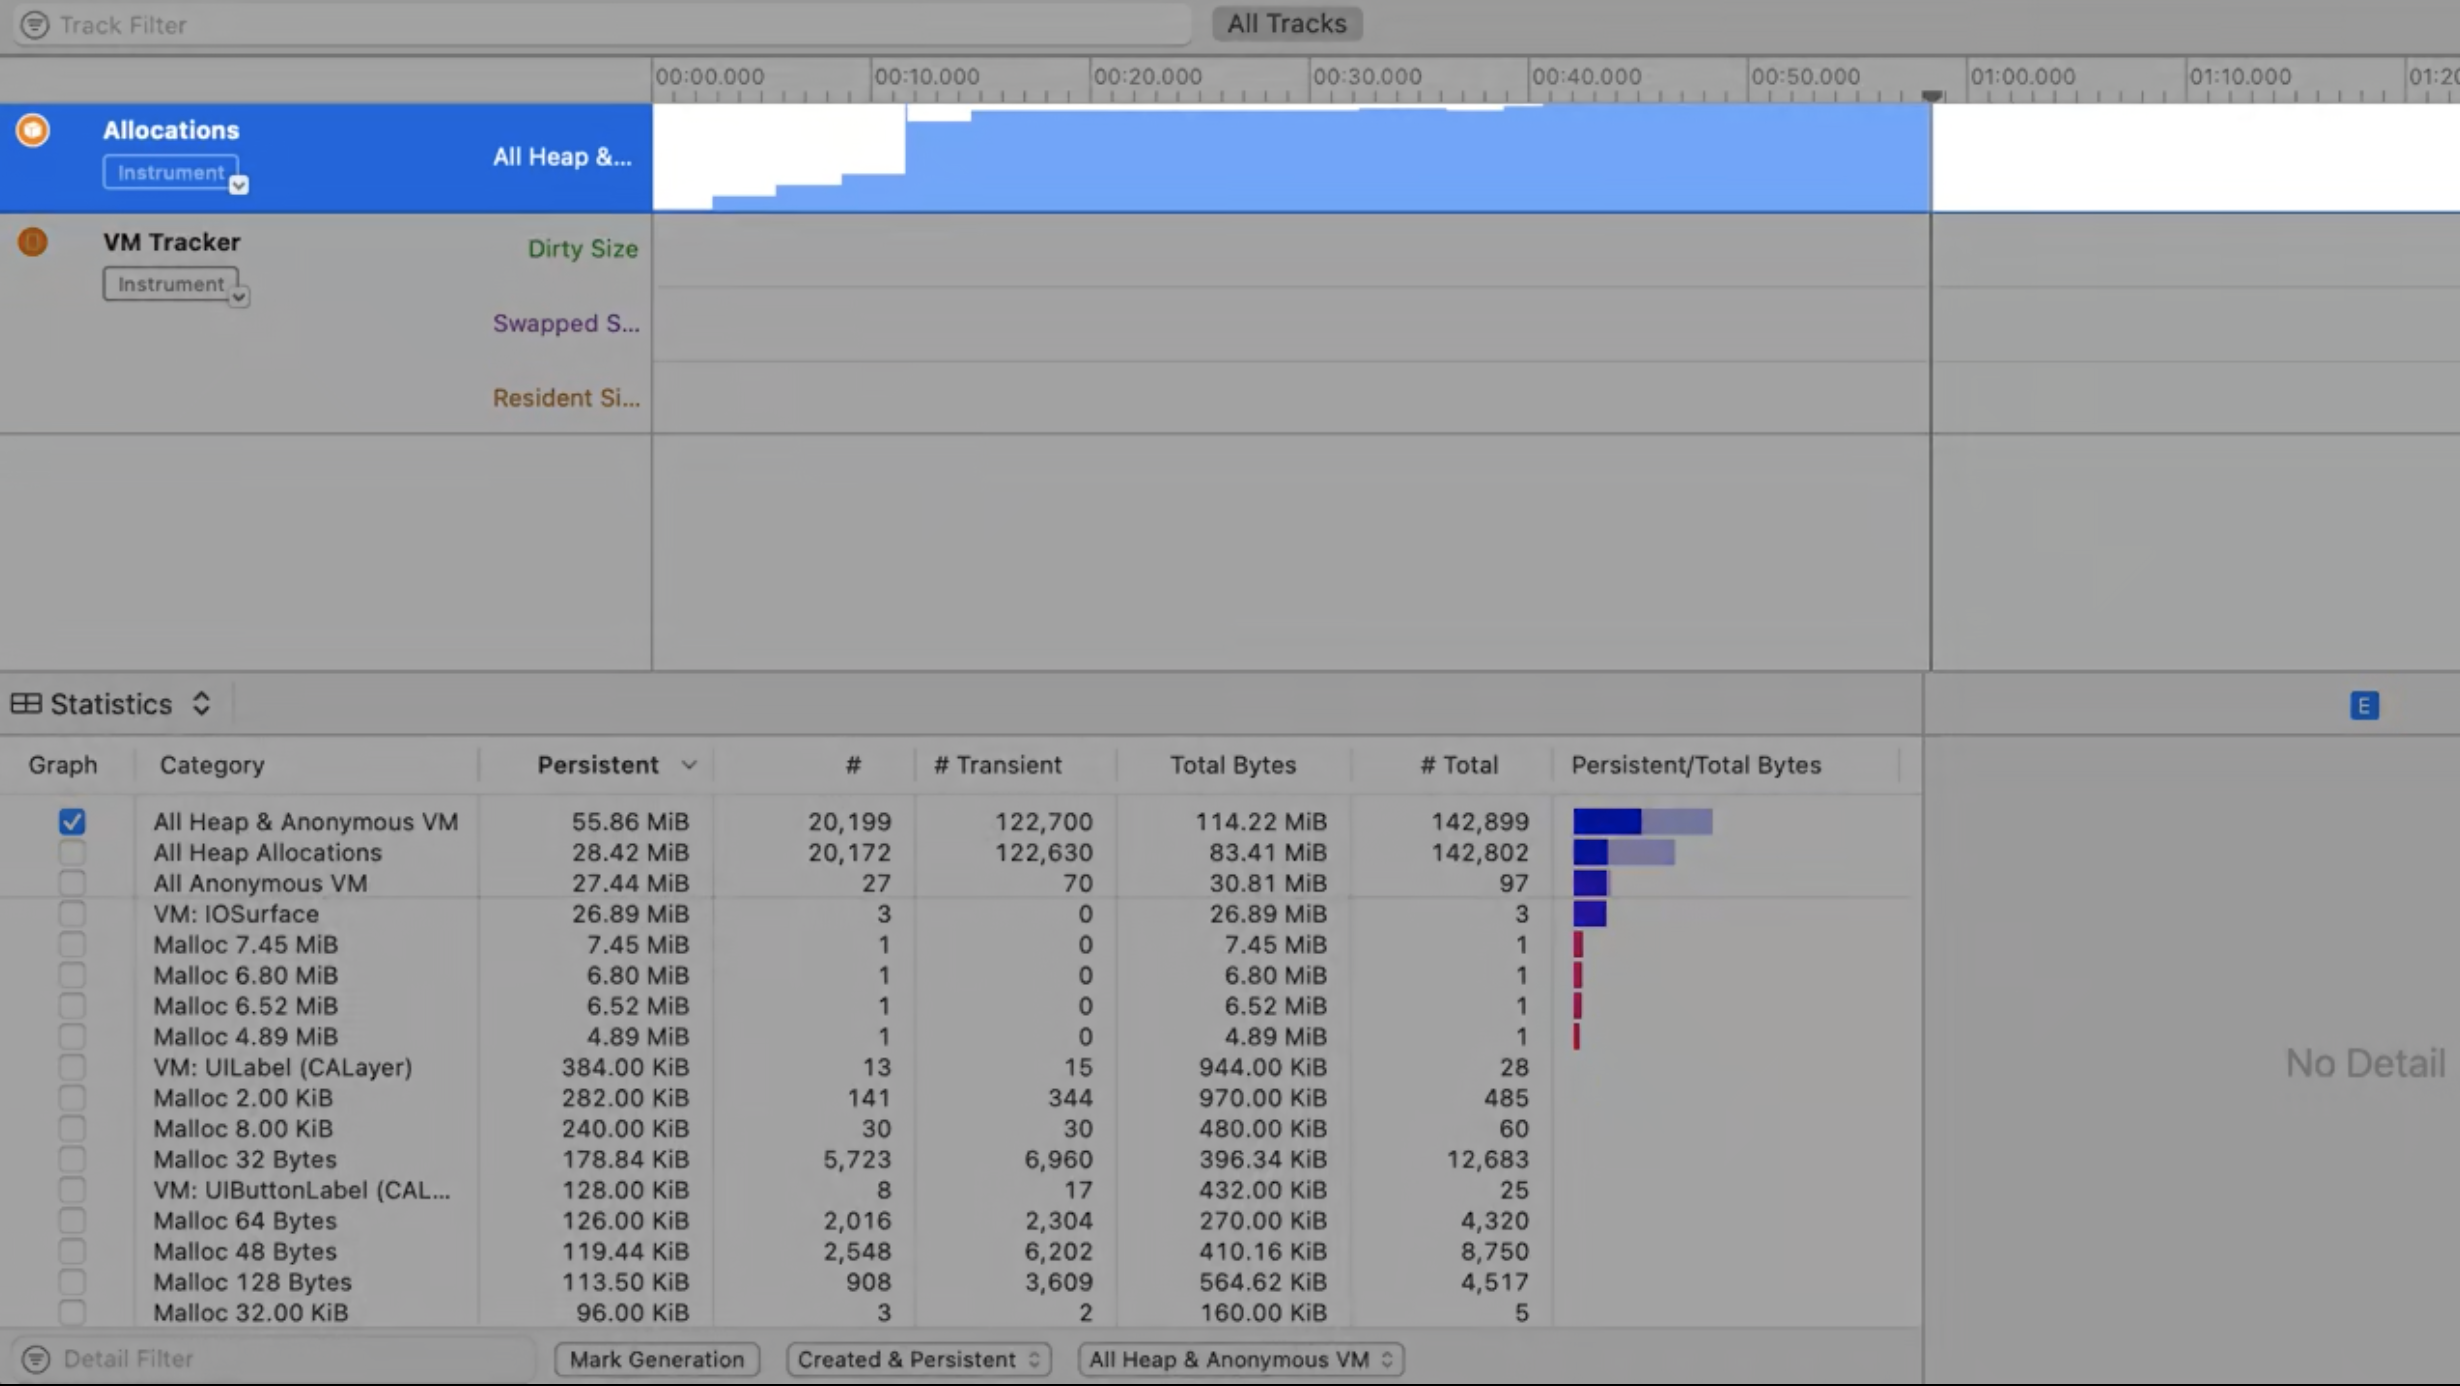
Allocation List, Created & Destroyed를 체크해서 확인

Instruments tool 사용을 좀 더 알아보려면 -> Getting Started with Instruments
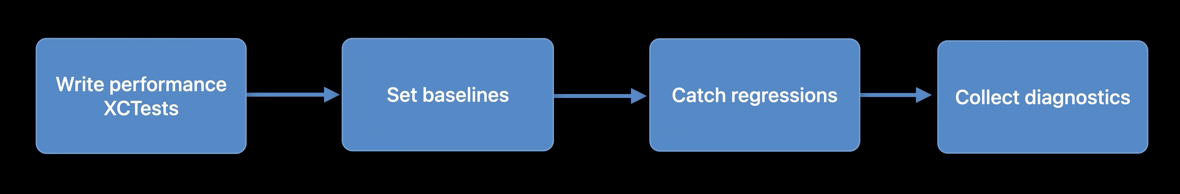
새 기능 추가 후에도 XCTest를 작성하여 지속적으로 퍼포먼스를 모니터링 할 수 있음

http://adamborek.com/top-7-rxswift-mistakes/
2. Observable should be lazy 내가 하고 있던 실수다


Your project uses SwiftyBeaver. SwiftyBeaver has security vulnerabilities that you may wish to address. Consider removing SwiftyBeaver if your app transmits PII. SwiftyBeaver/SwiftyBeaver#453
plist가 아니더라도 더 효율적인 구조가 있으면 찾아보자
Nested Block을 사용할 때 순환참조에 대한 이슈가 항상 고민된다.
제대로 된 실험을 통해서 정리해두면 어떨까?
https://github.com/jieumjigi/si-eum-iOS/blob/develop/sieum/UIControl%2BExtension.swift
extension UIGestureRecognizer {
    convenience init(_ onEvent: @escaping () -> Void) {
        let sleeve = ClosureSleeve(onEvent)
        self.init(target: sleeve, action: #selector(ClosureSleeve.invoke))
        objc_setAssociatedObject(self, "\(arc4random())", sleeve, .OBJC_ASSOCIATION_RETAIN)
    }
}
extension의 사용과 함께 objc_setAssociatedObject를 사용하게 되는데
참조가 제대로 해제되는지 언제 해제되는지 체크하는 실험 필요함.
A declarative, efficient, and flexible JavaScript library for building user interfaces.
🖖 Vue.js is a progressive, incrementally-adoptable JavaScript framework for building UI on the web.
TypeScript is a superset of JavaScript that compiles to clean JavaScript output.
An Open Source Machine Learning Framework for Everyone
The Web framework for perfectionists with deadlines.
A PHP framework for web artisans
Bring data to life with SVG, Canvas and HTML. 📊📈🎉
JavaScript (JS) is a lightweight interpreted programming language with first-class functions.
Some thing interesting about web. New door for the world.
A server is a program made to process requests and deliver data to clients.
Machine learning is a way of modeling and interpreting data that allows a piece of software to respond intelligently.
Some thing interesting about visualization, use data art
Some thing interesting about game, make everyone happy.
We are working to build community through open source technology. NB: members must have two-factor auth.
Open source projects and samples from Microsoft.
Google ❤️ Open Source for everyone.
Alibaba Open Source for everyone
Data-Driven Documents codes.
China tencent open source team.