chartjs / chartjs-plugin-datalabels Goto Github PK
View Code? Open in Web Editor NEWChart.js plugin to display labels on data elements
Home Page: https://chartjs-plugin-datalabels.netlify.app
License: MIT License
Chart.js plugin to display labels on data elements
Home Page: https://chartjs-plugin-datalabels.netlify.app
License: MIT License


Hi, thanks for this awesome plugin in chartjs. I've read the docs but can't seems to find it even in the samples. I have this mixed chart with bar graphs and line graph, what I want is to add the datalabels in specific datasets and not to the whole chart. Can you give me an example as I have no idea on what to do. BTW, thanks!
Hi, cool plugin
But I have an issue with offset options: https://chartjs-plugin-datalabels.netlify.com/positioning#alignment-and-offset
The label is not pulled out from the anchor point. It just stays there.
This is my code:
var datatables_plugin = [
    Chart.defaults.global.plugins.datalabels.anchor = 'end',
    Chart.defaults.global.plugins.datalabels.font.size = 11,
    Chart.defaults.global.plugins.datalabels.font.weight = 700,
    Chart.defaults.global.plugins.datalabels.padding.bottom = 81,
    Chart.defaults.global.plugins.datalabels.offset = 8,
    Chart.defaults.global.defaultFontColor = 'black'
];

function EAF() {
    var ctx = document.getElementById("chart_EAF");
    datatables_plugin;

    var chart_EAF = new Chart(ctx, {
        type: 'bar',
        data: {
            labels: ["16-Okt", "17-Okt", "18-Okt", "19-Okt", "20-Okt", "21-Okt", "22-Okt"],
            datasets: [{
                label: "% (Persen)",
                backgroundColor: ["#1fb6ff", "#1fb6ff", "#1fb6ff", "#1fb6ff", "#1fb6ff", "#1fb6ff", "#1fb6ff"],
                data: [82.99, 82.99, 82.99, 82.99, 82.99, 82.99, 82.99]
            }]
        },
        options: {
            scales: {
                yAxes: [{
                    ticks: {
                        beginAtZero: true
                    }
                }]
            },
            legend: {
                display: true,
                fontColor: 'black'
            },
            title: {
                display: true,
                text: 'EAF'
            }
        }
    });
}
Any help would be greatly appreciated!
Thanks!

I am trying to make a chart like above. Would you please advise how to approach?
What I am think is
Have a <canvas> next to the <p-chart> //p-chart is how Angular4+primeNG wraps chart.js
<div class="dsbd-panel-body" style="position: relative; width:350px; height:300px;">
<canvas id="naples_text" style="z-index: -1; position: absolute; width:300px; height:300px; left: 0px; top: 0px;"></canvas>
<p-chart type="doughnut" [data]="item.data" [options]="item.options" >
</div>
Use Option.animation.onComplete() to write to the canvas
`options: {
...
},
animation: {
onComplete: function () {
     const mainLabel = numPercent;
     const $ = Utility.getJQuery();
     const element = $('#naples_text').get(0);
     if (element) {
       const textCtx = element.getContext('2d');
       textCtx.textAlign = 'center';
       textCtx.textBaseline = 'middle';
       textCtx.font = '24px Fira San';
       textCtx.fillStyle = '#676763';
       textCtx.fillText(mainLabel, 180, 70);
       textCtx.font = '10px Fira San';
       textCtx.fillStyle = '#e57553';
       textCtx.fillText(badLabel, 180, 95);
       textCtx.font = '12px Fira San';
       textCtx.fillStyle = '#88b358';
       textCtx.fillText(goodLabel, 180, 105);
     }
   }
 }
}`
I have a line chart with a legend and 3 lines drawn. When you click the legend the lines show/hide and the graph adjusts accordingly. Out of the box the datalabels do not hide whenever a line is hidden. I am currently using this method of hiding the datalabels:
options: {
    plugins: {
        datalabels: {
            display: (context: any) => {
                return !context.dataset._meta[0].hidden;
            },
        },
    },
},
This works, but the _meta[0].hidden thing seems like a hack/not something we're supposed to be using. Is there a different approach that is more stable?
Hello thank you for your plugin and latest update.
We have a small problem from 0.2.0 update, after the update we are getting the error and labels are missing from the chart.
**
Uncaught TypeError: model.positioner is not a function
Uncaught TypeError: model.positioner is not a function
at coordinates (chartjs-plugin-datalabels.js:359)
at Object.afterDatasetDraw (chartjs-plugin-datalabels.js:618)
at Object.notify (Chart.min.js:10)
at t.drawDataset (Chart.min.js:10)
at t.drawDatasets (Chart.min.js:10)
at t.draw (Chart.min.js:10)
at t.render (Chart.min.js:10)
at Object.callback (Chart.min.js:10)
at Object.advance (Chart.min.js:10)
at Object.startDigest (Chart.min.js:10)
at Chart.min.js:10
**
Getting the following error when loading up my charts;
ember-metal.js:3988 TypeError: helpers.merge is not a function
    at configure (chartjs-plugin-datalabels.js:573)
    at Object.afterDatasetUpdate (chartjs-plugin-datalabels.js:581)
    at Object.notify (Chart.js:6937)
    at Chart.updateDataset (Chart.js:4165)
    at Chart.updateDatasets (Chart.js:4140)
    at Chart.update (Chart.js:4087)
    at Chart.construct (Chart.js:3844)
    at new Chart (Chart.js:6340)
    at Class.didInsertElement (ember-chart.js:18)
    at Class.superWrapper [as didInsertElement] (ember-utils.js:423)
This occurs on the following line;
https://github.com/chartjs/chartjs-plugin-datalabels/blob/master/src/plugin.js#L304
I am using Chart.js 2.7.0

When I step through the code, I can see that helpers is defined, and has lots of helper functions, but is missing merge. It does however have configMerge and scaleMerge which I believe are more specific use cases of the merge function. Should merge perhaps be configMerge??
Looking at the other variables on the line, config == {}, options == (default option object), override == undefined.
First off, thank you for this great plugin. The docs and samples are awesome.
Question:
I'm creating a scatter plot with labels. I have the labels working, however, I can't seem to get them positioned how I'd like. What I want is the text to be centered to the right of the plot point.
Thanks for the great package!
I want to make charts look like this

As you can see, there two labels and they are in different UI styles.
Please advise
Feature suggestion to implement an option to auto-rotate data labels to overcome overlapping in a similar fashion Chart.js do this (see maxRotation param @ Cartesian Axes docs page).
Illustration:

If there are any NaN values in the data array it will be displayed at the top left corner of the canvas.

Prevent this by adding formatter function:
formatter: function(value) {
    if(isNaN(value)){
        return "";
    }
    return value;
}
Hi, I came across your plugin because it was recommended here: https://stackoverflow.com/questions/31631354/how-to-display-data-values-on-chart-js.
How can I achieve a data sensitive shift of the align parameter? There doesnt seem to be a logic build in as my example chart shows:

I need to switch the align parameter depending on the draw height / width of the bar.
In the align function I have implemented for the "align" parameter I have access to the chart instance, context etc. but the height of the ChartElement for all data is undefined.
Is this possible?
Hi,
I'm using the plugin with scatter charts and it's doing a great job. However, if there are two scatter points very close together the labels often overlap. Is there any way to avoid this?
Thanks a lot
I'm trying to use this plugin with angular-chart.js but the datalabels are not showing up.
I've added
plugins: {
          datalabels: {
            color: 'white',
            display: function(context) {
              return context.dataset.data[context.dataIndex] > 15;
            },
            font: {
              weight: 'bold'
            },
            formatter: Math.round
          }
        }
to the options using the 'chart-options' directive and datalabels: {align: 'end', anchor: 'start'} to the datasets using the 'chart-dataset-override' directive.
But its not working. What am i doing wrong?
We all like to catch glimpse of some samples to make up a decision to try a plugin or not. Because, right now, even with the documentation, it is not clear how to use it.
I have a page with multiple charts, I want to use this plugin with one specific chart and not with the others. Because the defaults are global my other charts are still using the plugin.
I fill the options with this plugin's configuration for one chart and not the others, the datalabels still show up on all my charts.
A workaround is to set Chart.defaults.global.plugins.datalabels.display = false; so it doesn't show the values. I'd like a cleaner options so I can set this chart specific, is this possible?
Hi,
I have a captaincasa project that uses chartjs for charts. The chartjs config is passed via json to captaincasa, which is working great.
But is it possible to pass the formatter parameter as JSON.
I tried different options, but none of them are working.
captaincasa example http://www.captaincasademo.com/ccdemos/workplace.workplaceRisc.risc ==> reporting ==> chartjs (in this case no plugins are loaded)
Hi
I'd like to use the plugin with RequireJS but not sure how to define require.config. I have followed the similar instructions for streaming plugin (https://stackoverflow.com/questions/48957033/what-is-the-syntax-for-require-config-for-chartjs-plugin-streaming-and-dependenc) but wasn't successful.
Any hint?
Thanks very much
regards, dejan
The library is not able to position the labels properly on a multi-data bar chart. If value of element 1 is 1000 and element 2 is 0, the labels are still floating at the level of 1000.
plugins: {
	datalabels: {
		formatter: (value, ctx) => {
			return value !== 0 ? value.toLocaleString(/* ... */) : 'N/A'
		}
		anchor: 'end',
		align: 'end',
		color: '#888'
	}
}
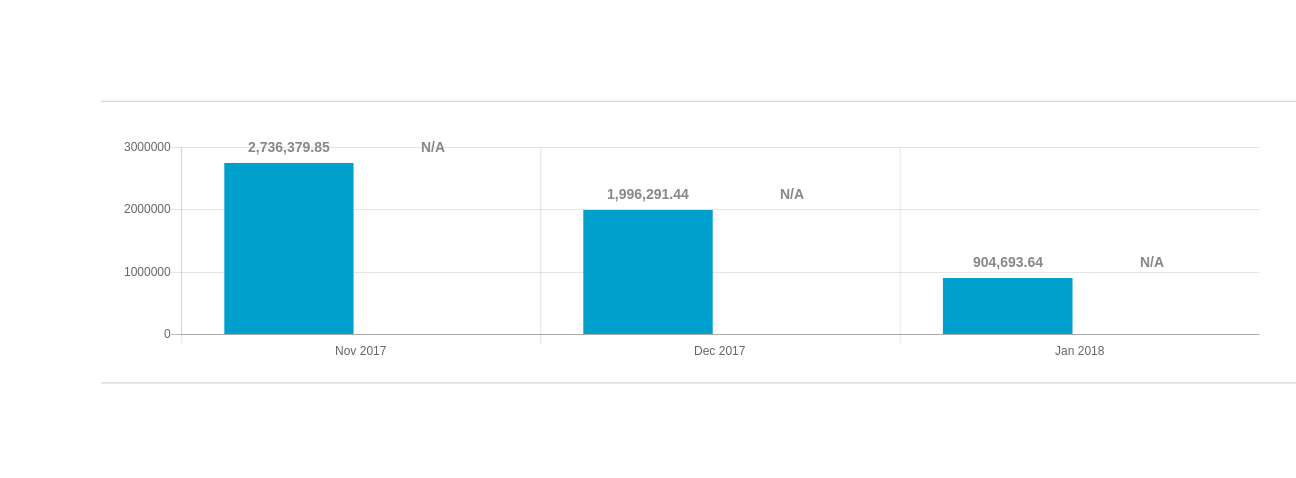
Expected behaviour: N/A should be on the top of the x-axis origin (0).
Hi,
I'm trying to create a simple doughnut chart using Chart.js and datalabels in Angular 5.
I followed the docs but could not get it to work.
Specs:
Angular v5
Chart,js v2.7.2
chartjs-plugin-datalabels v0.3.0
Here is my code:
import { Component, OnInit, ViewChild, ElementRef } from '@angular/core';
import { Chart } from 'chart.js';

@Component({
  selector: 'app-root',
  template: `
  <div style="height: 300px; width: 300px">
    <canvas #myChart>{{doughnut}}</canvas>
  </div>
  `,
  styleUrls: ['./app.component.css']
})
export class AppComponent implements OnInit {

  public doughnut = [];
  @ViewChild('myChart') chart: ElementRef;

  ngOnInit() {
    this.doughnut = new Chart(this.chart.nativeElement, {
      type: 'doughnut',
      data: {
        labels: ['a', 'b', 'c', 'd'],
        datasets: [{
          backgroundColor: '#2c82be',
          data: [12, 34, 23, 65],
          datalabels: {
            anchor: 'end'
          }
        }]
      },
      options: {
        responsive: true,
        maintainAspectRatio: false,
        plugins: {
          datalabels: {
            backgroundColor: function (context) {
              return context.dataset.backgroundColor;
            },
            borderColor: 'white',
            borderRadius: 25,
            borderWidth: 2,
            color: 'white',
            font: {
              weight: 'bold'
            },
            formatter: Math.round
          }
        },
        legend: {
          display: true
        },
      }
    });
  }
}
The chart is created but not the labels.
Any help is appreciated.
Edit(SB): code formatting
I'm trying to show font awesome (4.7) icons as data labels, which seems like it should work because other unicode characters in other font families seem to work ok. Is there something else I should be doing besides the following?
this.options = {
    plugins: {
        datalabels: {
            color: 'white',
            display: context => {
                return context.dataset.data[context.dataIndex] > 15;
            },
            font: {
                weight: 'bold',
                family: 'FontAwesome',
                style: 'normal'
            },
            formatter: (value, context) => {
                return `\\u${context.dataset.icon_code}`;
            }
        }
    },
    ...
}
I've tried to install this plugin with npm but it returned 404.
https://www.npmjs.com/package/chartjs-plugin-datalabels -> not found.
https://libraries.io/bower/chartjs-plugin-datalabels -> We can't find whatever it was you were looking for.
Hi,
I have the following values : [ "2", "10", "50", "120" ]
And in my config :
datalabels: {
...
display: function(context) {
return context.dataset.data[context.dataIndex] > 10;
},
}"
Is there a solution to display the value only if it is higher than 10% of the max value ?
...
return context.dataset.data[context.dataIndex] > (maxval * 10 / 100);
...
Result : only "50" and "120" are displayed
Thanks a lot,
It would be nice to add the option to show text stroke.
I now modify the code after line 402 to hard implement this:
    ctx.font = model.font.string;
    ctx.fillStyle = color;
    ctx.textAlign = align;
    ctx.textBaseline = 'middle';
    ctx.lineWidth = 4;
    ctx.lineJoin = 'round';
    ctx.miterLimit = 0;
    ctx.strokeStyle = '#ffffff';

    for (i = 0; i < ilen; ++i) {
        ctx.strokeText(
            lines[i],
            Math.round(x),
            Math.round(y),
            Math.round(rect.w));
        ctx.fillText(
            lines[i],
            Math.round(x),
            Math.round(y),
            Math.round(rect.w));

        y += lh;
    }
Hi,
I have simply added the plugin to my codebase and the labels showed up on the line chart.
However on column and bar charts there a re no labels.
My config for the charts is basic - I don't do any configuring.
I use angular-charts wrapper btw.
Do I have to handle bar charts specifically. As i noticed from your example I don't?
Thanks
First of all thanks for your work on this plugin, much appreciated.
Right now, when adding the script to page or importing it, it automatically add itself to all charts, which is quite a big assumption on how it's to be used and requires a lot of work to disable it on instance to instance basis.
Are there any plans to improve the display of labels in pie charts? Currently I have situations like this:

I'm not sure what is the best way to solve it, perhaps adding a minimal y-offset to each label until each one is visible?
I'm looking to implement functionality that will display label inside or outside of bar, depending on how much space is available. The way I've set to do this is by passing a function to align and then doing some calculations based on x,y coordinates of individual charts and chart size.
The sample code below works, but to it uses a fixed threshold, where I would like to compute it based on label width/height.
datalabels: {
    align: context => {
        let meta = context.chart.getDatasetMeta(context.datasetIndex),
            bar = meta.data[context.dataIndex]._model,
            threshold = 15
            // label = context.chart['$datalabels'].labels[context.datasetIndex][context.dataIndex]._model;

        if (bar.y + threshold > context.chart.chartArea.bottom) {
            return 'end'
        }
        return 'start'
    }
}
I've tried using label (commented in above code) to try and get sizing info, but all seem to be null on first pass (_model, _hitbox._rect, ...)
Any ideas, suggestions? Thanks.
Hi,
I have a horizontal stacked bar chart which looks like this:
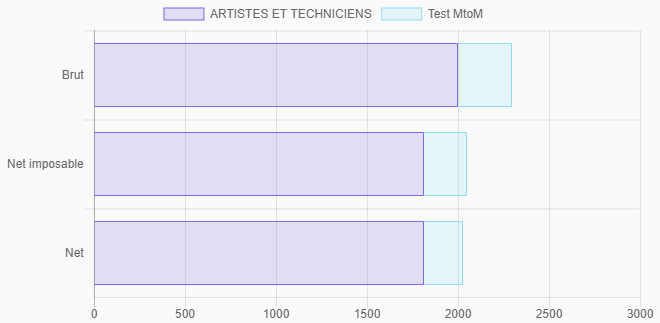
And I would like to display the sum of each stacked bar, like so:

I managed to get this result by returning an empty string for datasets that are not the last one (datasetIndex), and computing the sum for each bar (dataIndex):
plugins: {
	datalabels: {
		formatter: (value, ctx) => {
			let datasets = ctx.chart.data.datasets; // Tried `.filter(ds => !ds._meta.hidden);` without success
			if (ctx.datasetIndex === datasets.length - 1) {
				let sum = 0;
				datasets.map(dataset => {
					sum += dataset.data[ctx.dataIndex];
				});
				return sum.toLocaleString(/* ... */);
			}
			else {
				return '';
			}

		},
		anchor: 'end',
		align: 'end'
	}
}
It works great, but if I toggle off one dataset (via the chart's legend), the result is less great:
if I toggle off the first dataset, I still have the sum of the two datasets as a label:

if I toggle off the last dataset, I don't have a label anymore:

As I commented in my code snippet, I tried to filter out the datasets with the _meta.hidden metadata, but it seems that the formatter function is not called again when toggleing datasets via the chart's legend.
Is there a better way to use datalabels with stacked bar charts? Or does anyone have an idea to make it work?
In "chartjs-plugin-datalabels" npm package (version 0.2.0 and 0.3.0) there's 12 MB "cc-test-reporter" file.
You sample files are seeking the main JS file to do the work of labelling, and not finding it
How are we supposed to use this?
Failed to load resource: net::ERR_FILE_NOT_FOUND chartjs-plugin-datalabels-master/dist/chartjs-plugin-datalabels.js
No such file exists anywhere in the project that I got either from Git Desktop or from downloading the zip file
Hi, i've got a chart, with value labels placed inside the bar.
There is an overlapping between the labels and the chart itself.
Anyone have any idea why this would be happening?
Thanks in advance!
options: {
    legend: {
        display: false
    },
    layout: {
        padding: {
          top: 20
        }
    },
    showLabelsOnBars:true,
    barLabelFontColor:"gray",
    animation: {
        duration: 0
    },
    scales: {
        yAxes: [{
            stacked: true,
            display: false,
            ticks: {
                beginAtZero:true
            }
        }],
        xAxes: [{
            stacked: true,
            id:"ejeX",
            ticks: {
                beginAtZero:true,
                fontSize: 30
            }
        }]

    },
    plugins: {
        datalabels: {
            color: 'black',
            font: {
                size: 24
            },
            formatter: function(value, context) {
                return Number(value).toLocaleString('es-ES');
            },
            display: true
        }
    }
}

Is it possible to hide the labels as default and only show them when hovering the bar?
Thanks in regards!
Hello,
I have a chart, i am adding an image of it. Is there a chance to hide zero values on bars ?

Hello, I'm having trouble finding a way to distance the value from the label of a Bar in a vertical Bar chart from the Bar itself. Is this a feature that does not exist, or am I just overlooking something?
Thanks for your attention.
I've got an array of data points, and another one of data label strings. I'm graphing the points and would like to use the strings as labels. How do I use this plugin to do so? Here's what I've got right now:
datasets: [{
  label: 'Phenological States',
  data: phenoArray(historicalData).values,
  datalabels: phenoArray(historicalData).labels,
  // ...
}]Edit(SB): code formatting
Is there any way to prevent this?


I specifically ordered the datasets so that the lines would appear in front of the bars. I was wondering if there was a way to have the bar labels in front of the lines.
GULP fails to build.
I installed GULP through npm install gulp in the root directory.
Windows 10 64-bit:
When I type gulp build in the root directory, I get:
C:\GIT\chartjs-plugin-datalabels>gulp build
module.js:471
    throw err;
    ^

Error: Cannot find module 'yargs'
    at Function.Module._resolveFilename (module.js:469:15)
    at Function.Module._load (module.js:417:25)
    at Module.require (module.js:497:17)
    at require (internal/module.js:20:19)
    at Object.<anonymous> (C:\GIT\chartjs-plugin-datalabels\gulpfile.js:3:28)
    at Module._compile (module.js:570:32)
    at Object.Module._extensions..js (module.js:579:10)
    at Module.load (module.js:487:32)
    at tryModuleLoad (module.js:446:12)
    at Function.Module._load (module.js:438:3)
I was hoping to get it as Chart.js pie or bar fail to draw labels inside or outside (I want their percent values displayed so I can print them) but it looks as if that plugin is not supported any longer.
Hi,
Is there any way to make the anchor/alignment/offset dynamic but fixed? Like make it a callback or something else?
I am setting up the position of labels in the chart but for some cases the position of labels is not perfect, like the 11% in the pic

Everything was fine but when I added the datalabels plugin (as described in #10) then I started getting this error
BaseCharts.js?a889:56 Uncaught (in promise) TypeError: Cannot read property 'getContext' of undefined
    at VueComponent.renderChart (BaseCharts.js?a889:56)
    at VueComponent.boundFn [as renderChart] (vue.esm.js?efeb:189)
    at VueComponent._callee$ (BalanceChart.vue?7315:56)
    at tryCatch (runtime.js?4a57:62)
    at Generator.invoke [as _invoke] (runtime.js?4a57:296)
    at Generator.prototype.(:8080/anonymous function) [as next] (webpack-internal:///./node_modules/regenerator-runtime/runtime.js:114:21)
    at step (asyncToGenerator.js?7b11:17)
    at eval (asyncToGenerator.js?7b11:28)
BaseCharts.js
      renderChart: function renderChart(data, options) {
        this.$data._chart = new Chart(this.$refs.canvas.getContext('2d'), {
...
Currently, I have issues using this library with my typescript project; could you include a TypeScript types definition file?
Many thanks.
Hello thank you for your plugin there is a gap by displaying labels in mixed charts looks like a bug when the axis min is not 0, the label is at the bar bottom, but the bar bottom is out of the canvas (clipped)
https://jsfiddle.net/bistok/1h4nhtq2/6/
i want to have the barlabels at the start of the bars but the start is out of canvas?
Edit(SB): fix link
Hi, i am actually trying to add this plugin to a vue.js project using vue-chartjs and i have no idea how to do it. I installed chartjs-plugin-datalabels using node but then what should i do?
I'm using chartjs-plugin-datalabels in my React app using React Chart.js 2.
I couldn't find the proper way to import the plugin and register it on the chart instance, so I ended up just doing import 'chartjs-plugin-datalabels' which automatically added the plugin to all charts. Fine, that's what I was going to do anyway.
But is there a better/more proper way?
Issues for React Chart.js 2 didn't have an answer, so I posted my solution.
data: {
    datasets: [{
        label: 'My Label',
        data: <?php echo json_encode($myData); ?> // contains number like: 77.43, 78.22, etc. I want output like: 77.43%, 78.22%, etc on datalabel
        datalabels: {
            align: 'end',
            anchor: 'end'
        }
    }],

    labels: <?php echo json_encode($myLabel); ?>
}
I have some codes like that, and I think it will be good if there is an option to give string '%' on each values of datalabel
What is seems to do is that it is not picking up the options correctly, the barchart labels are falling off the chart. Here is what my barchart component looks like
<script>
import VueChartjs from 'vue-chartjs'
export default {
	extends: VueChartjs.Bar,
	props: ['data', 'barWidth'],
	data() {
		return {
			options: {
				plugins: {
					datalabels: {
						color: "white",
						display: function(context) {
							return context.dataset.data[context.dataIndex] > 0;
						},
						font: {
							weight: 'bold',
							size: '14'
						},
						formatter: Math.round
					}
				},
				responsive: false,
				maintainAspectRatio: false,
				tooltips: false,
				legend: {
					display: false
				},
				scaleShowVerticalLines: false,
				scales: {
					yAxes: [{
						display: false,

						ticks: {
							display: false
						}
					}],
					xAxes: [{
						barPercentage: this.barWidth
					}]
				}
			}
		}
	},
	mounted() {
		this.renderChart(this.data, this.options)
	}
}
</script>
If I log this.options it returns me everything, recently I had the same issue deleting the node_modules and yarn install solved it but not it seems not to work..
Here you see an result of what i describe above:
https://user-images.githubusercontent.com/12531305/35614529-b2c2452c-066f-11e8-820d-95dd006effab.png
Environment
vue.js version: ^2.5.2
vue-chart.js version: ^3.0.0
npm version: 5.6.0
chartjs-plugin-datalabels": "^0.1.0",
I'm getting the following messaged when doing npm install:
> 2017-12-07T13:59:43.6102420Z npm http fetch GET 200 https://registry.npmjs.org/chartjs-plugin-datalabels 125ms
> 2017-12-07T13:59:43.6102420Z npm sill pacote range manifest for chartjs-plugin-datalabels@^0.1.0 fetched in 157ms
dependencies:
{
  "axios": "^0.17.1",
  "bulma": "^0.6.1",
  "moment": "^2.19.2",
  "vue": "^2.5.4",
  "vue-router": "^3.0.1",
  "chart.js": "^2.7.1",
  "chartjs-plugin-datalabels": "^0.1.0"
}
Any idea what I may be missing?
Edit(SB): code formatting
I'd like to include a line chart in my webapp that has similar capabilities as the Google Annotation Chart:

I'd really like to use Chart.js for this but after hours of researching I still don't have a working solution.
The datalabels plugin seems perfect for this but I would need a click handler where I can identify the data point the label belongs to. I tried to listen to Chart.js events, but when I call getElementAtEvent(event) I don't get any results. I guess this has to do with the fact that datalabels is a plugin, so Chart.js can not identify the label.
I also tried to use chartjs-plugin-annotation, which has click handler support. But here I struggle to place the annotation at the correct position. Additionally the box annotations seem to lack the possibility to display a label.
Here is an example to demonstrate my problem: https://jsfiddle.net/w52twy01/
Thanks in advance!
Hi, I'm trying to make both plugin data labels as well as X-Axis tick labels responsive so they change font size according to screen resolution. I couldn't find any solution to this issue and so far a simple bar chart does not resize properly as labels start to overlap and don't fit the boundaries.
I tried to change font size dynamically by adding a plugin:
plugins: [{
    beforeDraw: function(c) {
      var chartHeight = c.chart.height;
      c.scales['x-axis-0'].options.ticks.fontSize = chartHeight * 4 / 100;
    }
  }],
but it does nothing.
Is there any way to achieve that?
Thank you
Edit(SB): snippet has been moved in this jsfiddle
Want to know if there is any way to move data label on top of the bar rather than start,center and End.
I want to move data label to move few pixels away from label in horizontal bar chart. Is there any attributes to achieve this?
A declarative, efficient, and flexible JavaScript library for building user interfaces.
🖖 Vue.js is a progressive, incrementally-adoptable JavaScript framework for building UI on the web.
TypeScript is a superset of JavaScript that compiles to clean JavaScript output.
An Open Source Machine Learning Framework for Everyone
The Web framework for perfectionists with deadlines.
A PHP framework for web artisans
Bring data to life with SVG, Canvas and HTML. 📊📈🎉
JavaScript (JS) is a lightweight interpreted programming language with first-class functions.
Some thing interesting about web. New door for the world.
A server is a program made to process requests and deliver data to clients.
Machine learning is a way of modeling and interpreting data that allows a piece of software to respond intelligently.
Some thing interesting about visualization, use data art
Some thing interesting about game, make everyone happy.
We are working to build community through open source technology. NB: members must have two-factor auth.
Open source projects and samples from Microsoft.
Google ❤️ Open Source for everyone.
Alibaba Open Source for everyone
Data-Driven Documents codes.
China tencent open source team.