Workflow Diagram is used to create nodes with operations and connections between them, and then use runner which visits these nodes and execute node's operations. Workflow diagram comes with Visual Designer written for Windows Forms and using DevExpress WinForms components.
Please note that according to DevExpress EULA, every person working with DevExpress components should have a separate license. To properly register their components on your machine, use the DevExpress installer as described in the How to activate my DevExpress license article. Working with DevExpress components using libraries got from NuGet without proper registration may result in licensing violation.
Please refer How To Install DevExpress WinForm Components article to know how to install this suite on your machine and update the project.

Simple example:
WfDocument doc = new WfDocument();
WfRunner runner = new WfRunner(doc);
bool result = runner.RunOnce(doc);
In this example we create empty workflow document and execute it. This example does nothing, as well as most of managers. More complicated example:
WfDocument doc = new WfDocument();
WfConstantValueNode const1 = new WfConstantValueNode(1.0);
doc.Add(const1);
WfConstantValueNode const2 = new WfConstantValueNode(2.0);
doc.Add(const2);
WfConditionNode cond1 = new WfConditionNode(WfConditionalOperation.Equal);
doc.Add(cond1);
const1.Outputs[0].ConnectTo(cond1, "In1");
const2.Outputs[0].ConnectTo(cond1, "In2");
WfStorageValueNode stTrue = new WfStorageValueNode("Condition True");
doc.Add(stTrue);
WfStorageValueNode stFalse = new WfStorageValueNode("Condition False");
doc.Add(stFalse);
cond1.Connect("False", stFalse, "Run");
cond1.Connect("True", stTrue, "Run");
WfRunner runner = new WfRunner(doc);
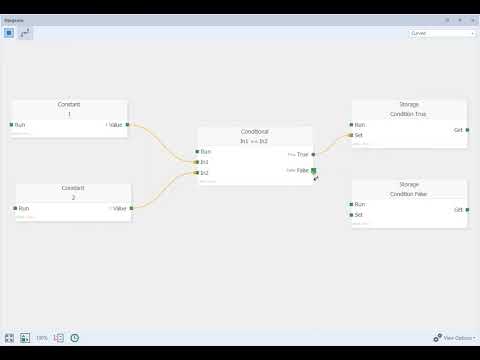
bool result = runner.RunOnce(doc);In this example we create two nodes, containing double constant value 1 and 2. Then we connect outputs of these nodes to node which has two inputs and makes logical operation on values receiving through its inputs. Then each output of this node connects to node, which saves result of the operation to the global storage. Here is the visualization of this workflow:

Of course, this is very simple example that has a less logic, but you've got the idea.
You can easily create your own nodes, define inputs which can accept this node, and outputs that this node can produce. The base class from your can create your own descendants is the WfNode class. However, if you wish your node support Visual Designer for Windows Forms, please use the WfVisualNodeBase class.
There is already a pack of nodes created to implement essential programming. Constants, values, conditional and loop nodes, expressions and others. Here is the complete list:
Each of these nodes can be created and designed in Workflow Diagram's Visual Designer.
Visual Designer is the descendant of the UserControl class, which you can use in your project, which allows your end-users to create and execute workflow diagram.
Heare are the examples
You created your own set of nodes, which allows to make algorithmic trading on crypto exchanges. Or you created advanced arithmetic operation nodes, which operates on time series and visualizer the operation results. Or your app allows to create application scheme and generates application based on this scheme. Or you want to create application which allows to create procedure generated landscapes.
The visual editor adds to your project a flexible customization and design.
Here is my example. I created CryptoTradingFramework application which supports Strategies. I created a set of nodes which allows my user creates their own strategy, test them on historical data and, using only visual design (ok, I not finished it yet ).

Visual Designer is the multi-document application. It supports standard file operations such as create new, open, save, save as. Also, it supports the Initialize, Run, Run Once commands for document. It is very well optimized, supports High DPI monitors and multi-monitors.
On the left side there is Toolbox window, that contains a set of available nodes, that user can create. To create the desired node, drag and drop this node on the Diagram area (Diagram window).
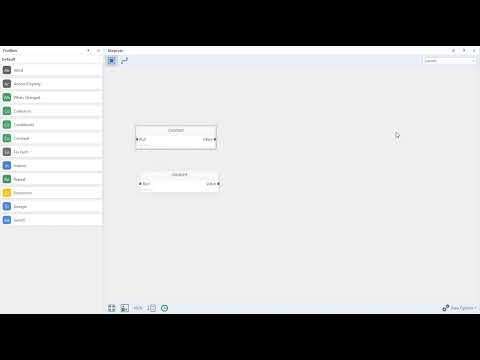
If one wish to connect nodes, he should select connection mode be clicking Connect Nodes command from the upper diagram toolbar or to press Alt+C shortcut.
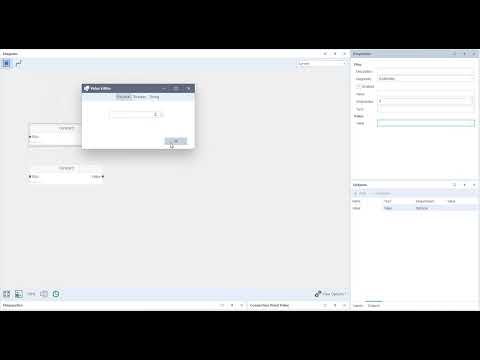
To specify node’s parameters, please select the desired node. After that it’s parameters will be displayed in the Properties window. Use editors in this window to change node’s parameters.
After creating and configuring nodes, one can execute workflow. To do this, one should click RunOnce or Run command.

