Git Product home page Git Product logo

gemgis's Introduction

Spatial data and information processing for geomodeling and subsurface data

PyPI PyPI Conda GitHub Binder Read the Docs DOI DOI DOI Project Status: Active – The project has reached a stable, usable state and is being actively developed. PyPI - Python Version

Overview

We attempt to simplify the access to open-source spatial data processing for geological modeling and for subsurface data (wells, seismic, etc.) with the development of GemGIS, a Python-based open-source library.

GemGIS wraps and extends the functionality of packages known to the geo-community such as GeoPandas, rasterio, OWSLib, Shapely, PyVista, Pandas, NumPy and the geomodeling package GemPy.

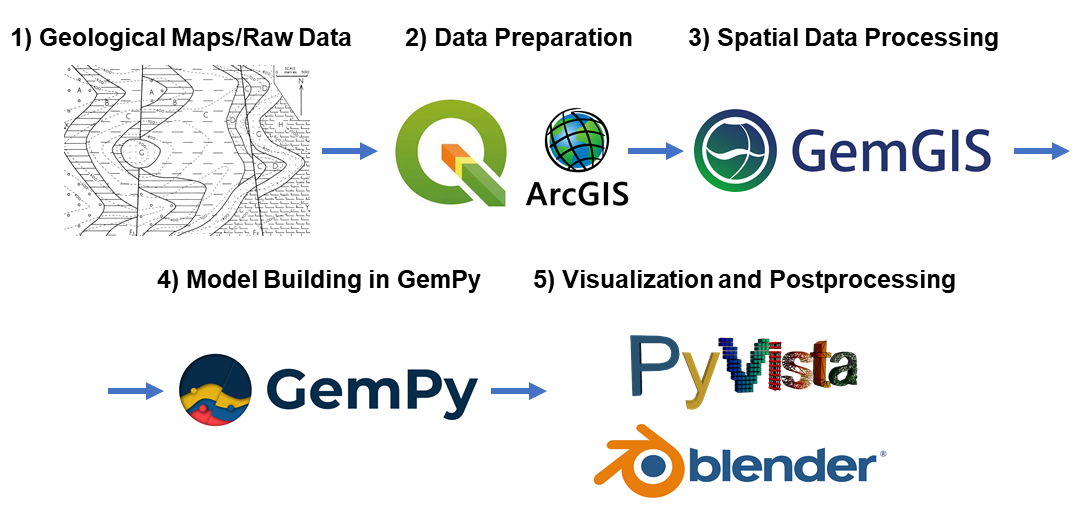
The aim of GemGIS, as indicated by the name, is to become a bridge between conventional geoinformation systems (GIS) such as ArcGIS and QGIS, and geomodeling tools such as GemPy, allowing simpler and more automated workflows from one environment to the other. This also includes making it simpler to visualize the results obtained from GemGIS and GemPy with PyVista or Blender. Further, subsurface data processing workflows are implemented for integrated data analyses.

Resources

Find the documentation of GemGIS here. It includes introductions to the main libraries used and to introductory topics like "What is vector data?" or "What is raster data?".

In addition, tutorial notebooks provide an overview of the different features of GemGIS. The notebooks can also be downloaded directly from here. Furthermore, many example models showcase a variety of geological structures that can be modeled with GemGIS and GemPy. The API Reference provides an overview of the implemented functions in GemGIS and how to use them.

Installation

It is recommended to use GemGIS with python">=3.10" in a separated environment. The main packages and its dependencies can be installed via the conda-forge channel. GemGIS is then available through PyPi or Conda.

  1. conda install -c conda-forge geopandas">=0.13.2" rasterio">=1.3.8"
  2. conda install -c conda-forge pyvista">=0.42.1"
  3. pip install gemgis / conda install -c conda-forge gemgis

Check out the Installation Page for more detailed instructions.

If you are an open-source software developer, please install GemGIS and its dependencies, also for building the documentation, using the development YML file.

Contribution Guidelines

The Contribution Guidelines for GemGIS can be found here: Contribution Guidelines

We welcome issue reports, questions, ideas for new features and pull-requests to fix issues or even add new features to the software. Once a pull-request is opened, we will guide through the review process.

References

  • Jüstel et al., (2023). From Maps to Models - Tutorials for structural geological modeling using GemPy and GemGIS. Journal of Open Source Education, 6(66), 185, https://doi.org/10.21105/jose.00185
  • Jüstel et al., (2022). GemGIS - Spatial Data Processing for Geomodeling. Journal of Open Source Software, 7(73), 3709, https://doi.org/10.21105/joss.03709
  • Jüstel, A., Endlein Correira, A., Wellmann, F. and Pischke, M.: GemGIS – GemPy Geographic: Open-Source Spatial Data Processing for Geological Modeling. EGU General Assembly 2021, https://doi.org/10.5194/egusphere-egu21-4613, 2021
  • Jüstel, A.: 3D Probabilistic Modeling and Data Analysis of the Aachen-Weisweiler Area: Implications for Deep Geothermal Energy Exploration, unpublished Master Thesis at RWTH Aachen University, 2020
  • de la Varga, M., Schaaf, A., and Wellmann, F.: GemPy 1.0: open-source stochastic geological modeling and inversion, Geosci. Model Dev., 12, 1-32, https://doi.org/10.5194/gmd-12-1-2019, 2019
  • Powell, D.: Interpretation of Geological Structures Through Maps: An Introductory Practical Manual, Longman, pp. 192, 1992
  • Bennison, G.M.: An Introduction to Geological Structures and Maps, Hodder Education Publication, pp. 78, 1990

gemgis's People

Contributors

1jdjdjd1 avatar alexanderjuestel avatar banesullivan avatar bluetyson avatar elbeejay avatar endarthur avatar flohorovicic avatar japhiolite avatar jonititan avatar leguark avatar nilschudalla avatar richardscottoz avatar

Stargazers

 avatar  avatar  avatar  avatar  avatar  avatar  avatar  avatar  avatar  avatar  avatar  avatar  avatar  avatar  avatar  avatar  avatar  avatar  avatar  avatar  avatar  avatar  avatar  avatar  avatar  avatar  avatar  avatar  avatar  avatar  avatar  avatar  avatar  avatar  avatar  avatar  avatar  avatar  avatar  avatar  avatar  avatar  avatar  avatar  avatar  avatar  avatar  avatar  avatar  avatar  avatar  avatar  avatar  avatar  avatar  avatar  avatar  avatar  avatar  avatar  avatar  avatar  avatar  avatar  avatar  avatar  avatar  avatar  avatar  avatar  avatar  avatar  avatar  avatar  avatar  avatar  avatar  avatar  avatar  avatar  avatar  avatar  avatar  avatar  avatar  avatar  avatar  avatar  avatar  avatar  avatar  avatar  avatar  avatar  avatar  avatar  avatar  avatar  avatar  avatar

Watchers

 avatar  avatar  avatar  avatar  avatar  avatar  avatar  avatar  avatar  avatar  avatar  avatar  avatar  avatar  avatar  avatar  avatar  avatar

gemgis's Issues

Load Elevation from WMS

(How) is it possible to get the absolute elevation of my pixels in the picture? With load_as_map or load_as_array I only get the relative values as colours.
I want to use a WMS as a digital terrain model (DTM).

Add support of XML/KML files through remote-geomod

Is your feature request related to a problem? Please describe.
Methods to handle geographic data

Describe the solution you'd like
Handling different coordinate systems and projections, methods to read and translate different types of geographic information (kml-files, shape files, etc).

Describe alternatives you've considered
n/a

Additional context
Can - at least partly - be based on remote-geomod, but surely needs a bit more thought for tighter integration.

Integrate WMS data

Is your feature request related to a problem? Please describe.
If you doesn't have a DTM of your area you could get it from a WMS service in the internet or you could expand your information by overlaying the DTM with a topographic/geological map.

Describe the solution you'd like
Add and cut WMS data to the study area and colouring the DTM simply by inserting a WMS-link to a function.

grafik
Blue points are boreholes (Picture source)

Create 2D cross section

Dear all,
I would like to create the attached file.
Can anyone help me?

Regards,
Mohammad
2d_cross section

[ENH] Return lith_block cropped to topography using pvgeo

Putting this in a separate issue since it's just a small question. :)

Is it possible to return a lithology array where all cells above the land surface have been filled with NaNs or zeros?
It looks like you have something set up for it with sol.mask_topo(), but there's not quite enough documentation for me to figure out how to do it.
sol.mask_topo(sol.mask_matrix) gives me a dimension error because one is 1D and one is 3D.

Tutorial Notebook about von Mises Fisher Distribution

Is your feature request related to a problem? Please describe.
Currently there is only tutorial 5.1 on how to add uncertainties for interface positions. A tutorial/notebook for adding uncertainties for orientations is missing.

Describe the solution you'd like
I would like to create a notebook using the code by @elimh (fishdist.py) to better illustrate how uncertainties can be assigned to orientation values so that future users have better access to it

Create Function to reproject vector data

Describe your feature:

Create a function that will reproject loaded vector data to another coordinate reference system (CRS).

Usage:

  • Reproject data if data is not in the desired CRS
  • Reproject data to WGS84 for the usage in ipyleaflet

More information to this issue will be added.

Create functionality to select and deselect data and to sample data

Create functionality to select and deselect data and to sample data to create a GemPy Model. This will decrease the time that is needed to always add or delete formations from a dataframe.

So, if a formation is selected, it will be passed to GemPy, if not, it will be excluded. In a similar way, we could add a field that takes an integer defining the number of points that the user wants to use for the model.

Screen-Shot-2015-11-08-at-10-12-05-AM

Creating a 3D velocity model in GemPy

Hi All,

Started recently to work with GemPy, targeting automatic generation of realistic 3D velocity models. So far, I have not found a simple way to perform this, and wondered if anyone has accomplished this before, or saw sample code that performs this?

Best,

Amir

Roadmap for GemGIS 1.0

A roadmap for GemGIS:

What is the aim of GemGIS?
Providing a way to interactively select/add/edit/delete input data of all kinds that is needed for GemPy. Make it easy for beginners to build a first model (geological knowledge and some coding expected).

What do we need for that?

  • A tool to display map data and to interactively select and store data automatically. It should be easy and intuitively to handle. A very important aspect is that we avoid changing/protecting existing data unless you want to and that it is easier to add data for a particular surface, similar to editing features in QGIS rather than filling out the table maybe.

  • Simple vector and raster manipulation tools in the background of GemGIS, especially reprojection of data.

  • Extraction of points/vertices from rasters and vector files.

  • Ability to import styles from QGIS to color your data.

  • Maybe some statistic tools or plots such as the frequency of selected interfaces for each surface or stereonets (partly possible with GemPy already).

  • Ability to georeference geological maps (setting the extent of an array in its simplest form) for point selection afterwards - https://rasterio.readthedocs.io/en/latest/topics/georeferencing.html

  • Ability to create a topography based on digitized contour lines or a line shape file.

(The last two points could be interesting for teaching purposes where students could digitize a map and create a GemPy model afterwards)

  • The output of GemGIS could be a data object containing different attributes such as the crs, the extent, the interfaces, orientations, custom_sections, the topography, the layer stack etc. which could directly be passed to GemPy to create a model.

Which tools do we have already?

image

Add vector data to plot_data(geo_model,...)

Is your feature request related to a problem? Please describe.
It is not related to a problem.

Describe the solution you'd like
Since many Geological Maps and fault traces are available as vector datasets, it should be possible as an option to display these maps and line features below the input data. This is similar to issue gempy-project/gempy#370. A solution could look like the screenshot below. This may help the geologist/user to get a better feeling of the spatial distribution of the data and aid during the modeling process. It may also help when actually loading data into GemPy to ensure that all (relevant) faults and lithological boundaries have been obtained if the geological map is one of the main sources of data for instance. Especially for placing necessary orientations or interfaces in fault blocks which currently don't have any and may cause a LinAlgError ;)

Shape files can easily be read in with geopandas and easily be plotted below the shown input data.

Additional context
I would like to implement the feature myself if it is deemed useful :)

image

geology = gpd.read_file(os.pardir+'/Data/VectorData/GeologicalMapAachen.shp')
ax = cols =[ ('#7fa056'),  ('#67a599'),('#7fc64e'), ('#cb8c37'), ('#f2f91d'), ('#009270'), ('#f2f91d'),('#812b92')]
geology.plot(ax = ax, alpha=0.25, edgecolor='k', linewidth=0.1, column='SYSTEM1', cmap = ListedColormap(cols))

base_tertiary_interfaces.plot.scatter(ax = ax, x= 'X', y = 'Y', c = base_tertiary_interfaces['formation'].apply(lambda x: interfaces_colors[x]), s = 50, label =base_tertiary_interfaces['formation'].unique())

plt.grid()
plt.xlim(minx,maxx)
plt.ylim(miny,maxy)
plt.ylabel('Y [m]')
plt.xlabel('X [m]')
plt.legend()
plt.gca().set_aspect("equal")
plt.title('Number of Interfaces: %d' % len(base_tertiary_interfaces))
print('Number of Interfaces: %d' % len(base_tertiary_interfaces))
base_tertiary_interfaces.head()

Add labeling options for PyVista Plots

Add the possibility to add labels (city names or names of structural elements) to PyVista plots. This can easily be done by loading CSV files or vector files (points). This would enhance the interpretation of output data as the viewer can locate the map right away.

Integration with QGis

Test possibility for a tighter integration with QGis: reading shape files, exporting GeoTiffs back to project (similar to GE link)

Add TIFF support for Image Overlay

Currently, raster files have to saved as PNG files in order to be displayed as an image overlay. This will create an additional file on the local.

However, it should be possible to directly load TIFF files as image overlays or at least store them temporarily so that no new file is being created.

Code Samples and Examples that could be provided for GemPy/GemGIS after the thesis

This is a list of examples that I would like to provide to the GemPy project after my thesis:

  • Function to create depth maps for a single surface - Implemented in GemGIS

  • Example on how to draw random values from a von Mises Fisher Distribution (based on the works of @elimh and help of @Japhiolite :)). I may also be considered reworking fishdist.py due to an outdated spherecluster package - gempy-project/gempy#30, #38, gempy-project/gempy#475

  • Example of a simple model of a fold and thrust belt for the Sphinx gallery

  • Example/Tutorial on how to get larger datasets more efficiently into GemPy utilizing the capabilities of GeoPandas and Rasterio (working with spatial data) and later hopefully with GemGIS - Implemented in GemGIS

  • Model of my thesis as "PyVista Project" -> providing the vertices and edges to calculate meshes and view the model in PyVista, no input data though

  • Function to extract a vertical synthetic borehole - Implemented in GemGIS

  • Prepare Kartenkunde Examples as GemPy Model - currently done in GemGIS

  • Create GemPy models from cross-sections of von Winterfeld (1994) and Ribbert et Wrede (2005)

  • Create animations from Cross Sections - See Elisa's Notebook

  • Create 2D plot of cross-sections #35

  • Create 3D plot of cross sections #36

  • Create 3D plot of Uncertainties and Information Entropy

  • Function to plot well paths in PyVista according to lithology and plotting well logs with the radius of the well as a function of a log value

More examples to come maybe :)

Add support for GeoDataFrames to GemPy

GemPy currently works with pandas DataFrames. Geopandas is an extension to pandas which allows for spatial operations on data. This includes selection of data within a given area, checking whether one geometry contains another, intersections and so on.

To switch from a DataFrame to a geoDataFrame requires the addition of coordinates and a CRS. They can be added either automatically by importing a spatial file format (.shp, .gpkg) or by converting a given geometry column and assigning a CRS to the metadata. This will also create a spatial index which can be used to query the DataFrame based on location, in addition to other attributes.

In principle, this is a fairly simple change, and should in most cases be non-breaking, since all the normal methods for DataFrames are available to GeoDataFrames. The advantage will be in gaining the ability to query parts of a model spatially: one could subset an existing model's points by eastings and northings or similar.

In the absence of a geometry, GemPy should fall back on using a standard DataFrame as it already does.

Terminology - energy/mining

Just a style thing, but I noticed 'wells' mentioned. e.g. not everything under the ground is liquid? So could make that more general?

Add support to read CSV files as GDF

We should be able to read CSV files with Pandas, assign a geometry column and crs and return a GeoDataFrame

See here:

gemgis/gemgis/utils.py

Lines 642 to 649 in 3f0fe53

# TODO: Load CSV as GeoDataFrame
#import pandas as pd
#import geopandas as gp
#from shapely.geometry import Point
#stations = pd.read_csv('../data/stations.csv')
#stations['geometry'] = stations.apply(lambda z: Point(z.X, z.Y), axis=1)
#stations = gp.GeoDataFrame(stations)

Add 2D cross section plot for geological interpretations

Is your feature request related to a problem? Please describe.
When producing a large number of profiles, it may be easier to view them in a way as shown below. Here, the plots were flipped to the surface to allow following the evolution of geological features across the working area.

Describe the solution you'd like
It should be able to plot x or y cross sections at a certain increment like shown below but also custom sections. In addition, it should be possible to adjust the vertical exaggeration.

CrossSections

Add plot of stack of 3D sections for geological interpretations

Is your feature request related to a problem? Please describe.
When looking at a 3D model in PyVista, it could be useful to be able to generate plots like shown below or even with a focal point that shows the "depth" of the model. This would help illustrating the evolution of a feature within the model.

Describe the solution you'd like
It should be possible to display slices in a certain cell increment (x,y, or z direction) or selected/all custom sections

As reference:
docs.pyvista.org/examples/01-filter/slicing.html

image

Thickness and Depth Maps for geological Interpretations

Is your feature request related to a problem? Please describe.
For a geologist, it is vital to describe the depth of a layer in the underground. This could be relevant for geothermal exploration (depth of the target layers) or in general to describe the setting of a layer.
In addition, the thickness of a layer may provide insights about local depocenters or just how thick the layer is across the whole model area (where does my reservoir have the highest thickness).

Describe the solution you'd like
It would be great to have the possibility to plot the surface and its color as a function of the depth or thickness like commercial software is capable of. This could go in hand with a better method to select single layers for plotting next plot_all_surfaces.

Describe alternatives you've considered
None but it should be fairly simple if one can access the different meshes and their attributes...

Add Option to display topography as well

Create temperature maps for PyVista Visualization

Create Temperature Maps to visualize a first-order approximation of the temperature at depth based on a provided geothermal gradient. Later, this could be expanded to also account for different thermal conductivity values of the different lithologies.

Geological Model Explanations et al.

Your average person won't know azimuth from agate. Obviously geoscientists a different story but they won't know dataframes from dolomite.

Don't know if you are going to throw this at some undergrads or anything but looks like it is evolving into more 'introduction to'.

So perhaps a little bit on what a surface is, why anyone cares about orientations, how to get them. A dataframe is sort of a table with an index, that sort of thing?

Utility functions that make them automatically from DEMs sounds great, really.

I think at a basic level lat/lon (everyone understands mostly) geopands/rasterio/fiona - shapefiles and tifs are good common denominators, along with geojson.

Create Function to reproject raster data

Describe your feature:

Create a function that will reproject loaded raster data to another coordinate reference system (CRS). Rasters can also be referenced to as tiles (ipyleaflet).

Usage:

  • Reproject data if data is not in the desired CRS
  • Reproject data to WGS84 for the usage in ipyleaflet

More information to this issue will be added.

Create Function to extract (vertical) boreholes from GemPy + Visualization

This can easily be done using GemPy. The visualization of the borehole data needs to be adapted.

Below just a very quick example. The colors are according to the lithology ids.

What else is needed?

  • Removal of data above topography

  • Indications of faults in the log

  • Indication of depth of interfaces -> create function to export dictionairy containing this data

image

Recommend Projects

  • React photo React

    A declarative, efficient, and flexible JavaScript library for building user interfaces.

  • Vue.js photo Vue.js

    🖖 Vue.js is a progressive, incrementally-adoptable JavaScript framework for building UI on the web.

  • Typescript photo Typescript

    TypeScript is a superset of JavaScript that compiles to clean JavaScript output.

  • TensorFlow photo TensorFlow

    An Open Source Machine Learning Framework for Everyone

  • Django photo Django

    The Web framework for perfectionists with deadlines.

  • D3 photo D3

    Bring data to life with SVG, Canvas and HTML. 📊📈🎉

Recommend Topics

  • javascript

    JavaScript (JS) is a lightweight interpreted programming language with first-class functions.

  • web

    Some thing interesting about web. New door for the world.

  • server

    A server is a program made to process requests and deliver data to clients.

  • Machine learning

    Machine learning is a way of modeling and interpreting data that allows a piece of software to respond intelligently.

  • Game

    Some thing interesting about game, make everyone happy.

Recommend Org

  • Facebook photo Facebook

    We are working to build community through open source technology. NB: members must have two-factor auth.

  • Microsoft photo Microsoft

    Open source projects and samples from Microsoft.

  • Google photo Google

    Google ❤️ Open Source for everyone.

  • D3 photo D3

    Data-Driven Documents codes.