Git Product home page Git Product logo

cccatalog-dataviz's Introduction


Project Discontinued

For additional context see:


Visualize CC Catalog Data

About

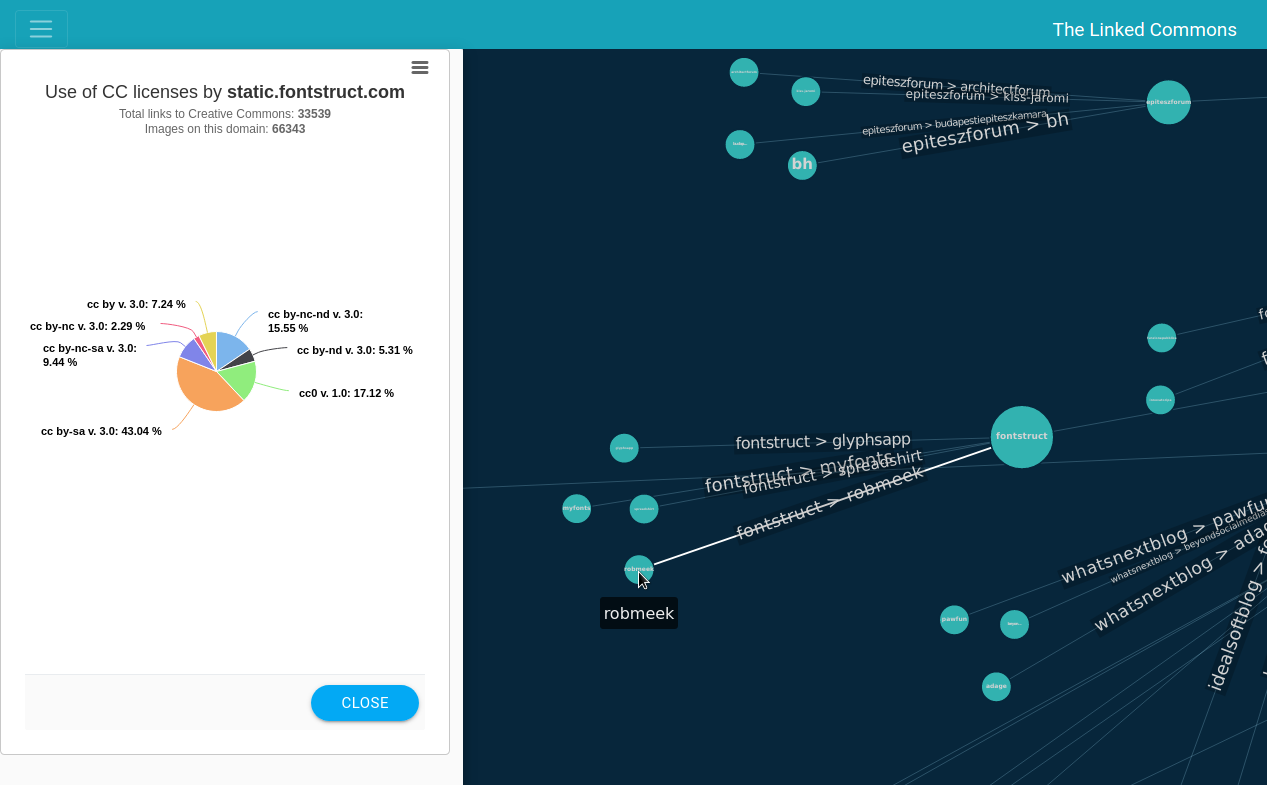
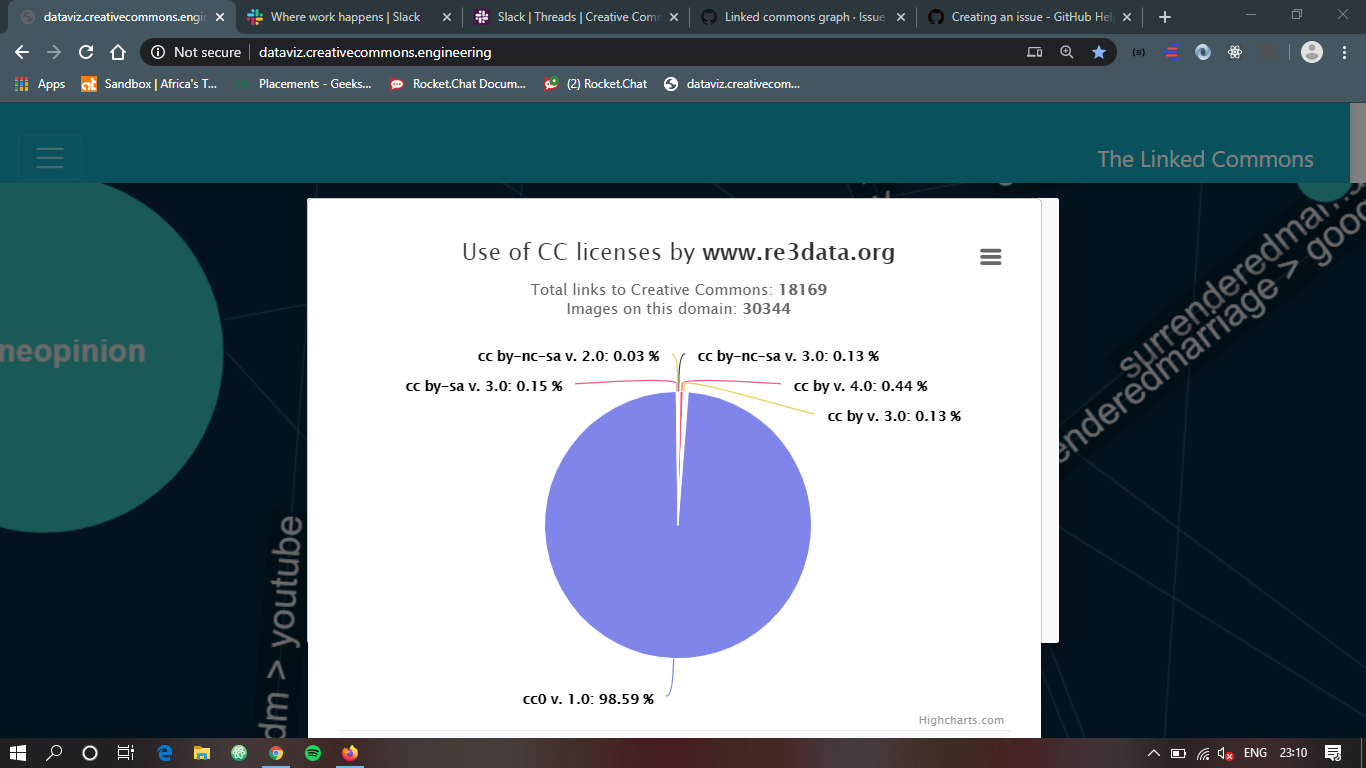
The landscape of openly licensed content is wide and varied. Millions of web pages host and share CC-licensed works—in fact, we estimate that there are over 1.6 billion across the web! With this growth of CC-licensed works, Creative Commons (CC) is increasingly interested in learning how hosts and users of CC-licensed materials are connected, as well as the types of content published under a CC license and how this content is shared. Each month, CC uses Common Crawl data to find all domains that contain CC-licensed content. This dataset contains information about the URL of the websites and the licenses used.

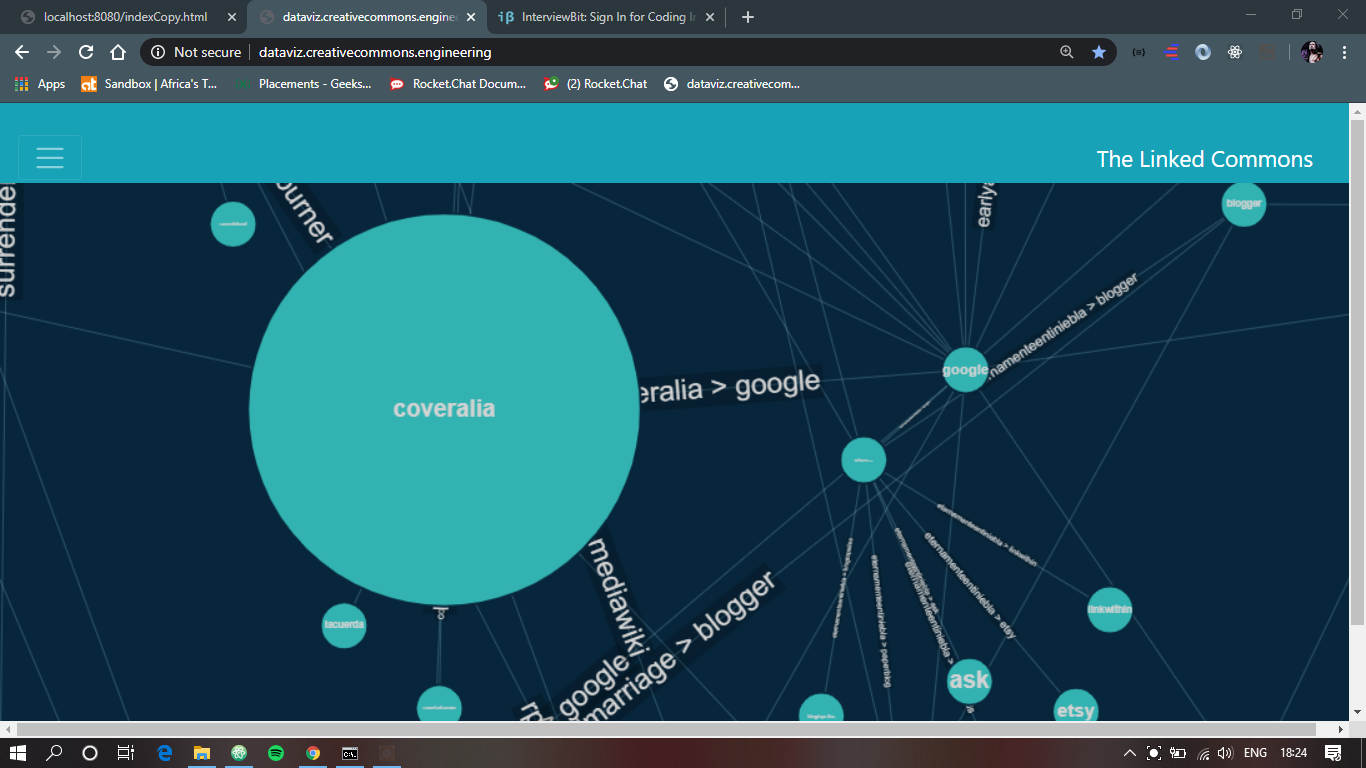
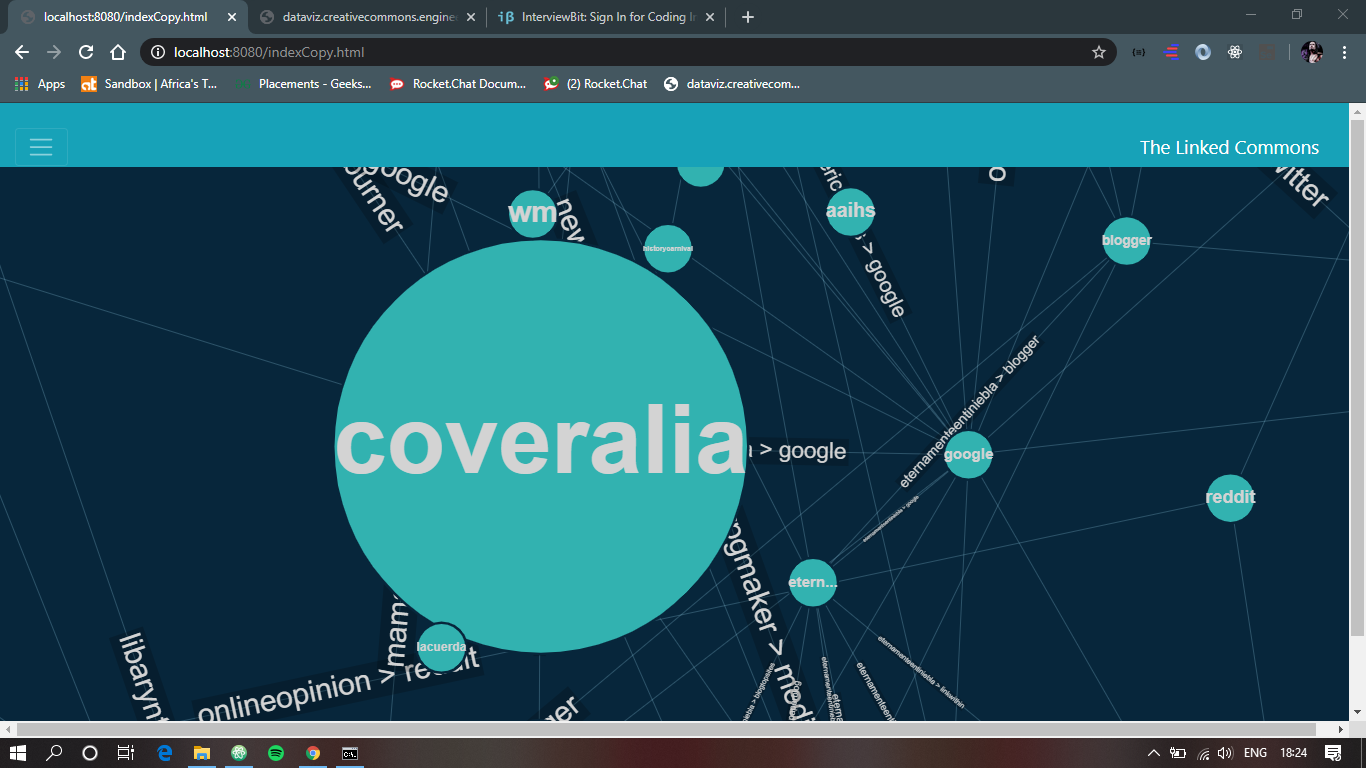
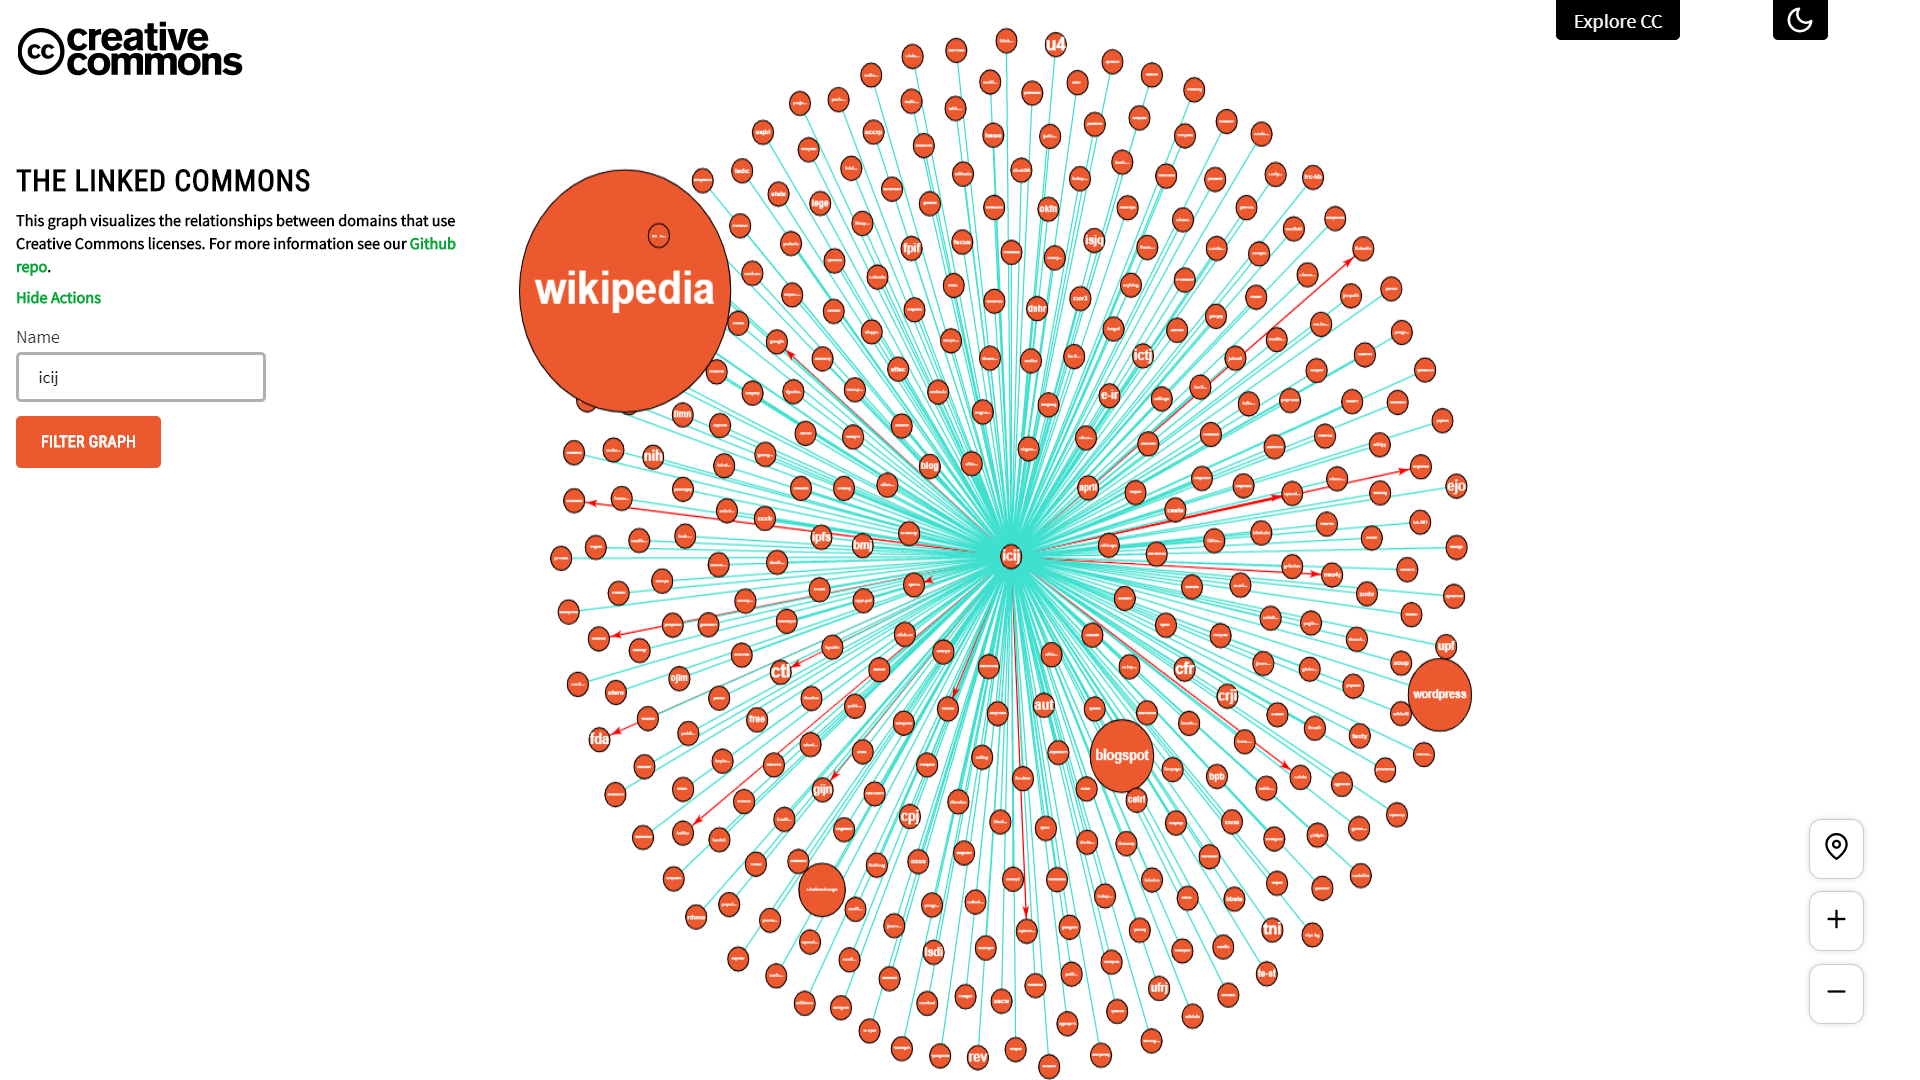
In order to draw conclusions and insights from this dataset, we created the Linked Commons: a visualization that shows how the Commons is digitally connected.

A live demo of the project can be found in here

Getting Started

Directory Structure

src
│   README.md
│   docker-compose.yml # Development docker compose
│
└───GSoC2019
└───data-release # Contains some raw unprocessed tsv files and processed output JSON files
│
└───frontend # Contains react.js app to render the visualization in the browser.|   .env # Contains Backend Server Base Endpoint
│  │   package.json
│  │   package.lock.json
│  │
│  └───src # Contains all React Components
│  
└───backend # Includes Django server source code and scripts to build & update the database. 
   │   requirements.txt
   │   .env # Contains list of environment variables the project needs
   │
   └───scripts # Contains scripts to parse JSON data and upload it to MongoDB server
   └───src # Contains server side Django Apps which defines the API that feeds data to the visualization 

Setting Up Local Development Environment Without Docker

Prerequisites

The frontend application is using react, for which NodeJS v12+ and npm are necessary. NodeJS can be installed from here.

The backend application is using Django, for which Python v3.7+ necessary. Python can be installed from here.

Frontend

  1. Navigate to frontend/ directory.
cd frontend/
  1. Install all dependencies (Make sure that there exists a package.json in the current path)
npm install
  1. To start the development server, use the following command in the terminal.
npm start
  1. To create an optimized build for production, run the following command in the terminal.
npm run build

Backend and Database

  1. Navigate to backend/ directory.
cd backend/
  1. Before proceeding further, ensure that all the variables in .env file are updated and MONGO_HOSTNAME is set to localhost:27017.
  2. Install all dependencies
pip install -r requirements.txt
  1. Navigate to src/ directory where Django-server code exists
cd src/
  1. To start the development server, use the following command
python manage.py runserver
  1. Now the backend should be live at localhost:8000.
  2. The server needs a running instance of MongoDB. Start the Mongo DB server and ensure that the authentication credentials are exactly same as defined in the .env file. If you wish to update the data inside the Database, head over to this section.
  3. Happy Contributing to Linked Commons! 🚀🚀🚀

Setting Up Local Development Environment using Docker

  1. Make sure that the root directory contains docker-compose.yml. And ensure that the backend/.env file is updated and MONGO_HOSTNAME is set to mongodb:27017.
  2. Run the following command to build and start the container.
docker-compose up
  1. Now the frontend, backend and database should be live.
  2. If this is the first time you have built the container, head over to this section to learn how to add data to the MongoDB.
  3. Any changes in the backend/ and frontend/ will trigger a rebuild process and you will be able to see the changes on server!
  4. Happy Contributing to Linked Commons! 🚀🚀🚀

Building production version

Important: For simiplicity we will be using docker to build the production version. Please note that any changes in project files after build won't get reflected in the running container and you need to rebuild the image again.

  1. Before building images, ensure that all the variables in .env file are updated and MONGO_HOSTNAME is set to mongodb:27017.
  2. Now, navigate to backend and then build the django-backend image.
cd backend/
docker build . -f Dockerfile.prod -t linked_commons/backend
  1. Create a new user-defined bridge network
docker network create --driver=bridge linkedcommons-net
  1. Now run the recently built linked_commons/backend image.
docker run --name backend \
   -p 8000:8000 --env-file ./env \
   --network=linkedcommons-net \
   --rm -d linked_commons/backend
  1. Now to start the database in an isolated container.
docker run -it --name mongodb \
   --network=linkedcommons-net \
   -p 27017:27017 -v mongodbdata:/data/db \
   --env-file ./.env --rm -d mongo:4.0.8
  1. You can now access the backend at port 8000 and database at port 27017 of localhost. If you wish to add data then head over to this section.

  2. Now, let's build the frontend. Navigate to frontend directory and build the react-frontend image.

cd frontend
docker build . -f Dockerfile.prod  -t  linkedcommons/frontend
  1. Now to start the frontend application run the following command.
docker run --name frontend \
   -p 3000:80 --rm -d linkedcommons/frontend
  1. Now, the frontend can be accessed at localhost:3000.

Add data to MongoDB

  1. Navigate to the directory containing build_db_script.py.
cd backend/scripts
  1. Ensure that the directory contains fdg_input_file.json or update the INPUT_FILE_PATH variable which will be uploaded to the database. A sample fdg_input_file.json can be found inside data-release/ directory.
  2. Ensure that all the variables in .env file are updated with the running mongodb server.
  3. Now run the build_db_script in the terminal.
# It will connect to the database at `localhost:27017` and update the data. 
python build_db_script.py localhost
  1. It should take a while depending on the JSON file size.
  2. Congrats! You have successfully updated the data. 🎉🎉🎉

Archive

GSoC2019 - Google Summer of Code project by María Belén Guaranda

cccatalog-dataviz's People

Contributors

bharatnischal avatar dependabot[bot] avatar kgodey avatar mathemancer avatar mostafahamedabdelmasoud avatar pa-w avatar parth-paradkar avatar sclachar avatar soccerdroid avatar sp35 avatar ssayima avatar subhamx avatar timidrobot avatar zackkrida avatar

Stargazers

 avatar  avatar  avatar  avatar  avatar  avatar  avatar  avatar  avatar  avatar  avatar  avatar  avatar  avatar  avatar  avatar  avatar  avatar  avatar  avatar

Watchers

 avatar  avatar  avatar  avatar  avatar  avatar  avatar  avatar  avatar  avatar  avatar  avatar  avatar  avatar  avatar  avatar  avatar

cccatalog-dataviz's Issues

Resetting the data when filter input is cleared

Problem

When a user resets the filter input the results are not reset unless user refreshes the page

Description

The feature is related to user experience. It can be solved by :

  1. Passing a function as prop to Sidebar component
  2. We check if nodename is empty we execute the reset function
  3. The function fetches the nodes from backend and displays the graph

Alternatives

Additional context

Implementation

  • I would be interested in implementing this feature.

Release Graph data publicly

Problem

We're currently spending computational and human effort to build a graph relating different web properties that host CC-Licensed data. Unfortunately, the data defining this graph is currently inaccessible to the community.

Description

We should research ways to make that data available in bulk to the community.

  • If we just use the base graph, we could probably just let people download it from the webserver.
  • If we want to go bigger (i.e., include the graphs representing connections at various distances), we will need to explore allowing public access to the data through some other means (probably S3).

Alternatives

Additional context

This was suggested by @annatuma during a meeting, and we thought it sounded like a great goal.

Implementation

  • I would be interested in implementing this feature.

Visualize pie chart while viewing nodes

Problem Description

When you want to see the description data of a domain and you click on it, the pop-up prevents you from further navigating the graph or seeing the relation between the domain you’re viewing and its neighbouring domains.

Solution Description

Place the pop-up to the side so that you can still navigate the nodes while viewing the pie chart and node description.

aside

Linked Commons infrastructure updates

  • All servers related to this project should be fully deployed via Terraform, including:
    • backend
    • frontend
    • data processing
  • There should be no dataviz related server resources that are not tracked and launched by Terraform
  • There should be an one-click or automated way to deploy both frontend and backend changes to production.
  • There should be infrastructure that automatically updates and processes the data in the backend.

Improve documentation

Problem Description

The current documentation can be improved by adding some more information about the project.

Solution Description

I will attempt to elaborate on how the current documentation can be extended.

  1. Currently, /README.md which is the first piece of documentation that a user faces on visiting the repository, contains very limited information regarding the project. A short paragraph describing the project (which is the first paragraph of /GSoC2019/README.md) can be added along with screenshots and a link to the currently deployed webpage.
  2. Instructions about how to serve the files in /GSoC2019/src/ locally needs to be added. I am currently using python3 -m http.server 4000 to do the same.
  3. We can add documentation about the nature of the JSON file in src/data_processing (regarding nodes and links).

@soccerdroid @mathemancer @kgodey please provide your views on the same and what else can be added.

I would like to work on this after taking all the suggestions and inputs.

Reducing the complexity and computational time with new logic

Describe the bug

Under the nodeCanvasObject method of the Force graph there is a logic which adjusted the font size of text such that the font size is maximum without overflowing out of the node (shown in screenshot). This logic uses a do while loop. However a constant time solution exists (without any loop) Since the method is called for each node , using the constant time solution can reduce the computational time.
Also the font size calculated from current algorithm is not so accurate as compared to the proposed logic(As shown in screenshot).

Expected behavior

A simple, fast and more accurate constant time solution is possible which can reduce the computational time.

Screenshots

Screenshot of the current logic
ice_screenshot_20200226-211934

Screenshot of website with the current logic implementation(see the font size of coveralia)
ice_screenshot_20200225-182415

Screenshot of website with the proposed logic run locally on my machine(see the font size of coveralia)
ice_screenshot_20200225-182449

Desktop (please complete the following information)

  • OS: windows 10
  • Browser chrome
  • Version 80.0

Extra Info

I had already tested the new logic locally so I request you to please assign the issue to me

overflow of body

Problem Description

there is an attribute overflow auto which is default in css for body, which causes problem with UI

Solution Description

adding in forced3.css file

body{
	overflow-x: hidden;
	overflow-y: scroll;
}

Alternatives

we can make it without any scroll over X or Y axis.

body{
	overflow: hidden;
}

Additional context

scrollProblem

after adding these first lines:

scrollSolve

The close button in the Linked Commons is not visible.

Describe the bug

The close button on the Linked Common website which should appear in the popup screen after clicking on a node (having some license information) is not visible on the deployed version. So once the user has clicked a node he is unable to close the details/ piechart modal of the node.

To Reproduce

Steps to reproduce the behavior:

  1. Go to Linked Common website
  2. Click on 'any node'
  3. If the popup window says no information for the given license. Then close the node and select some other node with some information.
  4. Error 'There is no close button to go back to the starting screen'.

Expected behavior

The close button should be visible to the user so he/she can go back to the graph screen.

Screenshots

ice_screenshot_20200224-231053
Screenshot on chrome browser with no close button.
ice_screenshot_20200224-231021
Screenshot on firefox with no close button.

Desktop

  • OS: windows 10
  • Browser Chrome, Firefox
  • Version Chrome v79.0, Firefox 73.0.1

Additional context

I will like to solve this issue. So please assign me this issue.

Hovering a node does not produce very informative visuals.

Describe the bug

Currently when we hover on a node it highlights all the links which have atleast 1 node as

  1. Hovered node
  2. Nodes which can be reached with hovered node as source node
  3. Nodes which can be reached from nodes in step 2 as source nodes and so on..

Hovering nodes highlight the specified links. But it is very difficult for a viewer to guess the logic happening behind the scene. Hence it is not soo informative for viewers. (Even I was not able to guess the logic without reading the code). See the screenshots section.
The more informative logic will be to highlight the source and destination nodes (that are the neighbouring nodes) of the hovered node with different styles for source and destination. For example with different colors.

To Reproduce

  1. Go to website
  2. Zoom the website to have a clear view of nodes and links.
  3. Hover at different nodes (atleast 7-8 nodes)
  4. Can you guess the logic behind the hover-node event ?

Expected behavior

We should show links where hovered link is source node and where hovered link is destination node with different styles, so that the user should not have to view the direction of link from the link text. Hence making it more informative.

Screenshots

Different hovered nodes

Almost all links are highlighted
ice_screenshot_20200227-101618

Only 1 link is highlighted
ice_screenshot_20200227-101838

Desktop (please complete the following information)

  • OS: Windows 10
  • Browser: Chrome
  • Version: 80

Generate large sample of data for testing

We need to process a large sample of data from Common Crawl and process it into the JSON format expected by the Force Graph library we're using in the CC DataViz project.

Make code in index.html modular

Problem Description

Currently, the file index.html houses the entire code that defines the display logic of the nodes. However, as new features and components are added, the code will become longer and harder to read. It will also make the HTML file to load slower.

Solution Description

The code can be broken into modules. All the dependencies of the project are available as npm packages. The modules will be bundled into a single bundle.js file using webpack, which can then be included in index.html.

Add filtering by nodes to the Linked Commons. (reference idealist)

Problem Description

Currently the visualization of the graph is not provide any insights due to large no. of nodes and edges plotted altogether. And also plotting whole graph will create a rendering process too slow.

Solution Description

Adding node filter will lead to analyse the particular node with better visualization. The main thing here to focus is that cc dealing with large no. of nodes and links so the time complexity of all the algorithms which are going to implemented must be optimize enough.

So, I came up with an algorithm which will filters the nodes by there domain name and going only the particular distance as selected by the user with O(N+M) complexity where N,M are the no. of nodes and edges respectively.

  1. Every time fetching data from the json file for every filter query is not feasible, so instead we will create graph data structure as user session starts and that data structure will going to use for further filter queries.
    That will save time for fetching data every time from json file.

  2. Now, I am using the Breadth First Search (BFS) which will traverse the graph level by level and terminate as it reached to the particular distance provided by user. In case distance parameter is missing at that time BFS will traverse till leaf nodes.

  3. When the traversal of graph completed that data will passed to forced graph for plotting that's it.

Snapshots

  1. Filter query on domain with autocomplete feature.

CC_Output_2

  1. Filter nodes by providing traversing depth/distance.

CC_Output_3

  1. Final Plottings

CC_Output_1

CC_Output_4

Creativecommons is not included as a node

I noticed that if a user may want to search for the Creative Common node on the graph, they won't be able. I believe the reason is that most other nodes are connected to it and it was voluntarily removed from other nodes?
I was wondering if there was an approach to integrate this node without rendering a skewed graph.

 - OS: Windows 10.0.17763
 - Browser:  Chrome
 - Version 80.0.3987.149

Add a small widget to zoom in and out

Problem Description

Currently, the page can be zoomed in or out using mouse scrollbar or using trackpad assisted by precision drivers. I feel that adding two small buttons (+ and -) to control zoom level will appeal to most users. The idea is inspired by embedded google maps used by many. (See pic below)

google_map
Source - LINK

Solution Description

I am keen to work on this feature. I will create this widget with position absolute to the viewport and will listen to any click events. On any such event will change the zoom level.

Upgrade the version of Force-graph

Problem Description

The version of force-graph currently used in the Linked Commons is Version 1.16.1 while the latest version of force-graph is Version 1.26.3.
So some of the useful methods are not available in this version, one of them is nodeVisibility([boolean, str or fn]) (See the error in the screenshot which says nodeVisibility is not a function).

Solution Description

Upgrade the force-graph to its latest version so that we can use all the features of this beautiful and powerful library.

Screenshot

ice_screenshot_20200312-011833

Recommend Projects

  • React photo React

    A declarative, efficient, and flexible JavaScript library for building user interfaces.

  • Vue.js photo Vue.js

    🖖 Vue.js is a progressive, incrementally-adoptable JavaScript framework for building UI on the web.

  • Typescript photo Typescript

    TypeScript is a superset of JavaScript that compiles to clean JavaScript output.

  • TensorFlow photo TensorFlow

    An Open Source Machine Learning Framework for Everyone

  • Django photo Django

    The Web framework for perfectionists with deadlines.

  • D3 photo D3

    Bring data to life with SVG, Canvas and HTML. 📊📈🎉

Recommend Topics

  • javascript

    JavaScript (JS) is a lightweight interpreted programming language with first-class functions.

  • web

    Some thing interesting about web. New door for the world.

  • server

    A server is a program made to process requests and deliver data to clients.

  • Machine learning

    Machine learning is a way of modeling and interpreting data that allows a piece of software to respond intelligently.

  • Game

    Some thing interesting about game, make everyone happy.

Recommend Org

  • Facebook photo Facebook

    We are working to build community through open source technology. NB: members must have two-factor auth.

  • Microsoft photo Microsoft

    Open source projects and samples from Microsoft.

  • Google photo Google

    Google ❤️ Open Source for everyone.

  • D3 photo D3

    Data-Driven Documents codes.