Git Product home page Git Product logo

catherinesyeh / attention-viz Goto Github PK

View Code? Open in Web Editor NEW
104.0 6.0 12.0 1.03 GB

Visualizing query-key interactions in language + vision transformers

Home Page: http://attentionviz.com/

License: MIT License

HTML 99.99% JavaScript 0.01% CSS 0.01% Python 0.01% Vue 0.01% TypeScript 0.01%
attention-mechanism attention-visualization bert computer-vision gpt nlp transformer transformer-models visualization visualization-tools

attention-viz's Introduction

attention-viz

Visualizing query-key interactions in language + vision transformers

abstract

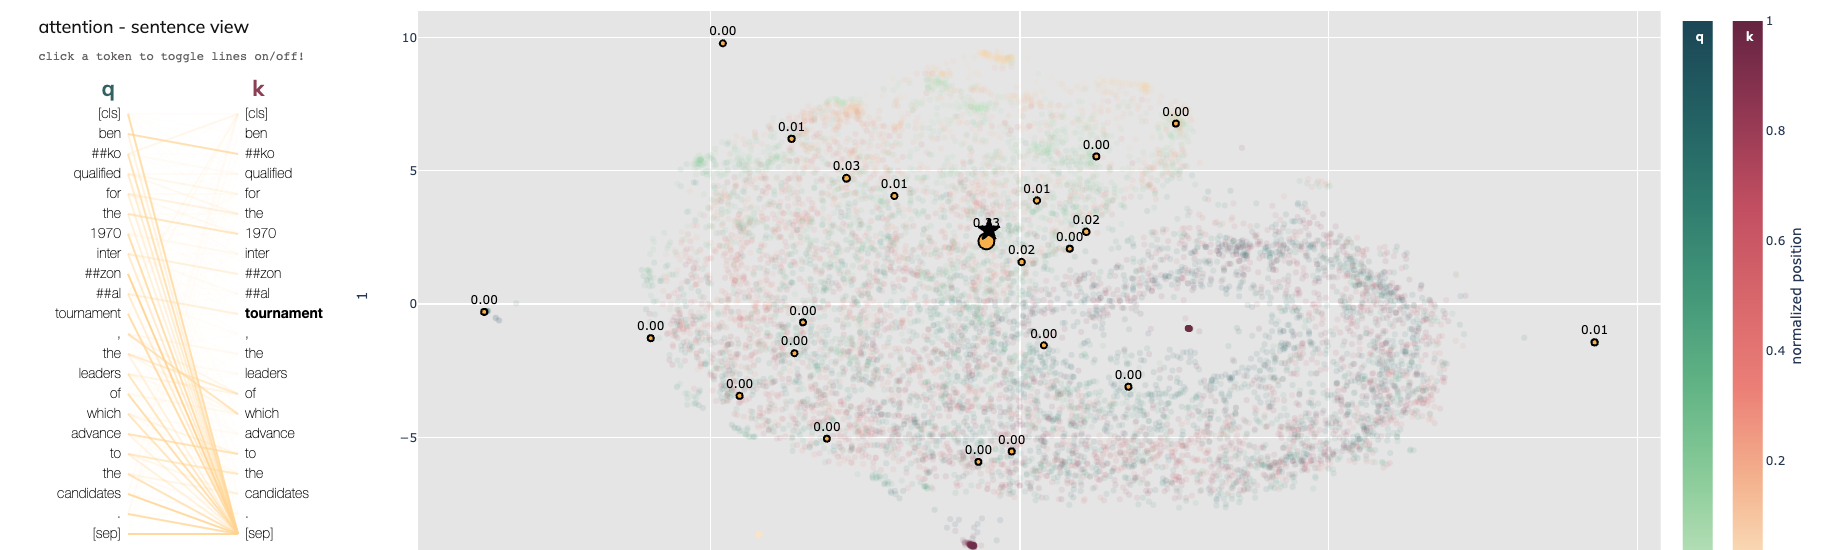
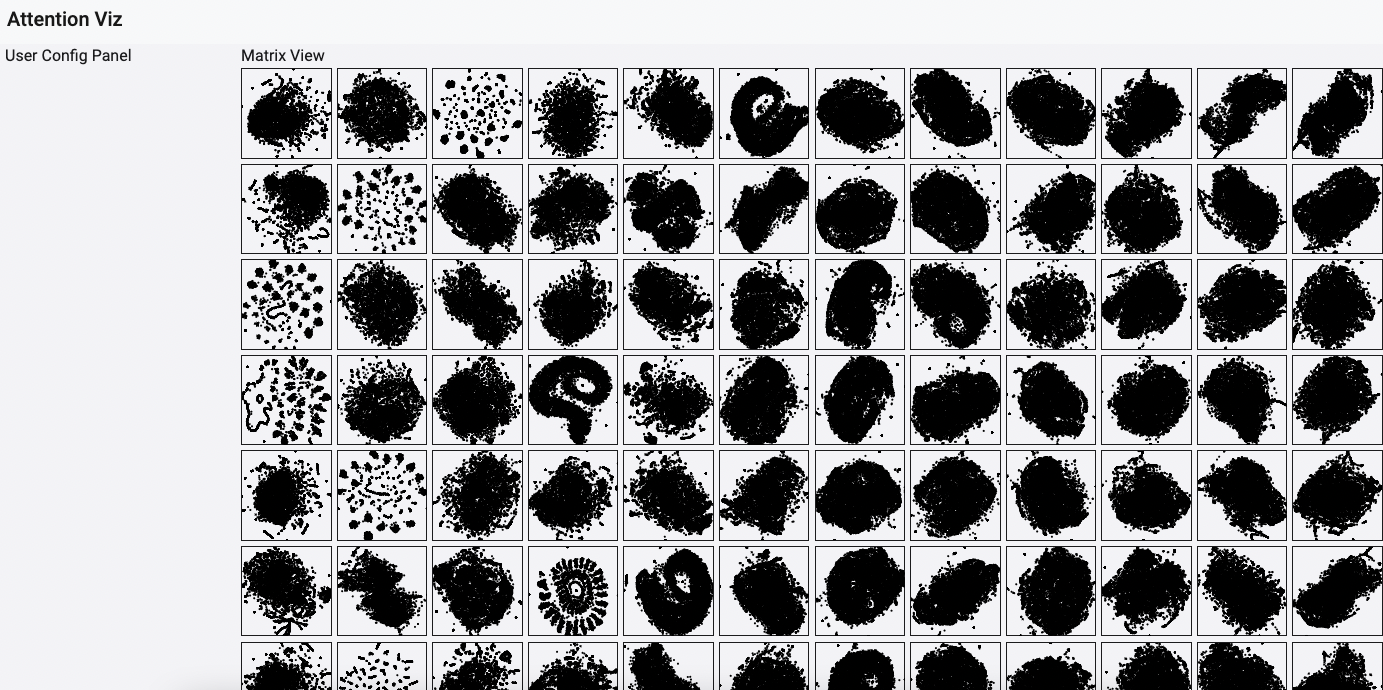
Transformer models are revolutionizing machine learning, but their inner workings remain mysterious. In this work, we present a new visualization technique designed to help researchers understand the self-attention mechanism in transformers that allows these models to learn rich, contextual relationships between elements of a sequence. The main idea behind our method is to visualize a joint embedding of the query and key vectors used by transformer models to compute attention. Unlike previous attention visualization techniques, our approach enables the analysis of global patterns across multiple input sequences. We create an interactive visualization tool, AttentionViz, based on these joint query-key embeddings, and use it to study attention mechanisms in both language and vision transformers. We demonstrate the utility of our approach in improving model understanding and offering new insights about query-key interactions through several application scenarios and expert feedback.

set up instructions

  1. Clone repo and navigate into folder:
git clone https://github.com/catherinesyeh/attention-viz.git
cd attention-viz
  1. Download data folder here and unzip. It should be included in the web folder like so:

image

  1. Navigate to back end:
cd web/back/
  1. Create virtual env and activate:
python3 -m venv env
source env/bin/activate
  1. Install requirements:
pip3 install -r requirements.txt
  1. Start back end:
python3 run.py
  1. Navigate to front end:
cd ../front
  1. Install necessary packages and start front end:
npm i
npm run serve
  1. The interface should be running at: http://localhost:8561

citation

If you find this work helpful, please consider citing our paper:

@article{yeh2023attentionviz,
  title={Attentionviz: A global view of transformer attention},
  author={Yeh, Catherine and Chen, Yida and Wu, Aoyu and Chen, Cynthia and Vi{\'e}gas, Fernanda and Wattenberg, Martin},
  journal={IEEE Transactions on Visualization and Computer Graphics},
  year={2023},
  publisher={IEEE}
}

Thank you for checking out AttentionViz!

attention-viz's People

Contributors

catherinesyeh avatar wowjyu avatar yc015 avatar

Stargazers

 avatar  avatar  avatar  avatar  avatar  avatar  avatar  avatar  avatar  avatar  avatar  avatar  avatar  avatar  avatar  avatar  avatar  avatar  avatar  avatar  avatar  avatar  avatar  avatar  avatar  avatar  avatar  avatar  avatar  avatar  avatar  avatar  avatar  avatar  avatar  avatar  avatar  avatar  avatar  avatar  avatar  avatar  avatar  avatar  avatar  avatar  avatar  avatar  avatar  avatar  avatar  avatar  avatar  avatar  avatar  avatar  avatar  avatar  avatar  avatar  avatar  avatar  avatar  avatar  avatar  avatar  avatar  avatar  avatar  avatar  avatar  avatar  avatar  avatar  avatar  avatar  avatar  avatar  avatar  avatar  avatar  avatar  avatar  avatar  avatar  avatar  avatar  avatar  avatar  avatar  avatar  avatar  avatar  avatar  avatar  avatar  avatar  avatar  avatar  avatar

Watchers

 avatar  avatar  avatar  avatar  avatar  avatar

attention-viz's Issues

Add left sidebar for matrix view

Need to ask Martin for more details (so maybe work on this later), but here are some things it might involve:

  • input box where user can type in a sentence
    • this may not be necessary...
  • add user's sentence to the query/key plots (right side)
  • show attention plot for user's sentence (left side)
  • allow user to click on lines in the attention plot, two types of interaction:
    • emphasize query/key pair (aka. want to see where this pair has high attention)
    • de-emphasize query/key pair (aka. we don't want this pair to have high attention)
  • then, update matrix view to show plots with the corresponding features selected by the user (right side)

example attn plot for reference:
image

Sentence table

Include table with all sentences in visualization that users can interact with. E.g.,

  • allow clicking on tokens from table to easily visualize sentences (could be especially helpful in matrix view)
  • show distribution of words in sentence (could highlight ones w/ repeated words for induction heads)

potentially a helpful resource: https://2x.antdv.com/components/table

Attention view for single plots

Left sidebar:

  • when user clicks on a point (right side), show attention plot for sentence on left sidebar:
  • highlight token corresponding to point in attention plot (see below)
  • allow user to toggle lines off and on in attention plot to more clearly observe attn patterns
    • currently, i do this by letting people click on the token text in the attention plot
  • renormalize line weights after toggling
  • label q + k columns
  • potentially also add more complex features (e.g., input box) like in matrix view? will ask martin...

current attn view for reference:
image

Main panel:

  • will clarify with martin, but may also still want to highlight points in sentence on main plot when the user clicks on a token (see above)
    • update: yes we should still do this but don't make points yellow, keep query/key color schemes just outline in different color maybe? if we use highlight token method like with search, seems to be a bit slow at the moment...

Add other filters

E.g., filter by

  • norm
  • position
  • token length?
  • type (e.g., just queries or keys)

(connected to idea of #11)

Add attention data

  • create method to read in attention data on backend (from another json file)
  • test out how long computing on fly would take
  • ultimately, connect to attention plots in single(#7) /matrix view(#4)

Optimize point cloud computation

Currently, the point cloud data is computed upon two listeners, which is very inefficient. I did not implement memory management so sometimes the browser crashes after several runs. Ideally, the point cloud data should be computed once upon loading the data.

Create single view main panel (right side)

  • large query/key scatterplot view corresponding to single layer + head
  • colors:
    • one main color scheme for queries (e.g., greens) and another for keys (e.g., pinks)
    • have different options for user to color points by within query/key groups, e.g.,
      • normalized position (the default right now)
      • vector norm
      • martin suggested something like coloring by every kth token (e.g., for n = 5, all tokens with pos % 5 == 0 are one color, all tokens with post % 5 == 1 are another, etc.)
      • maybe others? so we want it to be easy to add coloring options later on.
    • show legend for each plot coloring too
  • hover view (probably will be similar to what i have now-- see below):
    image
    show:
    • token value/string
    • token type (query/key)
    • position in sentence (also requires total sentence length)
    • norm
    • the full sentence it came from (and highlight current token)

Cluster view of attention heads

Create a "projection of projections" (similar to fig. 6 in What Does Bert Look At?) to help users discover attention heads that may have similar attention patterns. Could be an alternate global view of attention (more clusters than matrix).

Add 3D view

  • add 3D coords
  • have option to switch b/t 2D and 3D plots

Visualize Scatter Matrix

The goal is to visualize the scatter matrix (12 * 12 * 10k points).

The code is in front/src/components/MatrixView.

Tried two packages:

  1. d3.js, results below
    Screenshot 2022-12-01 at 21 03 06

Cons: slow; take about 15s to load all visualizations on my machine;

  1. https://github.com/flekschas/regl-scatterplot
    Failed. Did not debug yet. I think it has something to do with the package. The package seems not to be good for creating 12*12 canvases simultaneously. I can imagine that the package would be good for showing one scatterplot.

To-dos:

  • [] explore other packages (using canvas/WebGL preferred).

Search feature

Let users search for tokens in single view & highlight results: e.g.,
image

Add other token data

E.g.,

  • unnormalized position + sentence length (e.g., 5 out of 33)
  • query/vector norm
  • full sentence
  • dot product?

Add GPT visualizations

  • rerun code to generate umap/tsne coordinates for GPT
    • 2d
    • 3d
  • recompute other info (e.g., attention)
  • add to attention-viz

Add loading msg

  • When matrix/single view is loading, show message/indicator so user knows
  • May want to stylize better later :)

Show/hide data label feature

  • Have a button/option to show or hide token labels on plot, e.g.:
    image
  • make sure labels update when user zooms in and out (e.g., at every zoom level, show only enough so there's no overlap)
    • check out existing libraries like this d3 option

Not sure if we still need a clustering option too (that just shows labels inside cluster or something?)... I'll ask martin too haha

  • this is lower priority (get the show/hide feature working first)

Responsive zoom

  • lower priority, but make sure text scales properly when user zooms in on matrix :) (i think points look fine though?)

Add correlation info to plots

E.g., show correlation b/t q-k distance + dot product in single view (and as part of tooltip in matrix view?)

Alternatively (or in addition): show cosine similarity scores, difference between norms, etc.?

Migrating to interactive web app

We will migrate the program to a web app for on-the-fly interactivity (#1).

The src for the web app is in /web, which consists of:

  • /back: in python3, w. Flask for communicating between the front end

    • [] Dump data into a local file; in dataService.py, add functions for reading raw data and sending data to the front end
  • /front: in typescript, w. Vue (framework) + Vuex (state management).

    • dataService.ts: for getting/posting data from/to the backend API
    • /store/index.ts: for state management, you might want to check Vuex
    • /components/*: modulized Vue components, you might want to check Vue
    • /assets: for static assets such as logos
    • /utils: helper function and types definition (like a heading file in C++).

Fix laggy zoom?

Not sure if it's just my computer, but sometimes zooming in and out seems a bit lagging... maybe because I have too many watcher methods?

optimize 3D view

  • fix position of camera (right now, default view a little awkward for both matrix/single mode)
  • currently, a little hard to click precisely on plots in matrix view (sometimes 1 attention head off)
  • change placement of layer/head labels too?

Progress bar when loading

Probably would be good to add some sort of progress bar/loading icon when interface is updating (sometimes it takes a few seconds...)

Show all queries + keys on click

Highlight clicked on token, then show remaining queries + keys (instead of currently, it just shows opposite of clicked on token)

Include different coloring options

Overlaps w/ #6 but martin wants us to experiment with different color schemes:

  • have different options for user to color points by within query/key groups, e.g.,
    • normalized position (the default right now)
    • vector norm
    • just plain green vs. pink (for example) for query and key
    • martin suggested something like categorical coloring by every kth token (e.g., for n = 5, all tokens with pos % 5 == 0 are one color, all tokens with post % 5 == 1 are another, etc.), could use colors like "paired" palette here
    • maybe others? so we want it to be easy to add coloring options later on.
  • show legend for each plot coloring too
  • also experiment with other query/key colors (e.g., instead of green for query and pink for key, blue for query and orange for key? let user pick from some options?)

Aggregate attention visualizations

Add aggregate attention visualizations for each head (e.g., try heatmap / Jesse Vig bipartite graphs)

  • one resource: d3 heatmap

  • compute aggregate matrices

  • load data into tool

  • create heatmaps

Note: right now, probably mostly for single view, but potentially could add to matrix view too maybe?

Attention filter

Have option for users to hide points with low attention (e.g., hide tokens w/ attention < 0.5) in single view.

  • could make this value adjustable by user?
  • maybe could add to matrix view too?

Smoother transition between single and matrix view

sometimes transition is very choppy -- not sure if there is a way around it though?
also:

  • loading symbol when going from single --> matrix? (seems to be somewhat slow in this direction for some reason)
  • @wowjyu: on zoom, naturally go from matrix to single & vice versa (w/ smooth transition)

figure out if single view is actually needed

If it's possible to just zoom into a specific plot in the matrix (and do all operations there), maybe we don't need single view?

  • and then we could also have a "lock" feature if users don't want to accidentally move around while they're looking at a specific plot
  • maybe just select to zoom area

Try different datasets

Might help to focus on a more specific NLP task/domain and reveal more semantic patterns :).

  • q & a
  • entailment
  • math
  • fill in the blank
  • translation (would we need finetuned model for this?)

Switch between matrix/single view

  • When in matrix view, user should be able to click on a single plot (or label/overlay corresponding to plot) to switch to single view (if possible, make other points fade away for cool transition)
  • When in single view, user should be able to click a button (or something similar) to be taken back to matrix view

Reset button

  • add reset button to matrix & single view that resets zoom/pan settings
  • also reset other actions (e.g., user added sentences)? or have separate reset buttons for those?

2D colormap for positional embedding of VIT

Find and add a 2D colormap for representing the positional embeddings of image patches in VIT.

Alternatively add two separate coloring schemes: one represents the position of image tokens on the y-axis of the images (rows), and one represents the position of image tokens on the x-axis (columns).

Dark mode

Allow users to toggle between normal (light) mode and dark mode: e.g.,
image

Connect tokens in attention view

Building off #7, would be cool to connect tokens with lines (e.g., weighted by attention values) to show their intersections and contribute novel visualization of attention.

Maybe only draw top 2-3 attention weights for each token

Recommend Projects

  • React photo React

    A declarative, efficient, and flexible JavaScript library for building user interfaces.

  • Vue.js photo Vue.js

    ๐Ÿ–– Vue.js is a progressive, incrementally-adoptable JavaScript framework for building UI on the web.

  • Typescript photo Typescript

    TypeScript is a superset of JavaScript that compiles to clean JavaScript output.

  • TensorFlow photo TensorFlow

    An Open Source Machine Learning Framework for Everyone

  • Django photo Django

    The Web framework for perfectionists with deadlines.

  • D3 photo D3

    Bring data to life with SVG, Canvas and HTML. ๐Ÿ“Š๐Ÿ“ˆ๐ŸŽ‰

Recommend Topics

  • javascript

    JavaScript (JS) is a lightweight interpreted programming language with first-class functions.

  • web

    Some thing interesting about web. New door for the world.

  • server

    A server is a program made to process requests and deliver data to clients.

  • Machine learning

    Machine learning is a way of modeling and interpreting data that allows a piece of software to respond intelligently.

  • Game

    Some thing interesting about game, make everyone happy.

Recommend Org

  • Facebook photo Facebook

    We are working to build community through open source technology. NB: members must have two-factor auth.

  • Microsoft photo Microsoft

    Open source projects and samples from Microsoft.

  • Google photo Google

    Google โค๏ธ Open Source for everyone.

  • D3 photo D3

    Data-Driven Documents codes.