This is an extensive library of function/data plotter classes for Qt (>= 4.7, tested with Qt up to 5.4).
This software is licensed under the term of the GNU Lesser General Public License 2.1 (LGPL 2.1) or above.
This section assembles some simple examples of usage. You can find more (complex) examples for the classes in this repository in the subfolder "test". All test-projects are Qt-projects that use qmake to build. You can load them into QtCreator easily.
###Very simple line-graph
This project (see ./test/jkqtplotter_simpletest/) simply creates a JKQtPlotter widget (as a new window) and adds a single line-graph (a sine-wave). Data is initialized from two QVector objects.
The QMake project looks like this (see ./test/jkqtplotter_simpletest/jkqtplotter_simpletest.pro):
# source code for this simple demo
SOURCES = jkqtplotter_simpletest.cpp

# configure Qt
CONFIG += qt
QT += core gui svg
greaterThan(QT_MAJOR_VERSION, 4): QT += widgets printsupport

# output executable name
TARGET = jkqtplotter_simpletest

# include JKQtPlotter source code
include(../../jkqtplotter.pri)
And the soruce code of the main application is (see ./test/jkqtplotter_simpletest/jkqtplotter_simpletest.cpp):
#include <QApplication>
#include "jkqtplotter.h"


int main(int argc, char* argv[])
{
    QApplication app(argc, argv);

    // 1. create a plotter window and get a pointer to the internal datastore
	//    (for convenience)
    JKQtPlotter plot;
    JKQTPdatastore* ds=plot.getDatastore();

    // 2. now we create data for a simple plot (a sine curve)
    QVector<double> X, Y;
    const int Ndata=100;
    for (int i=0; i<Ndata; i++) {
        const double x=double(i)/double(Ndata)*8.0*M_PI;
        X<<x;
        Y<<sin(x);
    }

    // 3. make data available to JKQtPlotter by adding it to the internal
	//    datastore.
    //    Note: In this step the data is copied (of not specified otherwise), so
    //          you can reuse X and Y afterwards!
    //    The variables columnX and columnY will contain the internal column ID
    //    of the newlycreated columns with names "x" and "y" and the (copied)
	//    data from X and Y.
    size_t columnX=ds->addCopiedColumn(X, "x");
    size_t columnY=ds->addCopiedColumn(Y, "y");

    // 4. create a graph in the plot, which plots the dataset X/Y:
    JKQTPxyLineGraph* graph1=new JKQTPxyLineGraph(&plot);
    graph1->set_xColumn(columnX);
    graph1->set_yColumn(columnY);
    graph1->set_title(QObject::tr("sine graph"));

    // 5. add the graph to the plot, so it is actually displayed
    plot.addGraph(graph1);

    // 6. autoscale the plot so the graph is contained
    plot.zoomToFit();

    // show plotter and make it a decent size
    plot.show();
    plot.resize(600,400);

    return app.exec();
}
The result looks like this:

###Simple line-graph with error bars
This project (see ./test/jkqtplotter_simpletest_symbols_and_errors/) simply creates a JKQtPlotter widget (as a new window) and adds a single line-graph (a sine-wave) that has y-errorbars. In addition, this example shows how to change some of the axis properties and how to use LaTeX markup to format axis labels (can actually be used for all labels in JKQtPlotter). Also, in comparison to the last example, here we initialize the data from C-type arrays (double*), instead of QVector objects.
The soruce code of the main application is (see ./test/jkqtplotter_simpletest_symbols_and_errors/jkqtplotter_simpletest_symbols_and_errors.cpp):
#include <QApplication>
#include "jkqtplotter.h"

// number of datapoints:
#define Ndata 10

int main(int argc, char* argv[])
{
    QApplication app(argc, argv);

    // 1. create a plotter window and get a pointer to the internal datastore (for convenience)
    JKQtPlotter plot;
    JKQTPdatastore* ds=plot.getDatastore();

    // 2. now we create data for a simple plot (a sine curve with lin. increasing errors)
    double X[Ndata], Y[Ndata], YERROR[Ndata];
    for (int i=0; i<Ndata; i++) {
        X[i]=double(i)/double(Ndata)*2.0*M_PI;
        Y[i]=sin(X[i]);
        YERROR[i]=0.2+double(i)/double(Ndata)*0.25;
    }

    // 3. make data available to JKQtPlotter by adding it to the internal datastore.
    //    Note: In this step the data is copied (of not specified otherwise), so you can
    //          reuse X and Y afterwards!
    //    the variables columnX and columnY will contain the internal column ID of the newly
    //    created columns with names "x" and "y" and the (copied) data from X and Y.
    size_t columnX=ds->addCopiedColumn(X, Ndata, "x");
    size_t columnY=ds->addCopiedColumn(Y, Ndata, "y");
    size_t columnYE=ds->addCopiedColumn(YERROR, Ndata, "y-error");

    // 4. create a graph in the plot, which plots the dataset X/Y:
    JKQTPxyLineErrorGraph* graph1=new JKQTPxyLineErrorGraph(&plot);
    graph1->set_xColumn(columnX);
    graph1->set_yColumn(columnY);
    graph1->set_yErrorColumn(columnYE);
    graph1->set_symbol(JKQTPfilledStar); // set symbol style
    graph1->set_yErrorStyle(JKQTPerrorBars); // set error indicator type
    graph1->set_drawLine(false); // don't draw a line
    graph1->set_title(QObject::tr("sine graph"));

    // 5. add the graph to the plot, so it is actually displayed
    plot.addGraph(graph1);

    // 6. hide 0-lines
    plot.getXAxis()->set_showZeroAxis(false);
    plot.getYAxis()->set_showZeroAxis(false);

    // 7. set some axis properties (we use LaTeX for nice equation rendering)
    plot.getXAxis()->set_axisLabel(QObject::tr("x-axis $x$ [mm]"));
    plot.getYAxis()->set_axisLabel(QObject::tr("\\textbf{\\color{red}{y-axis} $\\left(y=\\sin(x)\\pm(0.2+0.25\\cdot x)\\right)$ [A.U.]}"));
    plot.getXAxis()->set_labelFont("Arial");
    plot.getYAxis()->set_labelFont("Times New Roman");
    plot.getYAxis()->set_labelFontSize(12); // large x-axis label
    plot.getYAxis()->set_tickLabelFontSize(10); // and larger y-axis tick labels

    // 8. autoscale the plot so the graph is contained
    plot.zoomToFit();

    // show plotter and make it a decent size
    plot.show();
    plot.resize(600,400);

    return app.exec();
}
The result looks like this:

###Simple barchart
This project (see ./test/jkqtplotter_simpletest_barchart/) simply creates a JKQtPlotter widget (as a new window) and adds a single line-graph (a sine-wave) that has y-errorbars. In addition, this example shows how to change some of the axis properties and how to use LaTeX markup to format axis labels (can actually be used for all labels in JKQtPlotter). Also, in comparison to the last example, here we initialize the data from C-type arrays (double*), instead of QVector objects.
The soruce code of the main application is (see ./test/jkqtplotter_simpletest_barchart/jkqtplotter_simpletest_barchart.cpp):
#include <QApplication>
#include "jkqtplotter.h"

#define Ndata 5
int main(int argc, char* argv[])
{
    QApplication app(argc, argv);

    // 1. create a plotter window and get a pointer to the internal datastore (for convenience)
    JKQtPlotter plot;
    plot.get_plotter()->set_useAntiAliasingForGraphs(true); // nicer (but slower) plotting
    plot.get_plotter()->set_useAntiAliasingForSystem(true); // nicer (but slower) plotting
    plot.get_plotter()->set_useAntiAliasingForText(true); // nicer (but slower) text rendering
    JKQTPdatastore* ds=plot.getDatastore();

    // 2. now we create data for three simple barchart
    QString L[Ndata]={  "cat. A", "cat. B", "cat. C", "cat. D", "other"};
    double  X[Ndata]={        1,        2,        3,        4,       5};
    double Y1[Ndata]={        5,        4,        3,        4,       5};
    double Y2[Ndata]={       -5,       -3,        1,        3,       6};
    double Y3[Ndata]={        6,        2,        5,        3,       6};

    // 3. make data available to JKQtPlotter by adding it to the internal datastore.
    //    Note: In this step the data is copied (of not specified otherwise)
    //    the variables columnX and columnY... will contain the internal column ID of the
    //    newly created columns with names "x" and "y..." and the (copied) data from X
    //    and Y...
    size_t columnX=ds->addCopiedColumn(X, Ndata, "x");
    size_t columnY1=ds->addCopiedColumn(Y1, Ndata, "y1");
    size_t columnY2=ds->addCopiedColumn(Y2, Ndata, "y2");
    size_t columnY3=ds->addCopiedColumn(Y3, Ndata, "y3");

    // 4. create graphs in the plot, which plots the dataset X/Y1, X/Y2 and X/Y3:
    JKQTPbarHorizontalGraph* graph1=new JKQTPbarHorizontalGraph(&plot);
    graph1->set_xColumn(columnX);
    graph1->set_yColumn(columnY1);
    graph1->set_title(QObject::tr("dataset 1"));
    JKQTPbarHorizontalGraph* graph2=new JKQTPbarHorizontalGraph(&plot);
    graph2->set_xColumn(columnX);
    graph2->set_yColumn(columnY2);
    graph2->set_title(QObject::tr("dataset 2"));
    JKQTPbarHorizontalGraph* graph3=new JKQTPbarHorizontalGraph(&plot);
    graph3->set_xColumn(columnX);
    graph3->set_yColumn(columnY3);
    graph3->set_title(QObject::tr("dataset 3"));


    // 5. add the graphs to the plot, so it is actually displayed
    plot.addGraph(graph1);
    plot.addGraph(graph2);
    plot.addGraph(graph3);

    // 6. now we set the graphs, so they are plotted side-by-side
    //    This function searches all JKQTPbarHorizontalGraph in the current
    //    plot and sets their shift/scale so they form a nice plot with
    //    side-by-side groups
    graph1->autoscaleBarWidthAndShift(0.75, 1);

    // 7. data is grouped into 5 numbere groups (1..5), but we also have string
    //    labels for these groups (stored in L). In order to display these labels,
    //    we have to tell the x-Axis to use these special labels:
    plot.getXAxis()->addAxisTickLabels(X, L, Ndata);
    //    also we can rotate the labels a bit (by 45 degree), so they fit better
    plot.getXAxis()->set_tickLabelAngle(45);
    plot.getXAxis()->set_tickLabelFontSize(12);

    // 8. finally we move the plot key/legend to the outside, top-right
    //    and lay it out as a single row
    //    NOTE: plot is a descendent of QWidget, which uses an internal object of
    //          type JKQTBasePlotter, which does the actual plotting.
    //          So many properties of the plot are only available in this internal
    //          object, which you can access by plot.get_plotter().
    plot.get_plotter()->set_keyPosition(JKQTPkeyOutsideTopRight);
    plot.get_plotter()->set_keyLayout(JKQTPkeyLayoutOneRow);

    // 9 autoscale the plot so the graph is contained
    plot.zoomToFit();

    // show plotter and make it a decent size
    plot.show();
    plot.resize(600,400);

    return app.exec();
}
The result looks like this:

##Screenshots
###Scatter Plots and Boxplots

###Different Types of Barcharts

###Image Plots
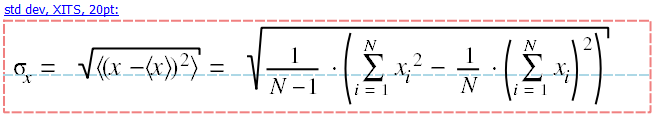
You can plot C-arrays as images in different color-coding styles. Diferent Overlays/masks are also available. Finally you can use LaTeX markup to format any axis/plot/tick/... label. there is an internal LaTeX parser in this package.

###Plotting a user-defined (parsed) function
Yes, a complete math expression parser is contained!

###Axis-Label styles in LogLog-Plot

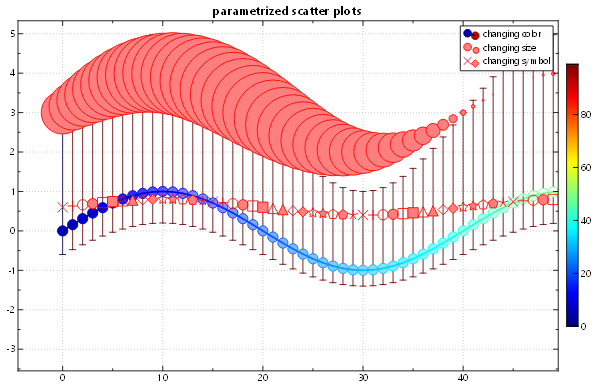
###Parametrized Scatter Plots and Data Viewer
Scatter Plots can have symbols where the shape/color/size is parametrized by a data column. Also the plotter is built around an internal datastore, which you can access (readonly!!!) by a data-viewer that is accessible from the contextmenu in any plot.
#JKQTmathText
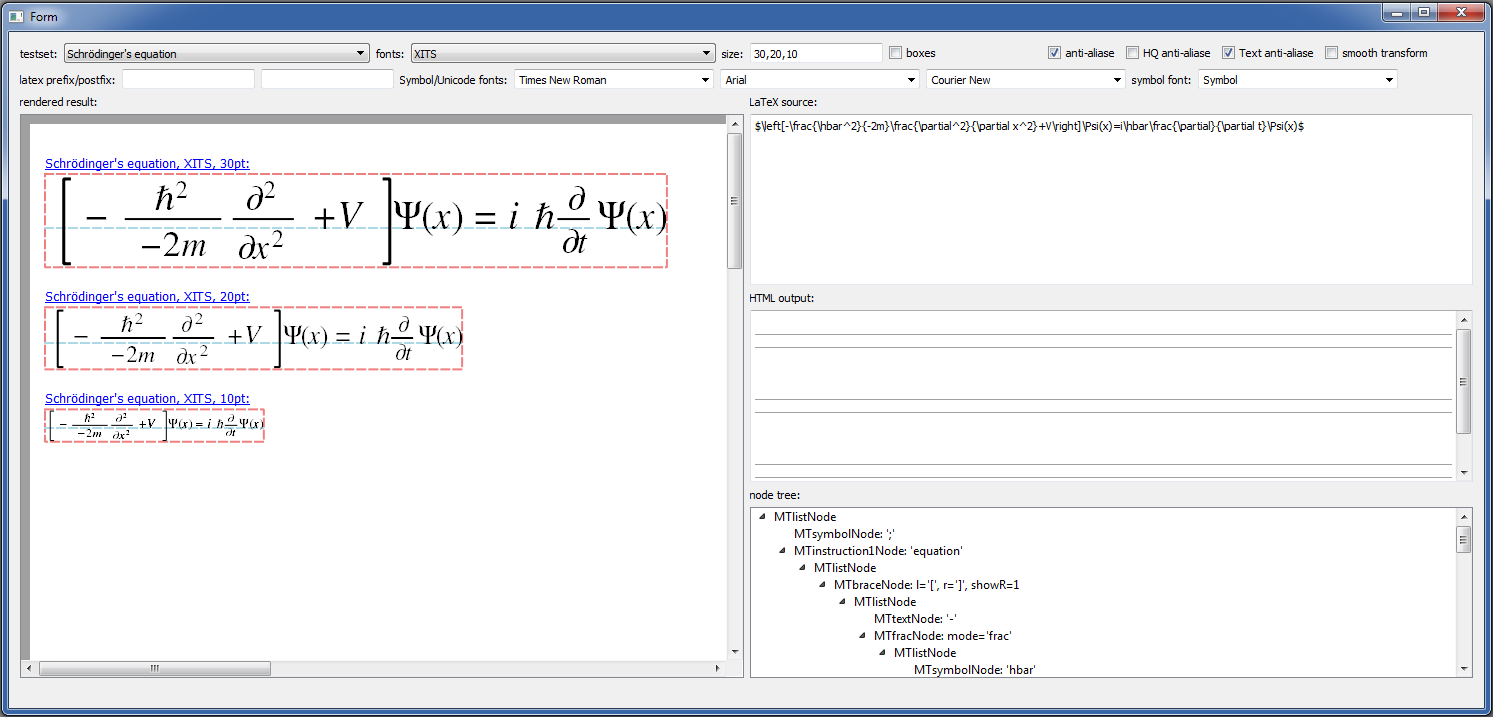
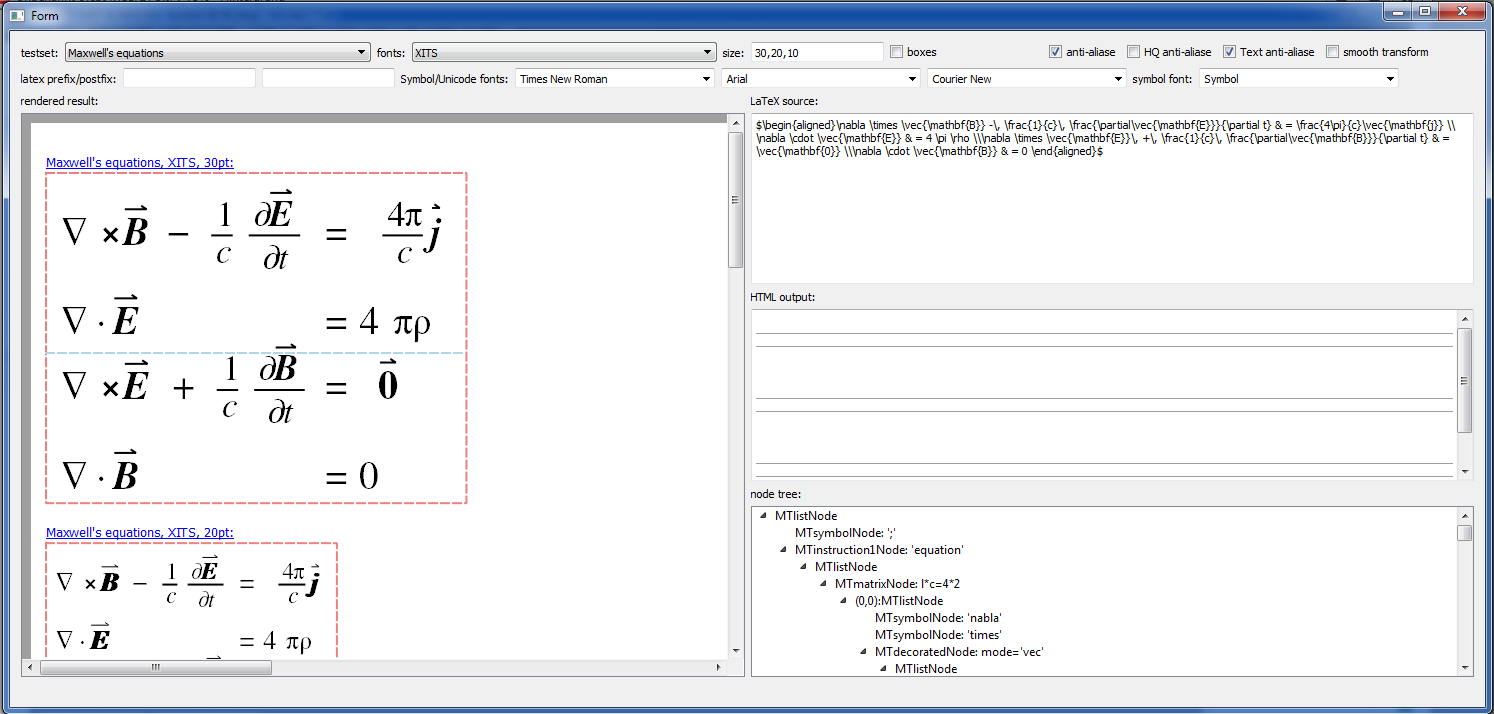
JKQTmathText is a hand-written LaTeX-renderer for Qt (implemented in native C++, using Qt). It supports a large set of standard LaTeX markup and can render it to a QPainter.
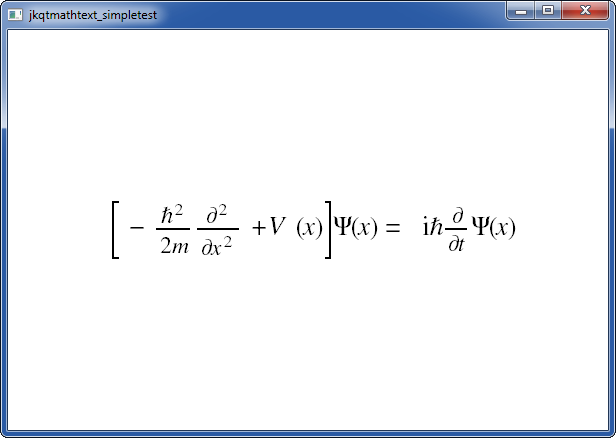
##A simple usage example
This project (see ./test/jkqtmathtext_simpletest/) simply creates a QLabel (as a new window) that displays a rendered LaTeX equation (here the time-dependent Schrödinger equation).
The QMake project looks like this (see ./test/jkqtmathtext_simpletest/jkqtmathtext_simpletest.pro):
# include JKQTmathText source-code, including the open-source XITS fonts
include(../../jkqtmathtext_with_xits.pri)
SOURCES += jkqtmathtext_simpletest.cpp

# if you don't want to use the XITS fonts, use this line (and uncomment the
# last two line!):
#include(../../jkqtmathtext.pri)

CONFIG += qt
QT += core gui
greaterThan(QT_MAJOR_VERSION, 4): QT += widgets printsupport

TARGET = jkqtmathtext_simpletest
And the soruce code of the main application is (see ./test/jkqtmathtext_simpletest/jkqtmathtext_simpletest.cpp):
#include <QApplication>
#include <QLabel>
#include <QPixmap>
#include "jkqtmathtext.h"

int main(int argc, char* argv[])
{
    QApplication app(argc, argv);

    // we use a simple label to display the math text
    QLabel lab;

    // 1. we will paint into a QPixmap
    QPixmap pix(600,400);
    pix.fill(QColor("white"));
    QPainter painter;

    // 2. now we create a JKQTmathText object.
    //    Also we configure the JKQTmathText to use the XITS fonts that
    //    were included in the *.pro-file
    JKQTmathText mathText;
    mathText.useXITS();
    mathText.set_fontSize(20);

    // 3. now we parse some LaTeX code (the Schroedinger's equation), so
    //    we can draw it onto the QPixmap in the next step
    mathText.parse("$\\left[-\\frac{\\hbar^2}{2m}\\frac{\\partial^2}{\\partial x^2}+V(x)\\right]\\Psi(x)=\\mathrm{i}\\hbar\\frac{\\partial}{\\partial t}\\Psi(x)$");

    // 3. here we do the painting
    painter.begin(&pix);
    mathText.draw(painter, Qt::AlignCenter, QRectF(0,0,pix.width(), pix.height()), false);
    painter.end();

    // now we display and resize the label as a window
    lab.setPixmap(pix);
    lab.show();
    lab.resize(600,400);

    return app.exec();
}
The result looks like this:
##Screenshots