Git Product home page Git Product logo

covid19r's Introduction

COVID19r

This repo is focused on reformatting the data provided by Johns Hopkins CSSE. Currently the data is filled as "wide" (meaning every new day gets a new column) where many users have expressed interest of wanting this data to be "long" or row based. I have written an R script which takes the time series data for Deaths, Confirmed Cases, and Recovered cases and converts the formatting to long form. In addition, I have fomatted the Date columns and added a *_Daily column for each of the three categories.

Origional template (Deaths only):

Province/ State Country/ Region Lat Long 1/22/20 1/23/20 ... 3/18/20
British Columbia Canada 49.2827 -123.1207 0 0 ... 4

New Version (Deaths, Confirmed, and Recovered):

ProvState Country Lat Long Date Deaths_Total Deaths_Daily Confirmed_Total Confirmed_Daily Recovered_Total Recovered_Daily
British Columbia Canada 49.2827 -123.1207 2020-03-16 4 3 103 30 4 0
British Columbia Canada 49.2827 -123.1207 2020-03-17 4 0 103 0 4 0
British Columbia Canada 49.2827 -123.1207 2020-03-18 7 3 186 83 4 0

For the full csv of the combined data see here.

Graphs

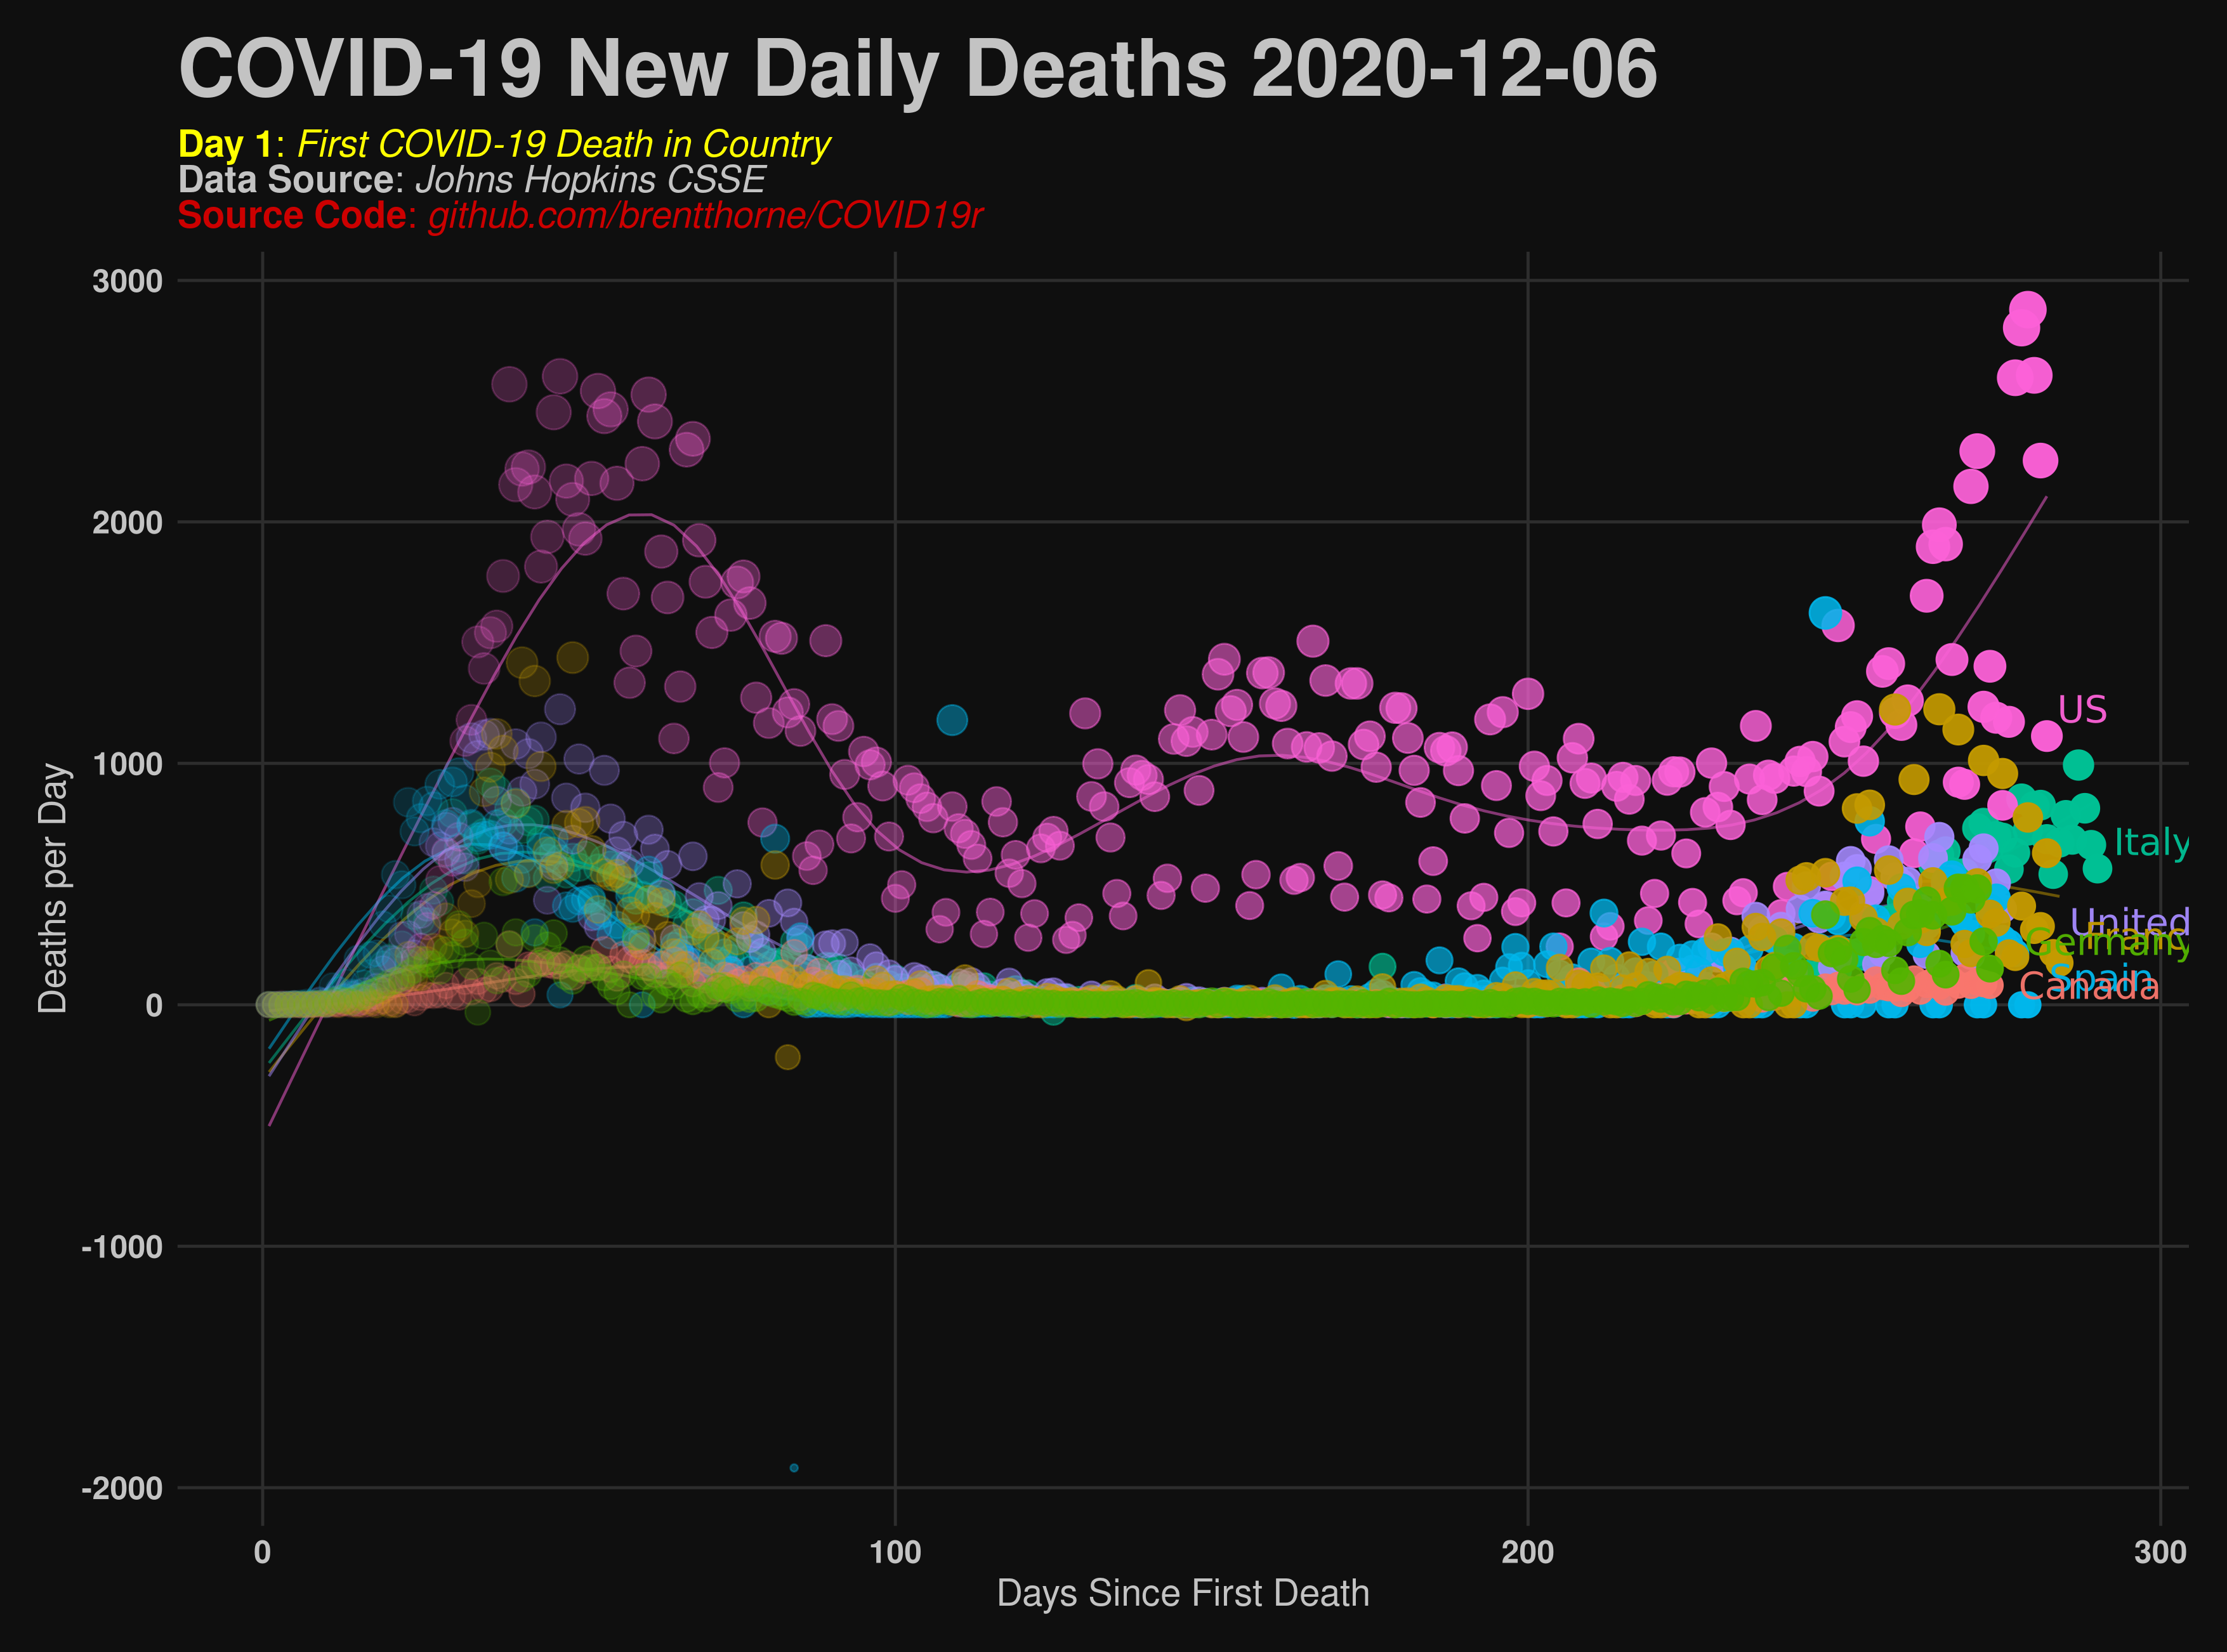
Here are examples of automated graphs comparing various countries to Italy made using this data using this R script:

![](https://raw.githubusercontent.com/brentthorne/COVID19r/master/figures/covid19-daily-deaths_USvEurope .png)

covid19r's People

Contributors

brentthorne avatar

Watchers

 avatar

Recommend Projects

  • React photo React

    A declarative, efficient, and flexible JavaScript library for building user interfaces.

  • Vue.js photo Vue.js

    ๐Ÿ–– Vue.js is a progressive, incrementally-adoptable JavaScript framework for building UI on the web.

  • Typescript photo Typescript

    TypeScript is a superset of JavaScript that compiles to clean JavaScript output.

  • TensorFlow photo TensorFlow

    An Open Source Machine Learning Framework for Everyone

  • Django photo Django

    The Web framework for perfectionists with deadlines.

  • D3 photo D3

    Bring data to life with SVG, Canvas and HTML. ๐Ÿ“Š๐Ÿ“ˆ๐ŸŽ‰

Recommend Topics

  • javascript

    JavaScript (JS) is a lightweight interpreted programming language with first-class functions.

  • web

    Some thing interesting about web. New door for the world.

  • server

    A server is a program made to process requests and deliver data to clients.

  • Machine learning

    Machine learning is a way of modeling and interpreting data that allows a piece of software to respond intelligently.

  • Game

    Some thing interesting about game, make everyone happy.

Recommend Org

  • Facebook photo Facebook

    We are working to build community through open source technology. NB: members must have two-factor auth.

  • Microsoft photo Microsoft

    Open source projects and samples from Microsoft.

  • Google photo Google

    Google โค๏ธ Open Source for everyone.

  • D3 photo D3

    Data-Driven Documents codes.