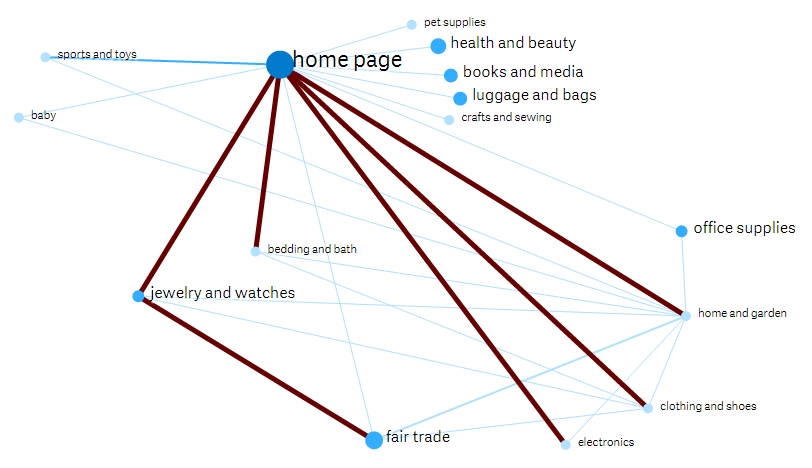
The Sigma chart is a node graph created in d3 and meant to provide a helpful way of navigating through a hairball of relationships. The different features that help to detangle the hairball are the following:
###Features:
- Zoom by scrolling your mouse
- Pan by clicking and dragging
- Mouse over the node to show only connected nodes and dashed lines when not
- Relative node/text size/color based on measure proportionality
- Relative line width/color based on measure proportionality
- Click and drag a node to manually place them for desired positioning
###Dimension/Measure configs:
- Dimension1: Source Field (e.g. Product1)
- Dimension2: Target Field (e.g. Product2)
- Measure 1: Edge Count/Weight (e.g. sum(MutuallyOccurringFrequency) )
- Measure 2: Node Count/Weight (e.g. sum(Sales) )
###Shortcomings:
- Selections require mirrored pairs of data; for example, existence of Source and Target would require to have Target and Source as well.
- If selections are made and the other side of the pair is not there, it shouldn't error out, just disallow the selection
###TO DO:
- Make selection-related data availability more self-service friendly, ie, dynamically generate pairs if not available
- Cluster groups of nodes together
- Paths and Arrows pointing in most traversed direction
- Employ d3.linear() function for proportional node/edge styling
- If data points over a certain amount, map/reduce to higher grain and drill in, OR employ Fisheye
Any help on above ToDO's would be appreciated via Pull Request.
###Screenshot: