Git Product home page Git Product logo

trading-signals's Introduction

Trading Signals

Language Details Code Coverage License Package Version

Technical indicators and overlays to run technical analysis with JavaScript / TypeScript.

Motivation

The "trading-signals" library provides a TypeScript implementation for common technical indicators with arbitrary-precision decimal arithmetic.

The main focus of this library is on the accuracy of calculations, but using the provided faster implementations you can also use it where performance is important.

All indicators can be updated over time by streaming data (prices or candles) to the update method. Some indicators also provide static batch methods for further performance improvements when providing data up-front during a backtest or historical data import.

Benefits & Features

  • Accurate. Indicators with intervals will return a result only when the period is reached.
  • Convenient. Indicators with intervals will save their all-time highs and lows.
  • Fast. If you need high throughput, you can use the included faster implementations.
  • Flexible. All advanced indicators support different smoothing overlays (WSMA, etc.).
  • Live. It allows for the replacement of values, enabling live charting.
  • Modern. Uses ECMAScript Modules (ESM) syntax.
  • Precise. Better accuracy than calculating with primitive numbers thanks to big.js.
  • Robust. Checked against common division by zero mistakes.
  • Tested. Code coverage is 100%. No surprises when using it.
  • Typed. Source code is 100% TypeScript. No need to install external typings.
  • Verified. All results are verified with other libraries to guarantee correctness.
  • Versatile. Indicators can be updated up-front or by streaming prices.

Technical Indicator Types

  • Trend indicators: Measure the direction of a trend (uptrend, downtrend or sideways trend)
  • Volume indicators: Measure the strength of a trend (based on volume)
  • Volatility indicators: Measure how much disagreement there is in the market based on price (statistical measure of its dispersion)
  • Momentum indicators: Measure the strength of a trend (based on price / speed of price movement)

Supported Technical Indicators

  1. Acceleration Bands (ABANDS)
  2. Accelerator Oscillator (AC)
  3. Average Directional Index (ADX)
  4. Average True Range (ATR)
  5. Awesome Oscillator (AO)
  6. Bollinger Bands (BBANDS)
  7. Bollinger Bands Width (BBW)
  8. Center of Gravity (CG)
  9. Commodity Channel Index (CCI)
  10. Directional Movement Index (DMI / DX)
  11. Double Exponential Moving Average (DEMA)
  12. Dual Moving Average (DMA)
  13. Exponential Moving Average (EMA)
  14. Mean Absolute Deviation (MAD)
  15. Momentum (MOM / MTM)
  16. Moving Average Convergence Divergence (MACD)
  17. On-Balance Volume (OBV)
  18. Rate-of-Change (ROC)
  19. Relative Strength Index (RSI)
  20. Simple Moving Average (SMA)
  21. Stochastic Oscillator (STOCH)
  22. Stochastic RSI (STOCHRSI)
  23. True Range (TR)
  24. Wilder's Smoothed Moving Average (WSMA / WMA / WWS / SMMA / MEMA)

Utility Methods:

  1. Average / Mean
  2. Standard Deviation
  3. Rolling Standard Deviation

Usage

import {Big, SMA} from 'trading-signals';

const sma = new SMA(3);

// You can add numbers individually:
sma.update(40);
sma.update(30);
sma.update(20);

// You can add multiple numbers at once:
sma.updates([20, 40, 80]);

// You can add strings:
sma.update('10');

// You can replace a previous value (useful for live charts):
sma.replace('40');

// You can add arbitrary-precision decimals:
sma.update(new Big(30));

// You can get the result in various formats:
console.log(sma.getResult().toFixed(2)); // "40.00"
console.log(sma.getResult().toFixed(4)); // "40.0000"

When to use update(...)?

You have to call an indicator's update method to enter input data. The update method may or may not return a result from the indicator depending on whether the minimum amount of input data has been reached.

When to use getResult()?

You can call getResult() at any point in time, but it throws errors unless an indicator has received the minimum amount of data. If you call getResult(), before an indicator has received the required amount of input values, a NotEnoughDataError will be thrown.

Example:

import {SMA} from 'trading-signals';

// Our interval is 3, so we need 3 input values
const sma = new SMA(3);

// We supply 2 input values
sma.update(10);
sma.update(40);

try {
  // We will get an error, because the minimum amount of inputs is 3
  sma.getResult();
} catch (error) {
  console.log(error.constructor.name); // "NotEnoughDataError"
}

// We will supply the 3rd input value
sma.update(70);

// Now, we will receive a proper result
console.log(sma.getResult().valueOf()); // "40"

Most of the time, the minimum amount of data depends on the interval / time period used.

Performance

Arbitrary-precision decimal arithmetic

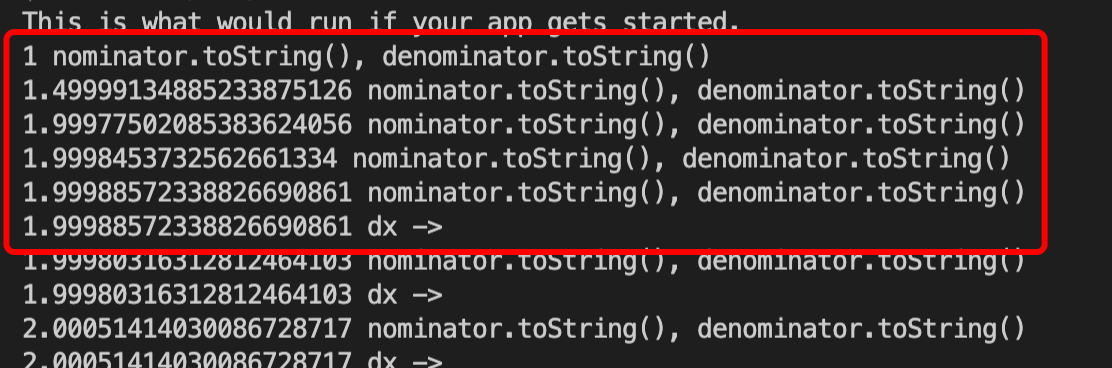
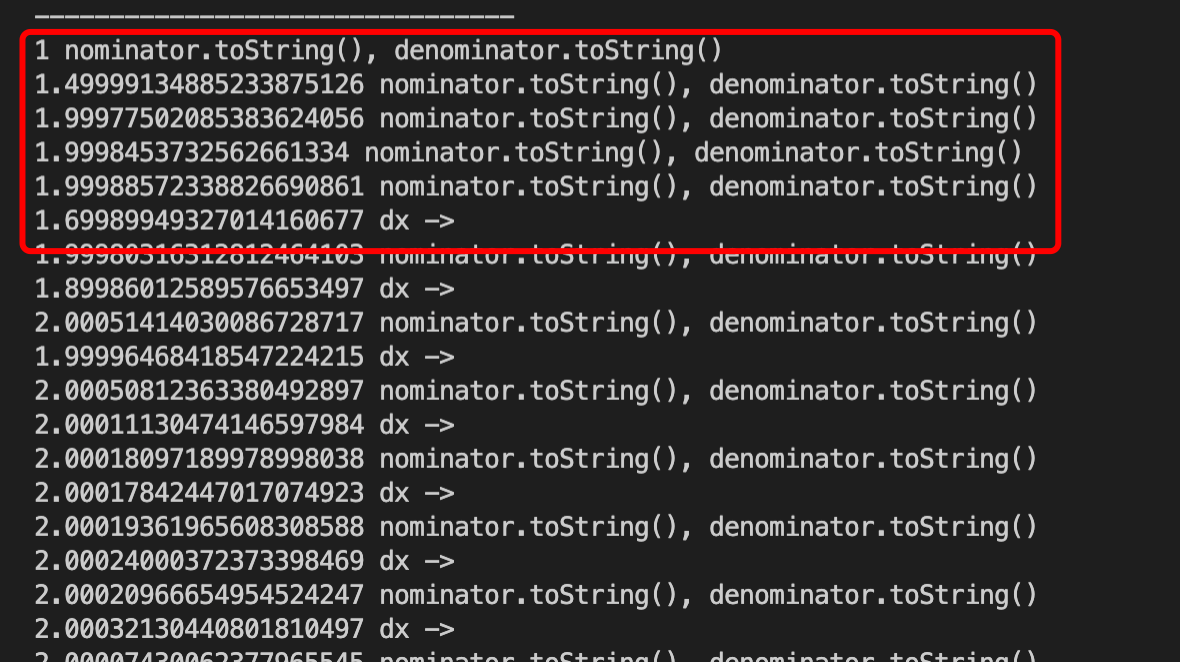
JavaScript is very bad with numbers. When calculating 0.1 + 0.2 it shows you 0.30000000000000004, but the truth is 0.3.

JavaScript arithmetic

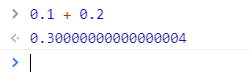
As specified by the ECMAScript standard, all arithmetic in JavaScript uses double-precision floating-point arithmetic, which is only accurate until certain extent. To increase the accuracy and avoid miscalculations, the trading-signals library uses big.js which offers arbitrary-precision decimal arithmetic. However, this arbitrary accuracy comes with a downside: Calculations with it are not as performant as with the primitive data type number.

Faster implementations

To get the best of both worlds (high accuracy & high performance), you will find two implementations of each indicator (e.g. SMA & FasterSMA). The standard implementation uses big.js and the Faster-prefixed version uses common number types. Use the standard one when you need high accuracy and use the Faster-one when you need high performance:

import {FasterSMA} from './SMA/SMA';

const fasterSMA = new FasterSMA(5);
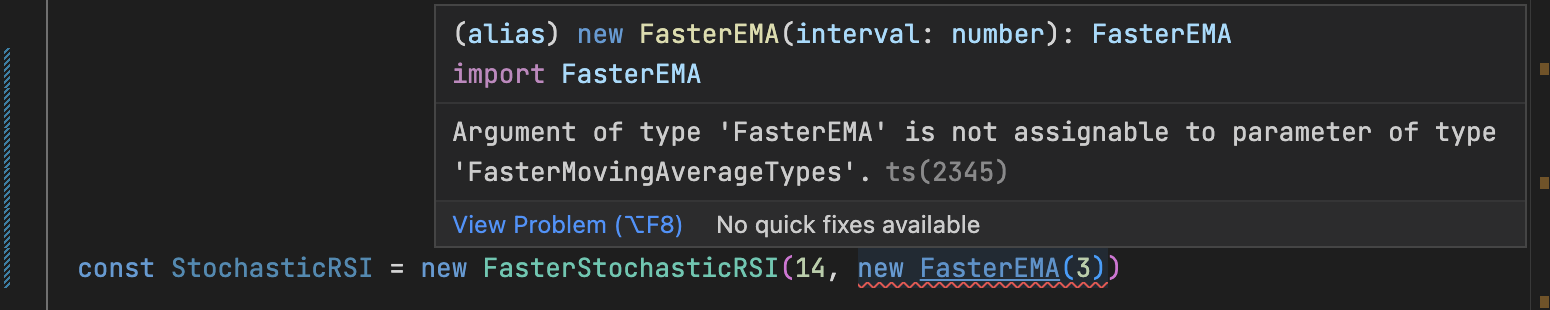
console.log(fasterSMA.updates([1, 2, 3, 4, 5]));
import {FasterStochasticRSI, FasterSMA} from 'trading-signals';

const fasterStochRSI = new FasterStochasticRSI(3, FasterSMA);
fasterStochRSI.update(1);
fasterStochRSI.update(2);
fasterStochRSI.update(3);
fasterStochRSI.update(4);
fasterStochRSI.update(5);
fasterStochRSI.update(6);

console.log(fasterStochRSI.getResult());

Benchmarks

You can run yarn start:benchmark to see the runtime performance of each technical indicator on your machine. This will give you an understanding of which indicators can be calculated faster than others.

Disclaimer

The information and publications of trading-signals do not constitute financial advice, investment advice, trading advice or any other form of advice. All results from trading-signals are intended for information purposes only.

It is very important to do your own analysis before making any investment based on your own personal circumstances. If you need financial advice or further advice in general, it is recommended that you identify a relevantly qualified individual in your jurisdiction who can advise you accordingly.

Alternatives

Maintainers

Benny Neugebauer on Stack Exchange

⭐️ Become a TypeScript rockstar! ⭐️

This package was built by Benny Code. Checkout my TypeScript course to become a coding rockstar!

License

This project is MIT licensed.

trading-signals's People

Contributors

andrewbarba avatar bennycode avatar dependabot-preview[bot] avatar dependabot[bot] avatar lums31 avatar nullobject avatar ozum avatar patotoma avatar

Stargazers

 avatar  avatar  avatar  avatar  avatar  avatar  avatar  avatar  avatar  avatar  avatar  avatar  avatar  avatar  avatar  avatar  avatar  avatar  avatar  avatar  avatar  avatar  avatar  avatar  avatar  avatar  avatar  avatar  avatar  avatar  avatar  avatar  avatar  avatar  avatar  avatar  avatar  avatar  avatar  avatar  avatar  avatar  avatar  avatar  avatar  avatar  avatar  avatar  avatar  avatar  avatar  avatar  avatar  avatar  avatar  avatar  avatar  avatar  avatar  avatar  avatar  avatar  avatar  avatar  avatar  avatar  avatar  avatar  avatar  avatar  avatar  avatar  avatar  avatar  avatar  avatar  avatar  avatar  avatar  avatar  avatar  avatar  avatar  avatar  avatar  avatar  avatar  avatar  avatar  avatar  avatar  avatar  avatar  avatar  avatar  avatar  avatar  avatar  avatar  avatar

Watchers

 avatar  avatar  avatar  avatar  avatar  avatar  avatar  avatar  avatar  avatar  avatar  avatar

trading-signals's Issues

Bug of update if the replace parameter is true when use FasterEMA

The function setResult In indicator.ts will export wrong value while the 'replace' parameter is true, beacuse 'this.previousResult' always replaced by 'this.result'. If 'replace' is true in continuous calls to 'update', you will get wrong result after second call

update(_price: BigSource, replace: boolean = false): Big {
    if (!replace) {
      this.pricesCounter++;
    } else if (replace && this.pricesCounter === 0) {
      this.pricesCounter++;
    }
    const price = new Big(_price);

    if (replace && this.previousResult) {
      return this.setResult(
        price.times(this.weightFactor).add(this.previousResult.times(1 - this.weightFactor)),
        replace
      );
    }
    return this.setResult(
      price.times(this.weightFactor).add((this.result ?? price).times(1 - this.weightFactor)),
      replace
    );
  }
  protected setResult(value: number, replace: boolean = false): number {
    if (replace && this.previousHighest !== undefined) {
      this.highest = value > this.previousHighest ? value : this.previousHighest;
    } else if (this.highest === undefined || value > this.highest) {
      this.previousHighest = this.highest;
      this.highest = value;
    }

    if (replace && this.previousLowest) {
      this.lowest = value < this.previousLowest ? value : this.previousLowest;
    } else if (this.lowest === undefined || value < this.lowest) {
      this.previousLowest = this.lowest;
      this.lowest = value;
    }

    this.previousResult = this.result;
    return (this.result = value);
  }

Got correct result after change to this

    if(!replace){
      this.previousResult = this.result;
    }

I want to PR a file, but I can't operate it

The content of the file is like this。

import Big, {BigSource} from 'big.js';

// 队列,存储里面的 泛型值
export class Queue {
queue: Array = [];

constructor(readonly maxLength: number) {}

// 往队列推入一个 泛型数据
push(item: T) {
if (this.queue.length >= this.maxLength) {
this.shift();
}
this.queue.push(item);
}

// 从第一个位置弹出元素
shift() {
if (!this.queue.length) {
return -1;
}
const val = this.queue.shift();

return val;

}

// 返回队列数据 limit 最新的数据
getItems(limit = 5) {
if (limit > this.queue.length) {
return this.queue;
}

return this.queue.slice(this.queue.length - limit);

}
}

export class BigSourceQueue extends Queue {
sum: Big = new Big(0);

constructor(readonly maxLength: number) {
super(maxLength);
}

// 往队列推入一个 k线对象
push(price: BigSource) {
super.push(price);
this.sum = this.sum.plus(price);
}

// 从第一个位置弹出元素
shift() {
const val = super.shift();
this.sum = this.sum.minus(val ?? 0);

return val;

}

// 返回队列最后一个元素
get last() {
return super.getItems(1)[0] ?? new Big(0);
}
}

export class StringQueue extends Queue {
constructor(readonly maxLength: number) {
super(maxLength);
}

// 返回队列最后一个元素
get last() {
return super.getItems(1)[0] ?? '';
}
}

How to use:
const result = new Queue(14); // For example, the parameters passed in by the constructor。 like RSI 14

is resampling possible?

Is resampling possible (convert 1h candles to 1d) and if yes is it continuous or on a new 1h candle, does all 1d will require a complete refresh? Thanks

Examples

Hi, a cant see examples of algorithms, how can i use any algorthm?

DEMA performance issues

Hi,

I'm using DEMA(1000) indicator for a 1s interval (so updating it every second).
After some time (5-10 min max), performances get sluggish, and updates don't even get solved in a second.
After restarting an app everything works again fine for some time.

Is there possibly some hidden memory leak?

Here's an example test which you can run and see how performance slowly degrades until it becomes unacceptable:

https://pastebin.com/tTtGhSDF

Thanks in advance.

Replacing update

Would be nice to have a method to be able to replace the last value, rather than pushing a new value to the dataset.

This way you can have live indicators, where the last data point will update in realtime until the next period of data is available. Otherwise you have to basically recreate the indicator and re-push all the values with the last value replaced if I'm not mistaken.

How can I update the last column's indicator of a realtime kline chart? eg: RSI

I am making a real-time K-line chart (like Binance), so the indicator of the last bar needs to be updated when new trades happened. But in the following rsi6 example, after calling the update() method, how to cancel the last value and recalc the current value?

const rsi6 = new RSI(6)

// some rsi6.update calls are hidden

// the first 20:10 bar's rsi with the 100 close value
rsi6.update(100)

// the later 20:10 bar's rsi should be update after some new trades? Need you help. Thx
rsi6.?

Stochastic RSI (division by zero)

I noticed that when the prices are the same for the previous and current candle in StochRSI, there is a Big division by zero issue. After debugging in, it looks like it's because the prev price is subtracting current, therefore the result is 0.

if (this.avgGain.isStable) {
    const relativeStrength = this.avgGain.getResult().div(this.avgLoss.getResult());
    return this.setResult(this.maxValue.minus(this.maxValue.div(relativeStrength.add(1))));
}

Line 35: node_modules/trading-signals/dist/RSI/RSI.js

Feature Request: Relative Moving Average (RMA)

Hi,

Thanks for this well-thought library.

Is it possible to add RMA to the library and support it in DMI and ADX? TradingView uses RMA in indicators such as DX, ADX, etc.

I use TradingView to check my strategies visually and then code them in Node.js. The lack of RMA causes different results for DMI and ADX in my scripts.

Below is the Pine Script code for RMA taken from TradingView:

pine_rma(src, length) =>
    alpha = 1/length
    sum = 0.0
    sum := na(sum[1]) ? ta.sma(src, length) : alpha * src + (1 - alpha) * nz(sum[1])

Thanks in advance,

MACD Result having confusing property names

Not sure, but I think diff and macd are switched in the MACD Result:

    /**
     * The MACD-Histogram represents the difference between MACD and its 9-day EMA, the signal line.
     */
    this.result = {
      diff: diff,
      macd: diff.sub(this.signal.getResult()),
      signal: this.signal.getResult(),
    };

From my understanding, the diff should actually be the difference between the macd and the signal, where the macd is the differnce between the two EMAs... What do you think @bennycode ?

replace in WSMA

I'm trying to add replace to ATR, but replace in WSMA and TR seems wrong. I created PR #666 for TR, but I cannot be sure about WSMA.

I created a test case. Could you please try the test below for WSMA in WSMA.test.ts?

    it('replace recently added values - 2', () => {
      const wsma = new WSMA(3);
      const fasterWSMA = new FasterWSMA(3);
      wsma.update('11');
      fasterWSMA.update(11);
      wsma.update('12');
      fasterWSMA.update(12);
      wsma.update('13');
      fasterWSMA.update(13);
      wsma.update('14');
      fasterWSMA.update(14);
      wsma.update('15');
      fasterWSMA.update(15);

      expect(wsma.getResult().toFixed(2)).toBe('13.44');
      expect(fasterWSMA.getResult().toFixed(2)).toBe('13.44');

      wsma.update('1000', true);
      fasterWSMA.update(1000, true);

      expect(wsma.getResult().toFixed(2)).toBe('341.78');
      expect(fasterWSMA.getResult().toFixed(2)).toBe('341.78');

      wsma.update('15', true);
      fasterWSMA.update(15, true);

      expect(wsma.getResult().toFixed(2)).toBe('13.44');
      expect(fasterWSMA.getResult().toFixed(2)).toBe('13.44');
    });

Is there a way to return an array for charting?

priceData =[
48.25,
47,
45.979999542236,
46.029998779297,
45.810001373291,
45.819999694824,
46.349998474121,
50.240001678467,
50.279998779297,
50.439998626709,
49,
51.270000457764,
48.529998779297,
52.430000305176,
41.360000610352,
39.470001220703,
41.729999542236,
42.759998321533,
43.709999084473,
43.119998931885
]

When I attempt to run Bolinger Bands as an example... I would expect a way to feed it an array of prices and have it give me back an array of prices for lower, middle, and upper.

With the price data above, and a window size of 3 I would expect to see the middle to be returned as:

[
0,
0,
47.07666651407866,
46.336666107177656,
45.939999898274664,
45.886666615803996,
45.99333318074533,
47.46999994913733,
48.95666631062833,
50.31999969482433,
49.906665802002,
50.236666361491,
49.599999745687,
50.74333318074567,
47.439999898275005,
44.420000712077005,
40.853333791097,
41.319999694824,
42.73333231608067,
43.196665445963674
]

There doesn't seem to be support for this as I can tell but I thought I would ask.

Please add TD Sequential indicator

The Tom Demark Sequential is a very popular indicator yet there are not libraries available for it in TS.

Strategy

image

  • Buy Strategy
    the trigger to buy ->
    When you see 9 consecutive closes “lower” than the close 4 bars prior.
    An ideal buy is when the low of bars 6 and 7 in the count are exceeded by the low of bars 8 or 9.

  • Sell Strategy
    trigger to sell ->
    When you see 9 consecutive closes “higher” than the close 4 candles prior.
    An ideal sell is when the the high of bars 6 and 7 in the count are exceeded by the high of bars 8 or 9.

Available in Python

https://github.com/freqtrade/freqtrade-strategies/blob/master/user_data/strategies/berlinguyinca/TDSequentialStrategy.py

Source

Hello!

How can we import this library via CDN ? I am using DENO.

ADX -DI and +DI

It would be good having Directional Indicators for ADX or as separate indicators. I took a look at ADX.js and it looks like they are calculated there.

How to user MACD?

Please could you show how to use MACD indicator? thankyou in advance

The RSI calculation fails with a certain dataset

I am trying to figure out why I cannot get the RSI to work with one certain dataset in JSON.
As a reference I tried the RSI with multiple datasets and all work great, it is just this one that does not seem to work. I debugged for a while and cant find the answer.

const calculateRSI = data => {
  
  const rsiData = data.map((dataPoint, index) => {
    if (index < 14) {
      return {
        rsi: null,
        price: dataPoint.price,
        date: dataPoint.date,
      }
    }

    let rsi = new RSI(14)
    for (let i = 0; i < 15; i++) {
      rsi.update(data[index - i].price)
    }

    const result = parseFloat(rsi.getResult().valueOf())
    return {
      rsi: result,
      price: dataPoint.price,
      date: dataPoint.date,
    }
  })
  
  return rsiData
}

I execute the function as follows:

const { RSI } = require('trading-signals')

const weeklyData = require('./weeklyData.json')
const rsi = calculateRSI(weeklyData)

I get the following error for the weeklyData:

NotEnoughDataError: Not enough data

This happens exactly at position 139 of the weekly array.
This does not happen with the dailyData array, which has exactly the same structure.

Any ideas what is going on?
I uploaded the json files in txt format as reference.

Thank you in advance.

dailyData.txt
weeklyData.txt

MACD Result inaccurate?

I saw in issue #165 that @bennycode was referring to this page to check MACD calculations against.
Problem is that if I use the same setup, the output is not even close to the one shown in the aforementioned page table.

Am I missing something here?

My test code:

import {EMA, MACD} from 'trading-signals';

const macd = new MACD({longInterval: 5, shortInterval: 2, signalInterval: 9, indicator: EMA});
macd.update(81.59);
macd.update(81.06);
macd.update(82.87);
macd.update(83);
macd.update(83.61);

console.log("Signal:" +parseFloat(result.signal.valueOf()).toFixed(4));
console.log("Macd:" +parseFloat(result.macd.valueOf()).toFixed(4));
console.log("Histogram:" +parseFloat(result.histogram.valueOf()).toFixed(4));

Result:

Signal: 0.2416
Macd: 0.6178
Histogram: 0.3762

Expected Result:

Signal: 0.62
Macd: 0.62
Histogram: 0.0

Replace and "What if" Scenarios

Hi,

In the README I saw the replace feature:

// You can replace a previous value (useful for live charts):
sma.update('40', true);

However, it is unavailable for indicators such as DX. Any suggestions on replacing the last candle and the result of DX?

const dx = new DX(14);

// I want to see results for what-if scenarios.
const dxA = dx.update( { high: 10, low: 3, close: 2 } );

// I want to see the result without the previous update
const dxB = dx.update( { high: 8, low: 2, close: 6 }, true );

Thanks,

Standard Deviations on Bollinger Bands

Good day, I just wanted to know if it would be possible to change the standard deviation on BBANDS with this library? I'm looking at the test file and it's clear that you can check to see if the standard deviation is 2, but I see no indication that this can be changed to a std dev of 1 or 3 for example, could you clarify this? I did try some testing in my application but I'm not very familiar with TS and the library to know if this is even possible.

Thanks!

Add caching and fallback capabilities

For example, for the current 15 minute K-line, the data is changed, and can only be updated at the end of the current 15 minutes. How to change the newly added K-line without changing the original data set.
image

How can I use it with the nodejs require?

How can I use it with the classic nodejs require manner?

I want to use it like this:
const { RSI } = require('trading-signals');

Is it possible? If not, then what do you recommend?

RSI performance degradation

First of all, thanks for the project! Great work!

When I add the RSI with defaults to my simulations I get a huge performance degradation over time. The RSI update gets slower and slower. Is it expected, am I doing something wrong or is there really a bug hiding in there?

import { Big, BigSource } from 'big.js';
import { BollingerBands, EMA, RSI, SMMA } from 'trading-signals';
import { BandsResult } from 'trading-signals/dist/BANDS/BandsResult';
import { TradeAdvisor } from '../trade-advisor.interface';
import { BaseTradeAdvisor } from '../trade-base-advisor';
import {
  TestBounceAdvisorConfig,
  getMergedConfig,
} from './test-bounce-config';

export class TestBounceAdvisor
  extends BaseTradeAdvisor<BigSource | BandsResult>
  implements TradeAdvisor
{
  private config: TestBounceAdvisorConfig;

  private buyRsi: RSI;
  private buyBands: BollingerBands;
  private buySpreadBands: BollingerBands;
  private sellRsi: RSI;
  private sellBands: BollingerBands;
  private sellSpreadBands: BollingerBands;

  private updateCount = 0;

  constructor(config?: TestBounceAdvisorConfig) {
    super();
    this.config = getMergedConfig(config);
    this.initIndicators();
  }

  private initIndicators() {
    this.initBuyIndicators();
    this.initSellIndicators();
  }

  private initBuyIndicators() {
    this.buyRsi = new RSI(
      this.config.rsi.interval,
      this.config.rsi.indicator === 'ema' ? EMA : SMMA,
    );
    this.buyBands = new BollingerBands(
      this.config.bb.interval,
      this.config.bb.deviationMultiplier,
    );
    this.buySpreadBands = new BollingerBands(
      this.config.bb.interval,
      this.config.bb.deviationMultiplier,
    );
  }

  private initSellIndicators() {
    this.sellRsi = new RSI(
      this.config.rsi.interval,
      this.config.rsi.indicator === 'ema' ? EMA : SMMA,
    );
    this.sellBands = new BollingerBands(
      this.config.bb.interval,
      this.config.bb.deviationMultiplier,
    );
    this.sellSpreadBands = new BollingerBands(
      this.config.bb.interval,
      this.config.bb.deviationMultiplier,
    );
  }

  update(buyPrice: BigSource, sellPrice: BigSource) {
    this.updateIndicators(buyPrice, this.buyRsi, this.buyBands);
    this.updateIndicators(sellPrice, this.sellRsi, this.sellBands);

    if (this.buyBands.isStable && this.sellBands.isStable) {
      this.updateIndicators(this.getSpread(this.buyBands), this.buySpreadBands);
      this.updateIndicators(
        this.getSpread(this.sellBands),
        this.sellSpreadBands,
      );
    }

    // Count all updates as one
    this.updateCount += 1;
  }

  getUpdateCount() {
    return this.updateCount;
  }

  getUpdateCountdown(): number {
    const maxInterval = Math.max(
      this.config.bb.interval,
      this.config.rsi.interval,
    );
    return Math.max(0, maxInterval * 2 - this.updateCount); // spreadBands are updated later
  }

  isCalibrated() {
    return (
      this.buyRsi.isStable &&
      this.buyBands.isStable &&
      this.buySpreadBands.isStable &&
      this.sellRsi.isStable &&
      this.sellBands.isStable &&
      this.sellSpreadBands.isStable
    );
  }

  shouldBuy(price: BigSource) {
    const spread = this.getSpread(this.buyBands);
    return (
      this.isRsiSignalingBuy(this.buyRsi) &&
      this.isBBandsSignalingBuy(this.buyBands, price) &&
      this.isBBandsSpreadStable(this.buySpreadBands, spread)
    );
  }

  shouldSell(price: BigSource) {
    const spread = this.getSpread(this.sellBands);
    return (
      this.isRsiSignalingSell(this.sellRsi) &&
      this.isBBandsSignalingSell(this.sellBands, price) &&
      this.isBBandsSpreadStable(this.sellSpreadBands, spread)
    );
  }

  private isRsiSignalingBuy(rsi: RSI) {
    return rsi.getResult().lt(30);
  }

  private isRsiSignalingSell(rsi: RSI) {
    return rsi.getResult().gt(70);
  }

  private isBBandsSignalingBuy(bbands: BollingerBands, price: BigSource) {
    return bbands.getResult().lower.gte(price);
  }

  private isBBandsSignalingSell(bbands: BollingerBands, price: BigSource) {
    return bbands.getResult().upper.lte(price);
  }

  private isBBandsSpreadStable(spreadBands: BollingerBands, spread: Big) {
    const spreadBandsResult = spreadBands.getResult();
    return (
      spread.gt(spreadBandsResult.lower) && spread.lt(spreadBandsResult.upper)
    );
  }

  private getSpread(bbands: BollingerBands) {
    const result = bbands.getResult();
    return result.upper.minus(result.lower);
  }
}

Thanks in advance!

Error while using with TypeScript and Node.js

This library is very useful for live charting and I liked the update method on the indicators.

But unfortunately when I installed this in a typescript project I got some errors mentioned below.

How to reproduce

  1. I used a typescript boiler plate to start a project from scratch: https://github.com/stemmlerjs/simple-typescript-starter
  2. Installed the library: npm i trading-signals
  3. Start development run: npm run start:dev

I am using the example mentioned in the library home page at npmjs.com

import {Big, SMA} from 'trading-signals';

const sma = new SMA(3);

// You can add numbers individually:
sma.update(40);
sma.update(30);
sma.update(20);

// You can add multiple numbers at once:
sma.updates([20, 40, 80]);

// You can add strings:
sma.update('10');

// You can replace a previous value (useful for live charts):
sma.update('40', true);

// You can add arbitrary-precision decimals:
sma.update(new Big(30));

// You can get the result in various formats:
console.log(sma.getResult().toFixed(2)); // "40.00"
console.log(sma.getResult().toFixed(4)); // "40.0000"

Now I am getting this error

[nodemon] starting `npx ts-node ./src/index.ts`
/home/ebin/programming/js/simple-typescript-starter/node_modules/ts-node/dist/index.js:851
            return old(m, filename);
                   ^
Error [ERR_REQUIRE_ESM]: require() of ES Module /home/ebin/programming/js/simple-typescript-starter/node_modules/trading-signals/dist/index.js from /home/ebin/programming/js/simple-typescript-starter/src/index.ts not supported.
Instead change the require of index.js in /home/ebin/programming/js/simple-typescript-starter/src/index.ts to a dynamic import() which is available in all CommonJS modules.
    at require.extensions.<computed> [as .js] (/home/ebin/programming/js/simple-typescript-starter/node_modules/ts-node/dist/index.js:851:20)
    at Object.<anonymous> (/home/ebin/programming/js/simple-typescript-starter/src/index.ts:3:25)
    at m._compile (/home/ebin/programming/js/simple-typescript-starter/node_modules/ts-node/dist/index.js:857:29) {
  code: 'ERR_REQUIRE_ESM'
}
[nodemon] app crashed - waiting for file changes before starting...

I found one of the closed issues in this repo: #644, but I am not using require function to import the library. But the version 3.7 is working for me without any issues, but I would like to get latest version working too because I can leverage most recent updates in this library.

@bennycode any reason why I am getting this?

Using FasterAC

Hi there,

Thank you very much for the great indicators library. I am trying to use the FasterAC indicator, but I always get the error:

  NotEnoughDataError: Not enough data
    at FasterAC.getResult (Indicator.ts:67:13)

I am creating the indicator with a valid time serie, feeding the close values to the FasterAC (I tried many other things like feeding the high and the low...):

const AC = new FasterAC(shortAO, longAO, signal); // or simply const AC = new FasterAC(2, 2, 2);

timeSerie.forEach(d => {
  try {
    AC.update(d.close);
    console.log(d.close);

    try {
      const result = AC.getResult();
      console.log(result);
      seriesData.push({ value: result.high, date: d.date }); 
    } catch (error) {
      console.log(error);
      seriesData.push({ value: null, date: d.date });
    }
  } catch (error) {
    console.error("Error updating AC: ", error);
  }
});

Thanks for your help!

Update and recompute?

First off, great library. Thank you for creating it. Is there a way to update the latest sample and recomppute? Right now, it seems you can only add to a sample set and get a running result.

I am trying to use this in a streaming application. Appreciate any help.

Feature Request : Weighted Moving Average

Would it be possible to add support for Weighted moving average ?
It would be a useful indicator to have.

It assigns greater weighting to recent data points and less weighting on past data points. The weighted moving average is calculated by multiplying each observation in the data set by a predetermined weighting factor.

link to more info

Also available in trading view by default.

How to remove old datas

Hi and thanks for this great library

A general question about all technicals indicators.

How to limit the size of data ?

Exemple, I want only add max 500 values for calculations.

How to limit this ? What is the command to remove the first element of the values ?

replace in TR indicator produces wrong results

Hi,

Related to #665, I checked the replace feature in the TR indicator. It is not working correctly, and test for replace is missing.

I created PR #666 to fix this issue and add related tests.

In light of this issue, it would be beneficial to check the general points below:

  • Test coverage was reporting 100%, even though test for replace = true is missing in TR.
  • Other indicators may need tests for replacement, too.

Best,

bug of update function if 'replace' parameter is true when use FasterEMA

The function setResult In indicator.ts will export wrong value while the 'replace' parameter is true, beacuse 'this.previousResult' always replaced by 'this.result'. it should not be replaced if 'replace' parameter is true

protected setResult(value: number, replace: boolean = false): number {
    if (replace && this.previousHighest !== undefined) {
      this.highest = value > this.previousHighest ? value : this.previousHighest;
    } else if (this.highest === undefined || value > this.highest) {
      this.previousHighest = this.highest;
      this.highest = value;
    }

    if (replace && this.previousLowest) {
      this.lowest = value < this.previousLowest ? value : this.previousLowest;
    } else if (this.lowest === undefined || value < this.lowest) {
      this.previousLowest = this.lowest;
      this.lowest = value;
    }

    this.previousResult = this.result;
    return (this.result = value);
  }

Fixed it by

 if(!replace){
      this.previousResult = this.result;
    }

Building library

Hi,

I am new to node world. How could i build library from source, that i can use.
I tried building and got error
$ yarn clean && yarn build
$ rimraf .nyc_output coverage dist
$ tsc
../node_modules/@types/node/ts3.2/index.d.ts:19:22 - error TS6053: File '/Users/mihaelv/node_modules/@types/node/ts3.2/util.d.ts' not found.

19 ///
~~~~~~~~~
Than you in advance for answering

Difference between allowed data supplied to WSMA and FasterWSMA

This is minor. WSMA allows numbers contained in strings and FasterWSMA does not. I ran into the issue switching between the two of them. Adding a parseFloat to my data allowed FasterWSMA to work correctly.

Thank you for the work you have done. It has been very helpful.

feat: increased performance with Rust/Napi rs

Hi @bennycode,

I currently use your package into a project where i perform many calculations.
Since this lib do heavy calculations, here i think that switching the fast implementation from native number to a Rust with Napi RS could increase performance significantly.

Here i would like to get your point of view about this idea applied to your lib.

As an open source contributor and curious about the new trend about making some NodeJS lib faster with Rust, i found that your lib could be a perfect project to learn Node to Rust stuff in a useful way for me.

Feel free to tell me what you think about this ?

I'll be happy to take a look and check architectural details to try/benchmark a first part of the lib.

RSI Not accurate?

const rsi = new RSI(14)

Get OHLCV data from Binance.
... update with with last 500 (1h) candles using closed value.

rsi.update(Big(candle[4]));
console.log('RSI:', Number(rsi.getResult().valueOf()))

...

https://uk.tradingview.com/chart/WBgn29wN/ - 1h WRXBTC Binance

image

at 4am for example I'm getting
RSI: 63.476620248325204 where as trading view shows 70

image

is ADX correct? (difference with TradingView)

I'm comparing the results from TradingView charts (with ADX built in indicator), same input period, same candles (this is ok because the SMA for example is returning same values in TradingView and with trading-signals), but the result for ADX is not the same!
Does somebody know why is that?
Do you know some other chart with ADX indicator to compare with a 3rd reference?

This is the code used by TradingView (in PineScript):

up = change(high)
down = -change(low)
plusDM = na(up) ? na : (up > down and up > 0 ? up : 0)
minusDM = na(down) ? na : (down > up and down > 0 ? down : 0)
truerange = rma(tr, len)
plus = fixnan(100 * rma(plusDM, len) / truerange)
minus = fixnan(100 * rma(minusDM, len) / truerange)
sum = plus + minus
adx = 100 * rma(abs(plus - minus) / (sum == 0 ? 1 : sum), adxlen)

plusDM and minusDM is the equivalent to
const { mdm, pdm } = this.directionalMovement(this.prevCandle, candle);
and they are returning the same values in TradingView and trading-signals., but the rest of the code is a bit confusing, can you note some difference in the way is calculated the ADX in TradingView? which one is the correct?

Recommend Projects

  • React photo React

    A declarative, efficient, and flexible JavaScript library for building user interfaces.

  • Vue.js photo Vue.js

    🖖 Vue.js is a progressive, incrementally-adoptable JavaScript framework for building UI on the web.

  • Typescript photo Typescript

    TypeScript is a superset of JavaScript that compiles to clean JavaScript output.

  • TensorFlow photo TensorFlow

    An Open Source Machine Learning Framework for Everyone

  • Django photo Django

    The Web framework for perfectionists with deadlines.

  • D3 photo D3

    Bring data to life with SVG, Canvas and HTML. 📊📈🎉

Recommend Topics

  • javascript

    JavaScript (JS) is a lightweight interpreted programming language with first-class functions.

  • web

    Some thing interesting about web. New door for the world.

  • server

    A server is a program made to process requests and deliver data to clients.

  • Machine learning

    Machine learning is a way of modeling and interpreting data that allows a piece of software to respond intelligently.

  • Game

    Some thing interesting about game, make everyone happy.

Recommend Org

  • Facebook photo Facebook

    We are working to build community through open source technology. NB: members must have two-factor auth.

  • Microsoft photo Microsoft

    Open source projects and samples from Microsoft.

  • Google photo Google

    Google ❤️ Open Source for everyone.

  • D3 photo D3

    Data-Driven Documents codes.